. 2023 Jun 23:(196):10.3791/65538.
doi: 10.3791/65538.

Live-Cell Imaging of Drosophila melanogaster Third Instar Larval Brains

Affiliations

Live-Cell Imaging of Drosophila melanogaster Third Instar Larval Brains

Roberto Carlos Segura et al. J Vis Exp. .

Abstract

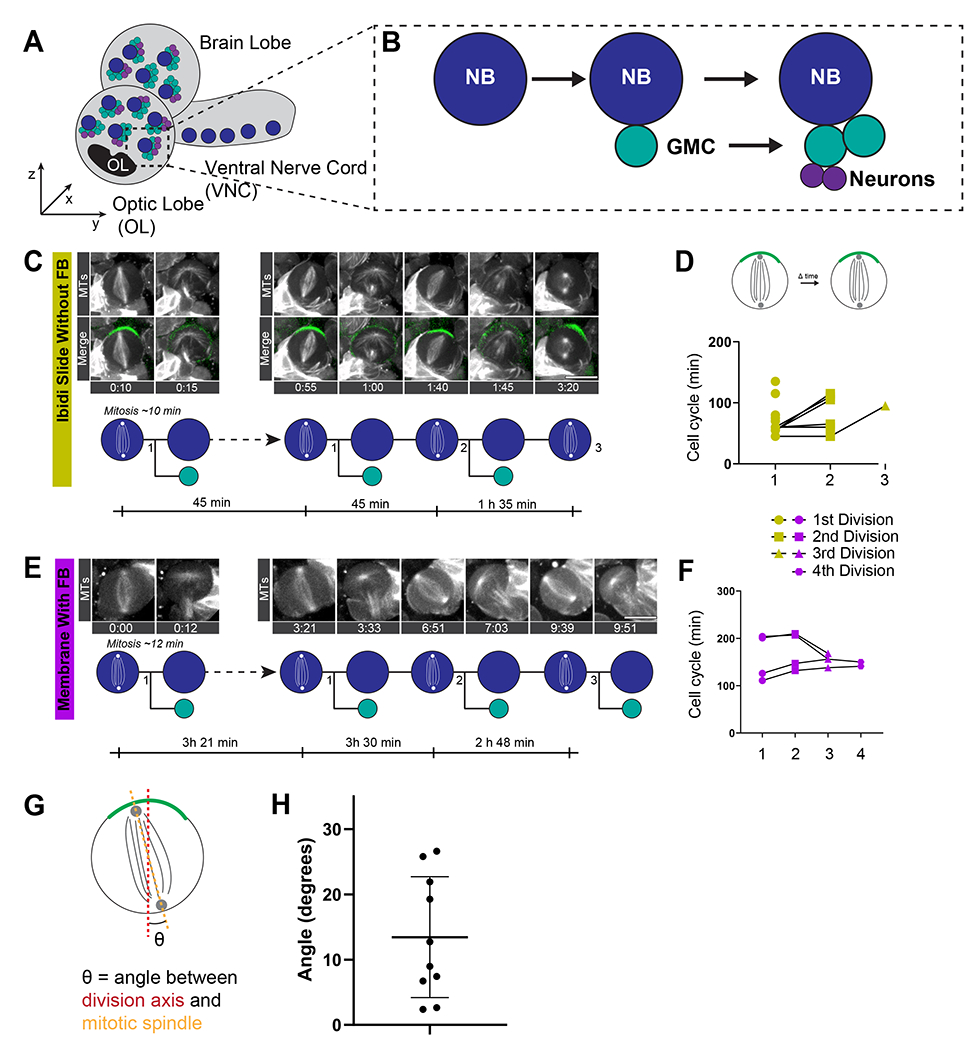
Drosophila neural stem cells (neuroblasts, NBs hereafter) undergo asymmetric divisions, regenerating the self-renewing neuroblast, while also forming a differentiating ganglion mother cell (GMC), which will undergo one additional division to give rise to two neurons or glia. Studies in NBs have uncovered the molecular mechanisms underlying cell polarity, spindle orientation, neural stem cell self-renewal, and differentiation. These asymmetric cell divisions are readily observable via live-cell imaging, making larval NBs ideally suited for investigating the spatiotemporal dynamics of asymmetric cell division in living tissue. When properly dissected and imaged in nutrient-supplemented medium, NBs in explant brains robustly divide for 12-20 h. Previously described methods are technically difficult and may be challenging to those new to the field. Here, a protocol is described for the preparation, dissection, mounting, and imaging of live third-instar larval brain explants using fat body supplements. Potential problems are also discussed, and examples are provided for how this technique can be used.


Figures

Figure 1:
Figure 1:. Materials.
(A) Dissection microscope. (B) Collection cage containing flies of the desired genotype and a meal cap with growing larvae. (C) Dissection and imaging medium, 5 mL. (D) Meal caps with larvae from three different collections. (E,E’) Microdissection tools, from left to right: microdissection scissors, forceps. (F,F’) Dissection dish. (G) An 8-welled μ-slide for imaging the samples.
Figure 2:
Figure 2:. Example meal caps.
(A) Two vials with male and female flies to be crossed, an empty embryo collection cage, and a fresh meal cap. (B) The bottom of the embryo collection cage with the new meal cap (left) and the top of the cage with flies (right). (C) The fully assembled fly cage. (D) An example of a well-staged meal cap with larvae for dissection. Note that the food is disturbed by the larvae, but not over-disturbed. (E,F) Two examples of 4 day old, overcrowded meal caps. Note that that food now has a soup-like consistency to it.
Figure 3:
Figure 3:. Dissection.
(A) Dorsal view of a third instar larva. The red line on the posterior end of the larva denotes where the first cut should be made. (B) Dorsal view of the larva after removing the posterior end. (C) Diagram showing how to invert the larva. Using one set of forceps, hold the larva by the cuticle near where the first cut was made. Using the other forceps, press into the anterior end of the larva to invert. The black arrows denote the direction of the forceps, with one “pushing into” the larvae from the anterior side and the other moving the cut posterior end towards the anterior end. The smaller red arrow denotes a cartoon of fat bodies. (D) View of an inverted larva with the fat bodies and digestive tract still attached. (E) View of an inverted larva with the non-CNS tissue removed. The red dashed line outlines the still-attached brain. (F) Schematic showing how to remove the brain from the cuticle. The red dashed line indicates the path to cut with microdissection scissors to release the brain from the inverted cuticle, and the black arrows denote the removal of the brain from the cuticle. (G) A view of the inverted brain that is still attached to the cuticle by a small number of axonal connections under the ventral nerve cord (VNC). (H) An isolated larval brain. The brain lobes are outlined with dashed orange lines. (I) Isolated fat bodies.
Figure 4:
Figure 4:. Mounting and imaging.
(A) View of the components for assembling a membrane-bound metal slide. (B) Schematic of the components of the membrane-bound slide and their assembly. (C) Side view of the membrane inserted into the metal slide, held in place by the split metal ring. (D) Top view of the assembled imaging slide without a coverslip. The dissection and imaging medium containing fat bodies and dissected brains has been placed onto the membrane. (E) Zoomed-in view of the fat bodies and brains in the drop of medium. (F) Top view of the metal slide after adding the glass coverslip. (G) Top view of the assembled slide with the glass coverslip fixed to the slide with melted petroleum jelly. Covering the edges of the coverslip with petroleum jelly also prevents evaporation of the medium. (H) Schematic of the assembled membrane slide with brains oriented for observation on an inverted microscope. The blue circles denote NBs in the central brain lobes and VNC. (I) View of an empty multi-well slide. (J) Zoomed-in view of one well of the multi-well imaging slide. (K) Schematic showing the brain orientation for imaging the central brain lobes on an inverted microscope with a multi-well slide. The blue circles denote NBs in the central brain lobes and VNC.
Figure 5:
Figure 5:. Quantification of the cell cycle length.
(A) Diagram of a third instar larval brain, highlighting the brain lobes, the optic lobe (OL, dark gray), the ventral nerve cord (VNC), NBs (dark blue), GMCs (light blue), and neurons (purple) within the central brain lobes and VNC. (B) Schematic of NB and GMC divisions. (C) Image series of a wild-type NB with microtubules labeled in white (MTs, UAS-Cherry::Jupiter) and apical Pins (Pins::EGFP in green) imaged in a multi-well slide without fat body supplementation for 4 h. Merged images and the corresponding lineage tree with cell cycle timing are shown below. Scale bar = 10 μm. (D) Quantification of the cell cycle length (metaphase – metaphase) for the first, second, and third divisions in samples imaged on a multi-well slide without fat bodies. (E) Image series of a wild-type NB with microtubules labeled in white (MTs, UAS-Cherry::Jupiter) imaged with a membrane-bound slide with fat body supplementation for 10 h with the corresponding lineage tree and cell cycle timing shown below. Scale bar = 10 μm. (F) Quantification of cell cycle length (metaphase – metaphase) for the first, second, third, and fourth divisions in samples imaged on a membrane-bound slide with fat bodies. (G) Schematic of how the angle between the spindle axis (orange dashed line) and division axis (θ, red dashed line) was determined. (H) Quantification of θ from 10 cells imaged using a multi-well slide without fat bodies.

References

    1. Delgado MK, Cabernard C Mechanical regulation of cell size, fate, and behavior during asymmetric cell division. Current Opinion in Cell Biology. 67, 9–16 (2020). - PMC - PubMed
    1. Sunchu B, Cabernard C Principles and mechanisms of asymmetric cell division. Development. 147 (13), dev167650 (2020). - PMC - PubMed
    1. Homem CCF, Knoblich JA Drosophila neuroblasts: A model for stem cell biology. Development. 139 (23), 4297–4310 (2012). - PubMed
    1. Gallaud E, Pham T, Cabernard C Drosophila melanogaster neuroblasts: A model for asymmetric stem cell divisions. Results and Problems in Cell Differentiation. 61 (1489), 183–210 (2017). - PubMed
    1. Loyer N, Januschke J Where does asymmetry come from? Illustrating principles of polarity and asymmetry establishment in Drosophila neuroblasts. Current Opinion in Cell Biology. 62, 70–77 (2020). - PubMed

Publication types

Substances

LinkOut - more resources