. 2023 Sep 4;220(9):e20221111.
doi: 10.1084/jem.20221111. Epub 2023 Jul 10.

Inflammatory and tolerogenic myeloid cells determine outcome following human allergen challenge

Affiliations

Inflammatory and tolerogenic myeloid cells determine outcome following human allergen challenge

Astrid L Voskamp et al. J Exp Med. .

Erratum in

Abstract

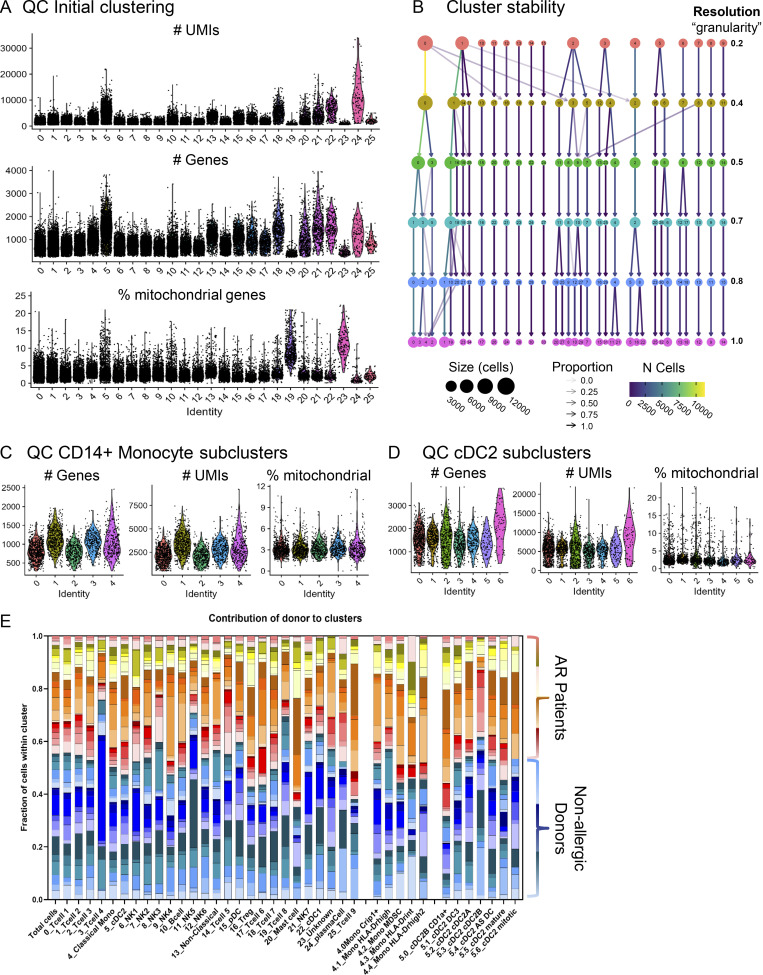
Innate mononuclear phagocytic system (MPS) cells preserve mucosal immune homeostasis. We investigated their role at nasal mucosa following allergen challenge with house dust mite. We combined single-cell proteome and transcriptome profiling on nasal immune cells from nasal biopsies cells from 30 allergic rhinitis and 27 non-allergic subjects before and after repeated nasal allergen challenge. Biopsies of patients showed infiltrating inflammatory HLA-DRhi/CD14+ and CD16+ monocytes and proallergic transcriptional changes in resident CD1C+/CD1A+ conventional dendritic cells (cDC)2 following challenge. In contrast, non-allergic individuals displayed distinct innate MPS responses to allergen challenge: predominant infiltration of myeloid-derived suppressor cells (MDSC: HLA-DRlow/CD14+ monocytes) and cDC2 expressing inhibitory/tolerogenic transcripts. These divergent patterns were confirmed in ex vivo stimulated MPS nasal biopsy cells. Thus, we identified not only MPS cell clusters involved in airway allergic inflammation but also highlight novel roles for non-inflammatory innate MPS responses by MDSC to allergens in non-allergic individuals. Future therapies should address MDSC activity as treatment for inflammatory airway diseases.


Conflict of interest statement

Disclosures: H.H. Smits reported grants from Lung Foundation Netherlands outside the submitted work. No other disclosures were reported.

Figures

Figure 1.
Figure 1.
Study setup, proteomic data clustering, and lineage identification. (A) Schematic of study design and protocol for single-cell transcriptomic and proteomic data collection and analysis of nasal biopsy cells from allergic and non-allergic individuals. (B) Heatmap of nasal fluid cytokine contents. (C) Hierarchical stochastic neighbor embedding plot of cell lineages identified in proteomic data and heatmap of markers used. MPS cells, based on HLA-DR and CD11c or CD123, are indicated in the blue box within the Hierarchical Stochastic Neighbor Embedding plot. (D) Volcano plot of statistical test results on the frequency of clusters identified in C. (E) Boxplots of cluster frequencies for clusters showing significant differences. (F) Subclustering data from C to identification and quantification of allergy-associated Th2A (CD3+ CD8 CD45RO CD27 CD161+ CRTH2+) and ILC2 (CD7+(CD3) CD25+ CD127+ CD161+ CRTH2+). */#P < 0.05, **/##P < 0.01, ***P < 0.001, and ####P < 0.0001 between before/after (*) and between non-allergic vs. AR patients (#), as determined by Wilcoxon matched-pairs signed rank tests, or Mann-Whitney test where applicable (B and F) or by generalized linear mixed model (GLMM) with FDR correction (D and E). (B) 15 samples obtained from 12 non-allergic controls and 36 samples from 21 AR patients. (D–F) Data obtained from 14 non-allergic controls and 14 AR patients analyzed freshly (also see Table S10).
Figure S1.
Figure S1.
Cytosplore clustering of proteomic data cells. (A) Automated clustering was performed by hierarchical stochastic neighbor embedding using Cytosplore software. Cell clusters were identified based on known markers of major immune cell lineages. (B) Clustering by study group/timepoint. (C) Dotplot indicating expression of signature genes for different lineages per cluster. (D) Featureplots indicating expression of signature genes on UMAP. (E and F) Expression of signature genes in subclustered monocyte populations in (E) proteomic and (F) transcriptomic data.
Figure 2.
Figure 2.
Nasal biopsy scRNA-Seq results. (A and B) (A) Annotated UMAP of scRNA-Seq data with (B) top two genes per cluster. (C) Heatmap of DEGs between the different MPS clusters. (D) Heatmap of average expression for each MPS cluster (identity listed below) of signature genes (listed on the right) of known cell types (left). (E) Volcano plot of cluster frequencies between different study groups as determined by GLMM with FDR correction on samples obtained from 18 non-allergic controls and 21 AR patients analyzed in five runs (also see Fig. S5 A; and Tables S7, S8, and S9).
Figure S2.
Figure S2.
GO terms corresponding with CD14+ monocyte and cDC2 subcluster gene expression. (A and B) Dot plot of GO terms of biological processes (GO:BP) (A) and Reactome/Corum (B) generated with the top 40 (as sorted by absolute log2 fold change) significantly DEGs (adjusted P value <0.05) between CD14+ monocyte subclusters in g:Profiler, and simplified with Revigo (GO:BP only). (C and D) Dot plot of GO:BP terms (C) and Reactome/Corum (D) for cDC2 subclusters. Color of dots represent the negative Log10 of the adjusted P value and the size represents the gene ratio, equaling the number of DEGs against the number of genes associated with the GO term.
Figure 3.
Figure 3.
Subclustering monocyte populations. (A) Box plot of frequency of CD14+ monocytes (cluster T4) in allergic (orange boxes) and non-allergic individuals (green boxes) before and after allergen challenge in the transcriptomic data. *P < 0.05. (B) CD14+ monocytes (T4) were subclustered, revealing five subclusters. Total cell number and distinguishing marker per subcluster depicted in the plot. (C) Violin plot of HLA-DR and S100 protein expression by different CD14+ monocyte subclusters. (D) Percentage of CD14+ monocytes subclusters by study group. (E) Volcano plot of cluster frequencies between different study groups/conditions. (F) Boxplots of cluster frequencies for clusters showing significant differences. *P < 0.05 as determined by GLMM with FDR correction on samples obtained from 18 non-allergic controls and 21 AR patients analyzed in five runs (also see Fig. S5 A; and Table S7, S8, and S9).
Figure S3.
Figure S3.
QC of transcriptomic dataset. (A) Parameters used for QC of transcriptomic clusters. (B) Cluster stability analysis for different values of granularity parameter (“resolution”) used in Phenogrpah clustering. 0.5 was used for clustering in the manuscript. (C and D) Parameters used for QC of transcriptomic monocyte (C) and cDC2 (D) subclusters. (E) Contribution of each donor to each cluster shows that no donor-/condition-specific clusters exist.
Figure 4.
Figure 4.
cDC2 transcriptomic analysis. (A) Dot plot of DEGs in cDC2 cells (Cluster T5) between before and after allergen challenge for allergic (AR) and non-allergic (NA) individuals. Color intensity represents log fold change (with 0.2 cutoff). (B) Dot plot of DEGs in cDC2 cells (Cluster T5) between allergic (AR) and non-allergic (NA) individuals, before and after allergen challenge. Orange represents gene expression higher in allergic individuals, green represents gene expression higher in non-allergic individuals, and color intensity represents log-fold change. Size of the dot represents the percentage of cells in which the genes are expressed. (C) Subclustering cDC2 cluster T5 revealed seven subclusters. Total cell number and distinguishing marker per subcluster are depicted in the plot. (D) Dot plot of average expression and percentage of cells expressing marker genes of established cell types. (E) Percentage of cDC2 subclusters by study group. (F) Volcano plot of cluster frequencies between different study groups. P values were obtained by GLMM with FDR correction as determined by GLMM with FDR correction samples obtained from 18 NA controls and 21 AR patients analyzed in five runs (also see Fig. S5 A; and Tables S7, S8, and S9).
Figure S4.
Figure S4.
cDC2 annotation, correlations between CyTOF and scRNA-Seq data, and potential receptor/ligand interactions between clusters. (A) Heatmap of DEGs between cDC2 subclusters. (B) Featureplots of signature genes. (C) Top 10 genes per subcluster. (D) Correlation plots for cluster frequencies determined by CyTOF and scRNA-Seq. (E) Circle plot showing potential ligand–receptor interactions between different cell types and/or within the same cell type (in case multiple clusters of the same type were found) obtained by CellPhoneDB. Width and direction of arrows indicate the number and direction of unique interactions from/to certain cell types, respectively. (F) Heatmaps illustrating the results of the CellPhoneDB analysis between non-allergic (NA) controls and AR patients after challenge. Top heatmaps show potential interactions with a DEG for the cluster in which it is differentially expressed, indicated as the first gene on the x-axis. Bottom heatmap shows all of the clusters with which this significantly different gene can have a potential interaction (that does not need to be significantly differently expressed between groups). Colors indicate the log-fold change from non-allergic controls to AR patients, with a blue square indicating that the respective gene is only being expressed in either group. Green and red circles indicate that interaction was only predicted in either non-allergic controls or AR patients, respectively.
Figure 5.
Figure 5.
Subclustering proteomic data and integration of proteomic and transcriptomic data. (A) Subclustering of MPS (P3; monocytes and P4; DC/MP) cells in proteomic data. (B) HLA-DR and CD14 expression of subclusters P4, P7 (both CD14+ Monocyte), P5 (progenitor), P10, and P21 (both MDSC). (C) Volcano plot of cluster frequencies between different study groups/conditions. (D and E) Integration of cluster frequencies as determined from transcriptomic and proteomic data using MixOmics allowed separation of samples obtained before/after challenge for both non-allergic controls and AR patients. (F) Loadings of the first component separating non-allergic control samples before/after challenge show which cell (subclusters) allow differentiation between time points with boxplots of the respective (sub)clusters. (G) Loadings of the first component separating AR patient samples before/after the challenge show which cell (subclusters) allow differentiation between time points with boxplots of the respective (sub)clusters. P values as determined by GLMM with FDR correction on 14 non-allergic controls and 14 AR patients analyzed fresh (A–C) or on 12 non-allergic controls and 12 AR patients (D–G) analyzed in 5 runs (also see Fig. S5 A; and Tables S7, S8, S9, and S10).
Figure 6.
Figure 6.
Ex vivo stimulation of nasal biopsy MPS cells. (A) UMAP of the 21 clusters generated from CD11c+ cells after culture of nasal biopsies with or without LPS. (B) UMAP from A colored by a marker for each of the markers used for clustering as well as CD16. (C) Density plots of UMAP for non-allergic controls and allergic patients before (BC) and after challenge (AC), cultured with or without LPS show clear differences in cell abundance between groups. (D) Clusters 2 and 18 showed significant differences between non-allergic controls and allergic individuals or in the response to HDM challenge between the two groups. Lines indicate differences within groups and braces indicate a difference in response between groups as determined by linear mixed-effect model. # indicates P < 0.05 before FDR correction, * indicates P < 0.05 after FDR correction as determined by GLM. (E) Heatmap indicating the relative expression of lineage and activation markers in each cluster. Clusters showing significant differences between groups are in bold. (F) UMAP of the activation/tolerance markers and cytokines that were not used for clustering. Data represent 45 biopsies obtained from 10 non-allergic controls and 13 AR patients analyzed in three separate experiments.
Figure S5.
Figure S5.
Transcriptomic data debarcoding. (A) 15 samples were pooled for each run on the 10× chromium encapsulation chip. Samples were assigned to a batch to ensure an even distribution of each group/timepoint over the different batches. (B) Separation between cells positive and negative for each hashtag. (C) Number of hashtags identified in each cell. (D) Genotype consistency between samples of the same donor (TRUE) or different donor (FALSE). (E) Comparison of genotype profiles. (F) Resulting cell counts per donor using hashtags (y axis), SNPs (x axis), or both (diagonal). Numbers not in the diagonal or edges indicate the number of cells identified differently by both methods.

References

    1. Alexander, A.F., Kelsey I., Forbes H., and Miller-Jensen K.. 2021. Single-cell secretion analysis reveals a dual role for IL-10 in restraining and resolving the TLR4-induced inflammatory response. Cell Rep. 36:109728. 10.1016/j.celrep.2021.109728 - DOI - PMC - PubMed
    1. Alladina, J., Smith N.P., Kooistra T., Slowikowski K., Kernin I.J., Deguine J., Keen H.L., Manakongtreecheep K., Tantivit J., Rahimi R.A., et al. . 2023. A human model of asthma exacerbation reveals transcriptional programs and cell circuits specific to allergic asthma. Sci. Immunol. 8:eabq6352. 10.1126/sciimmunol.abq6352 - DOI - PMC - PubMed
    1. Arora, M., Poe S.L., Oriss T.B., Krishnamoorthy N., Yarlagadda M., Wenzel S.E., Billiar T.R., Ray A., and Ray P.. 2010. TLR4/MyD88-induced CD11b+Gr-1 int F4/80+ non-migratory myeloid cells suppress Th2 effector function in the lung. Mucosal Immunol. 3:578–593. 10.1038/mi.2010.41 - DOI - PMC - PubMed
    1. Bagwell C.B., Inokuma M., Hunsberger B., Herbert D., Bray C., Hill B., Stelzer G., Li S., Kollipara A., Ornatsky O. and Baranov V.. 2020. Automated Data Cleanup for Mass Cytometry. Cytometry A. 97:184–198. 10.1002/cyto.a.23926 - DOI - PubMed
    1. Balan, S., Saxena M., and Bhardwaj N.. 2019. Dendritic cell subsets and locations. Int. Rev. Cell Mol. Biol. 348:1–68. 10.1016/bs.ircmb.2019.07.004 - DOI - PubMed

Publication types