. 2023 Jul 25;42(7):112768.
doi: 10.1016/j.celrep.2023.112768. Epub 2023 Jul 9.

Cyclin E/CDK2 and feedback from soluble histone protein regulate the S phase burst of histone biosynthesis

Affiliations

Cyclin E/CDK2 and feedback from soluble histone protein regulate the S phase burst of histone biosynthesis

Claire Armstrong et al. Cell Rep. .

Abstract

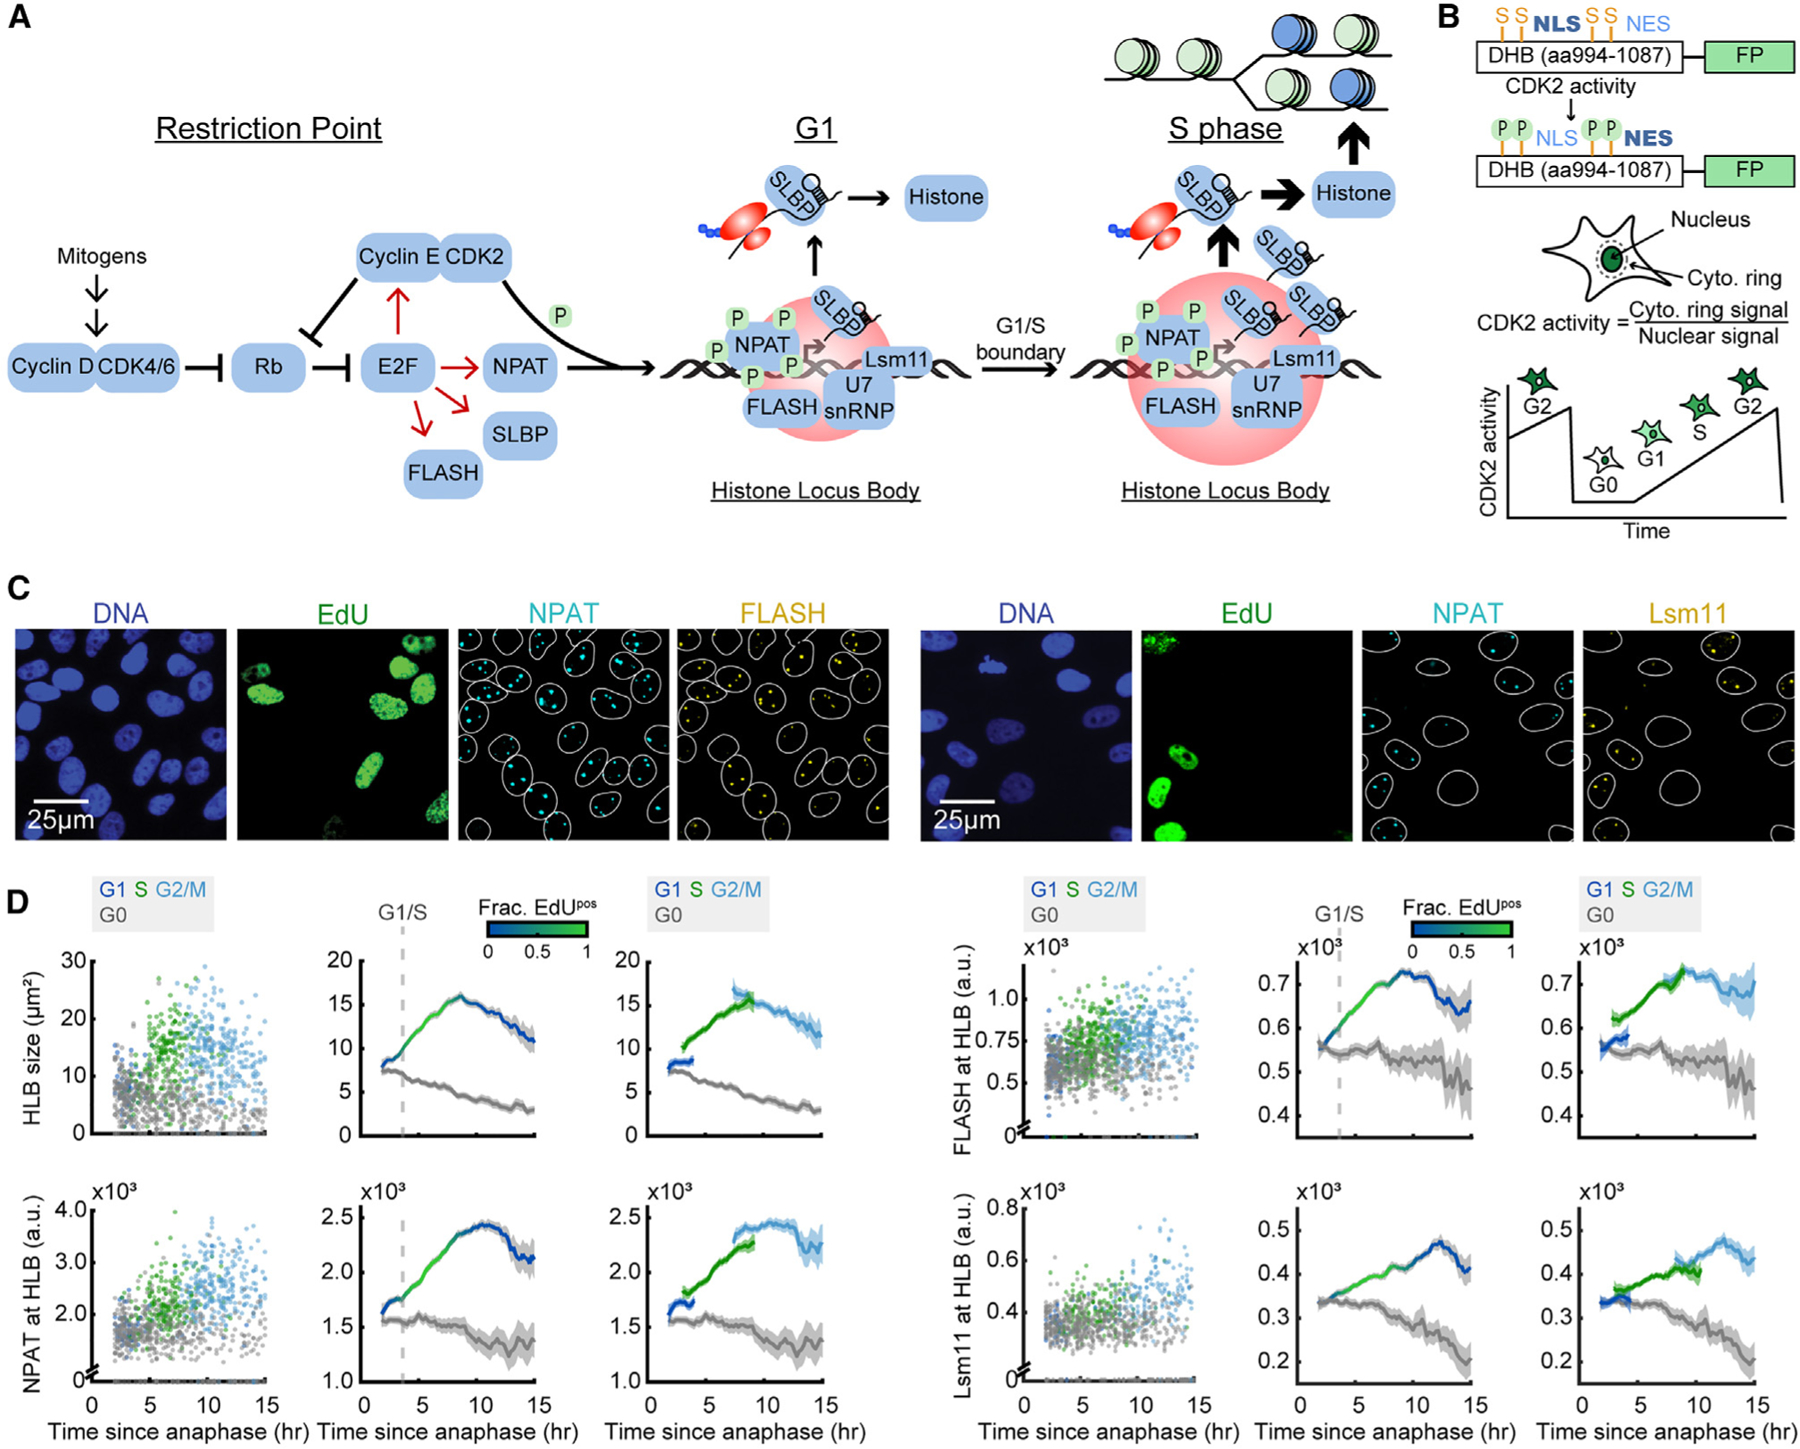
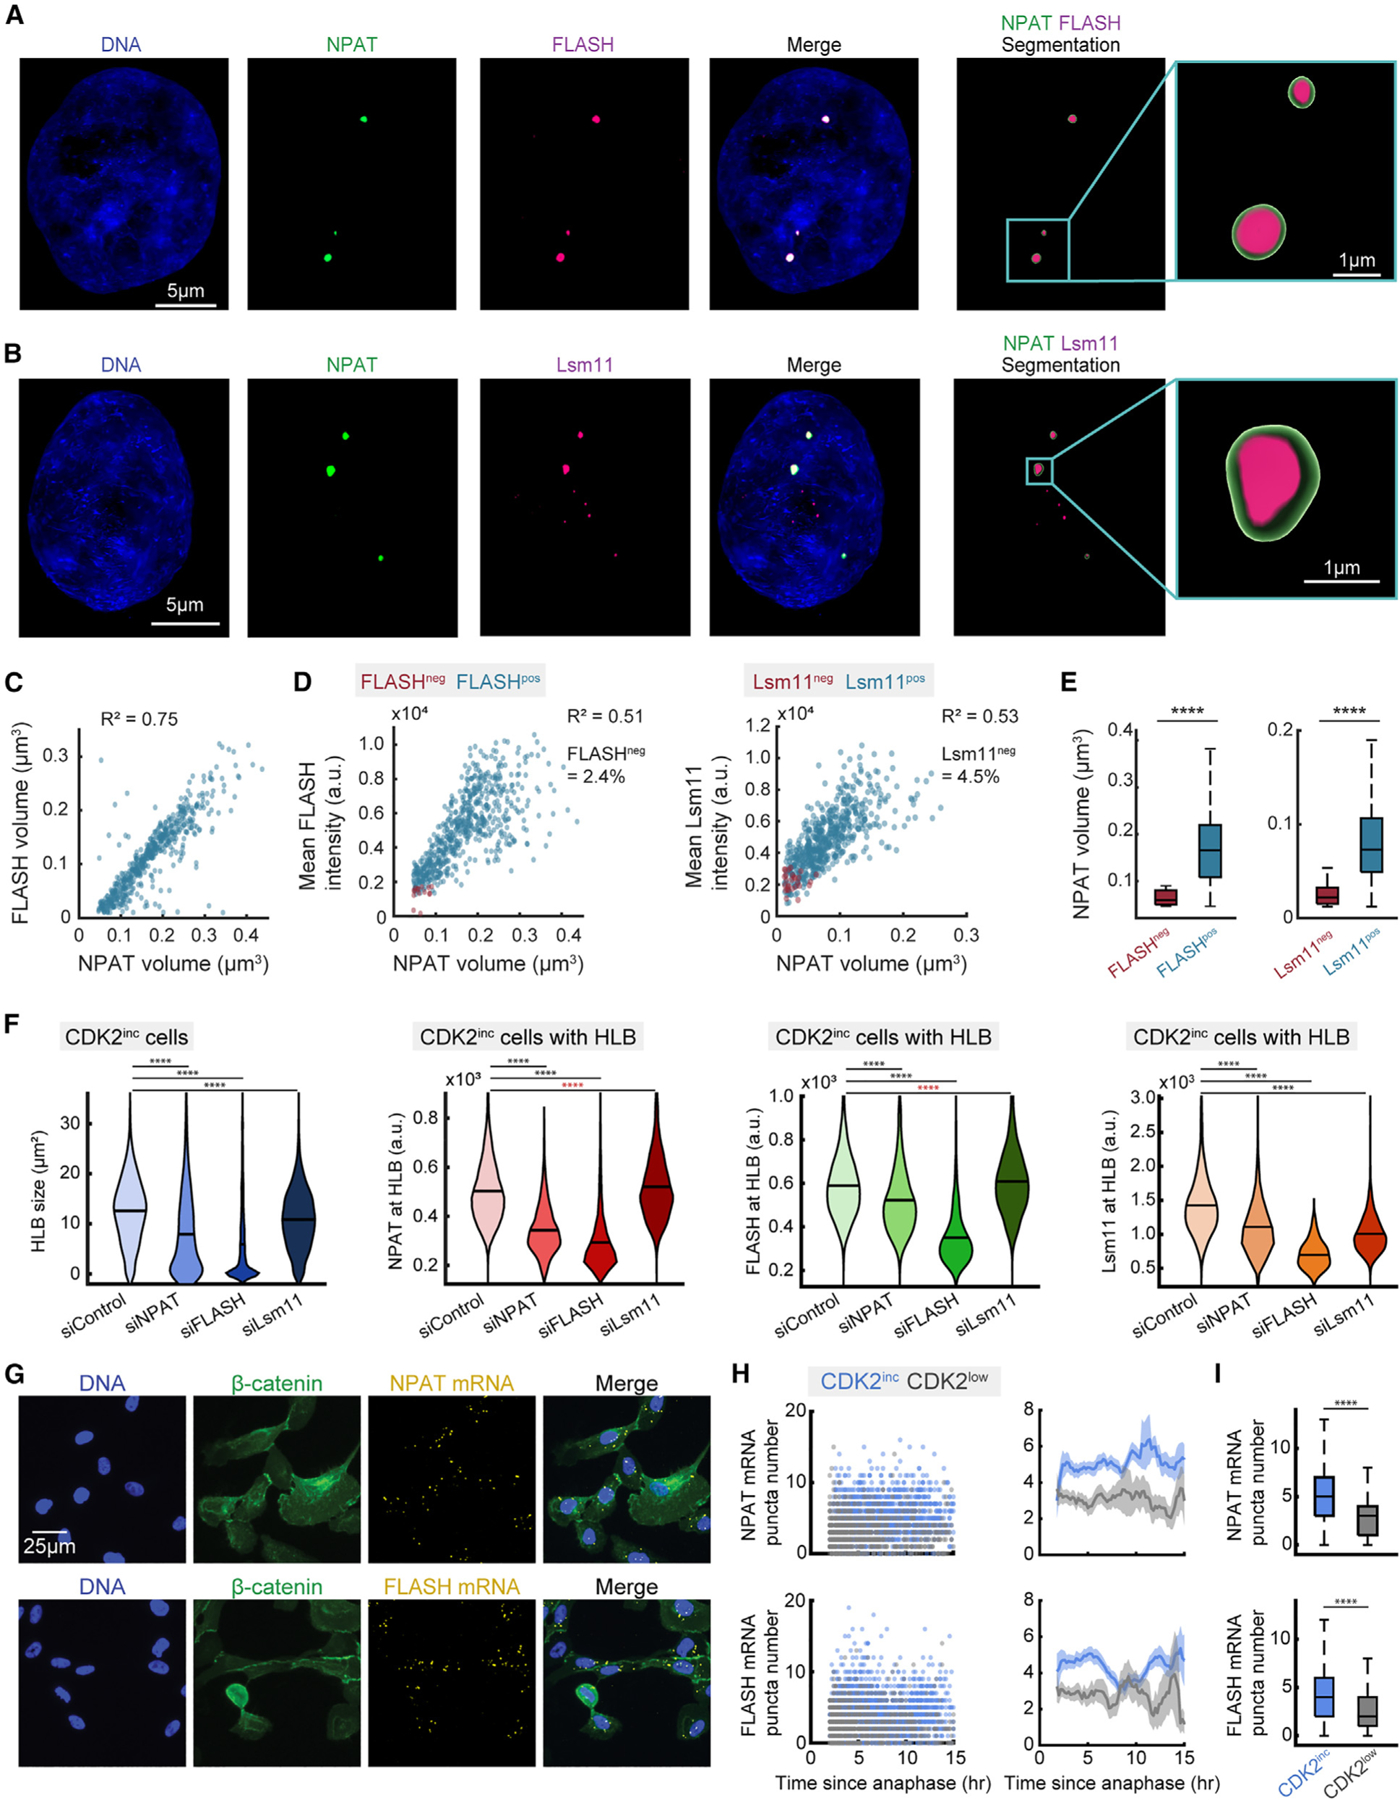
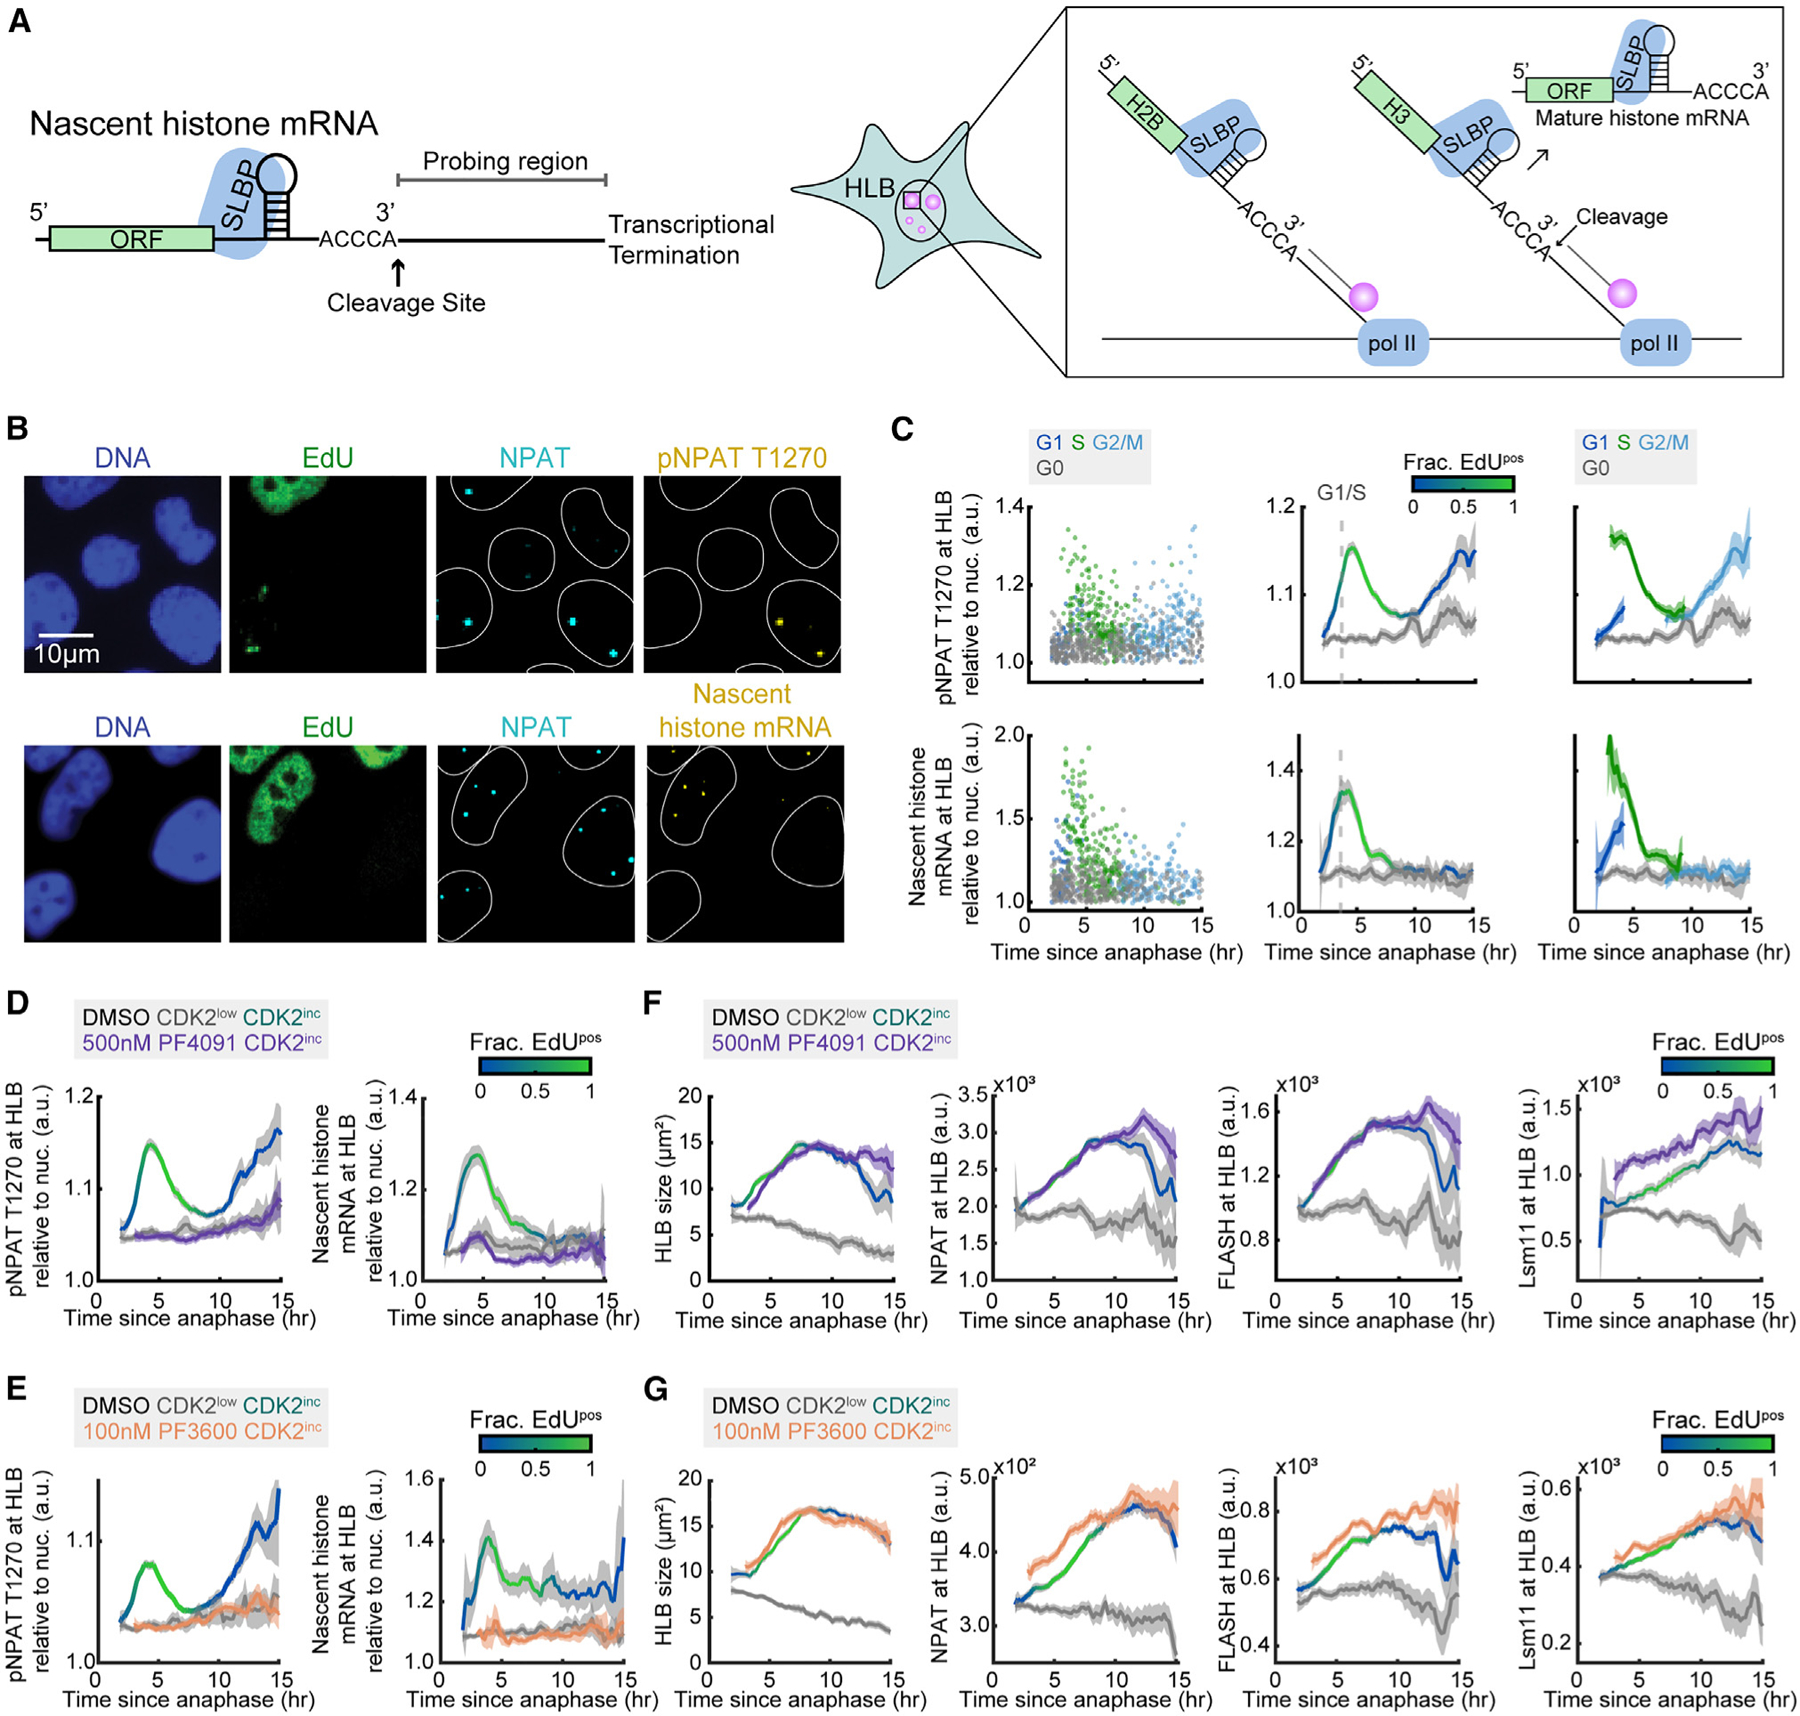
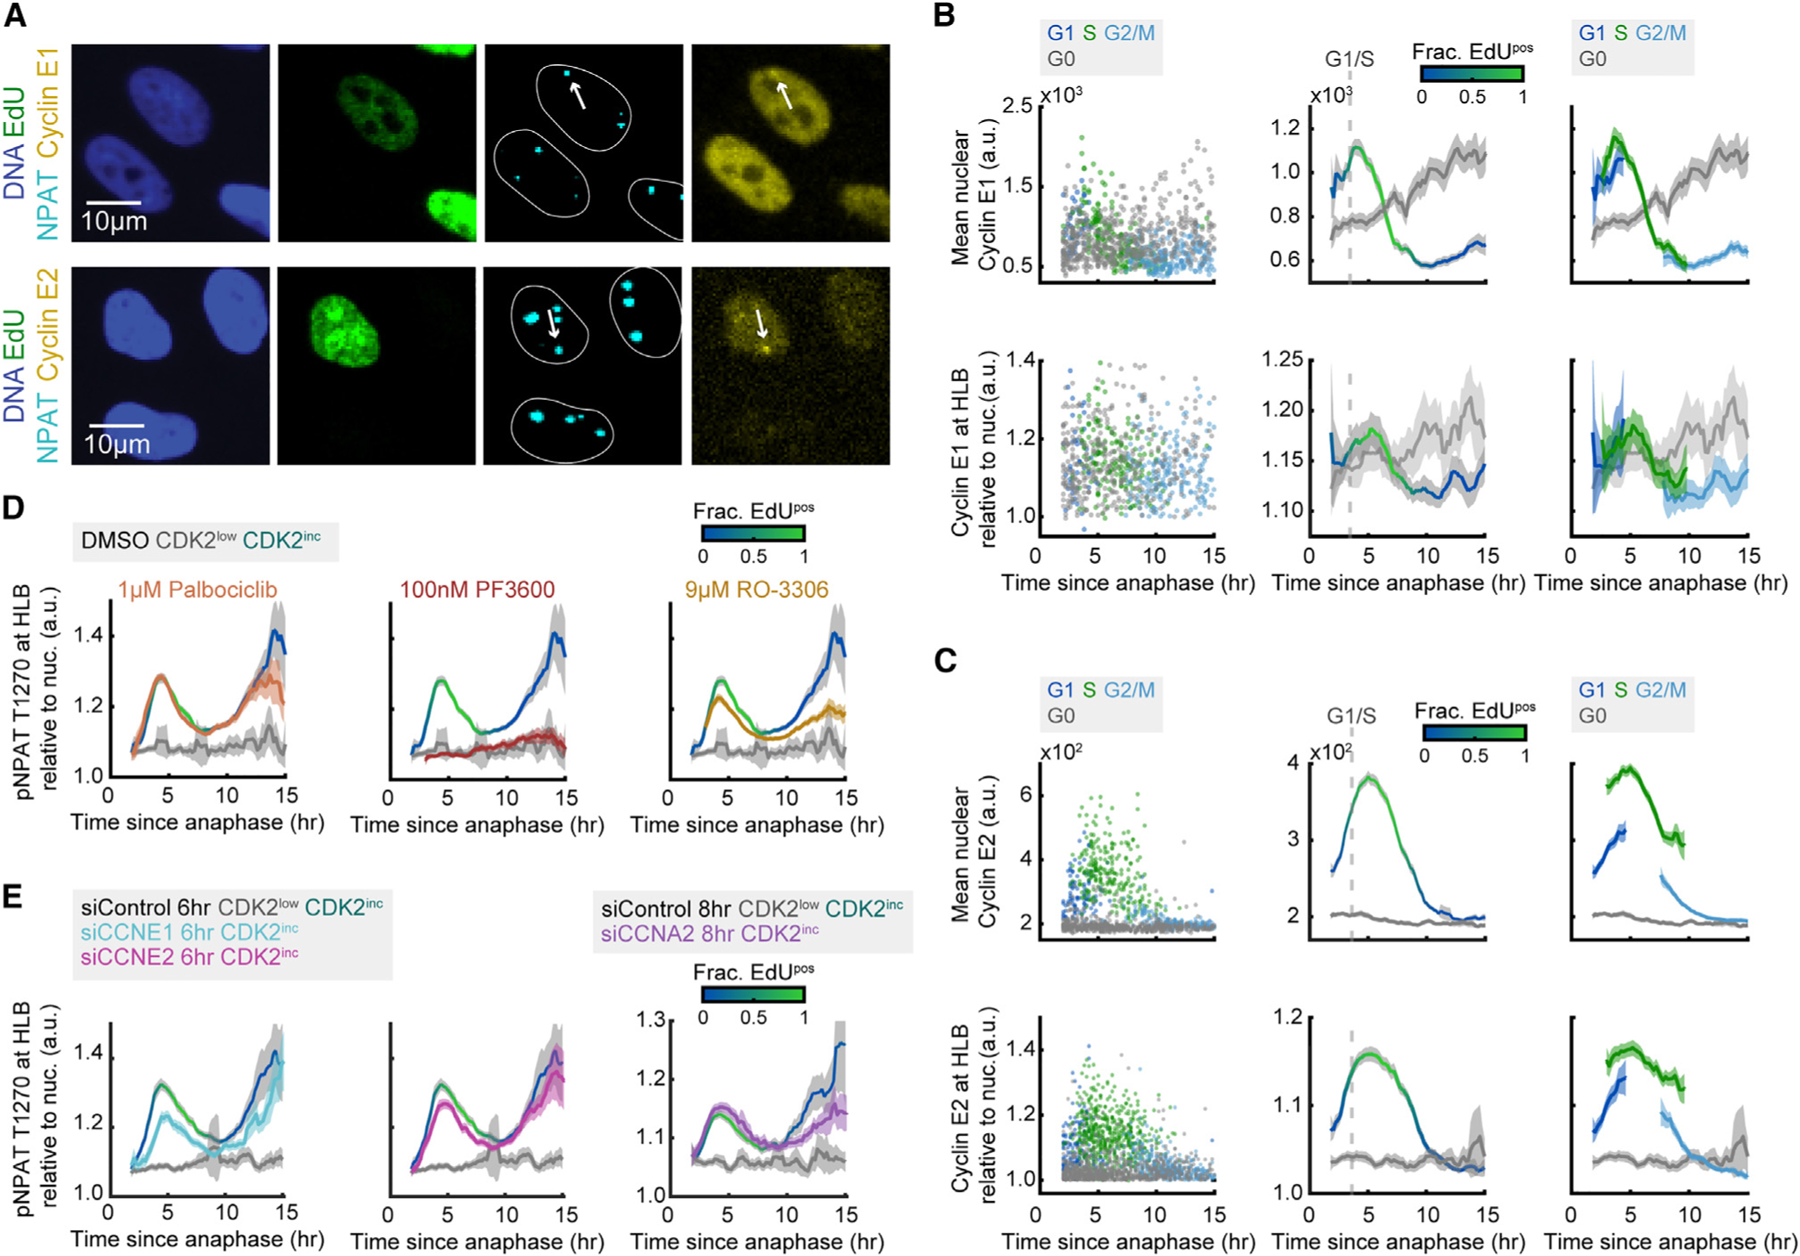
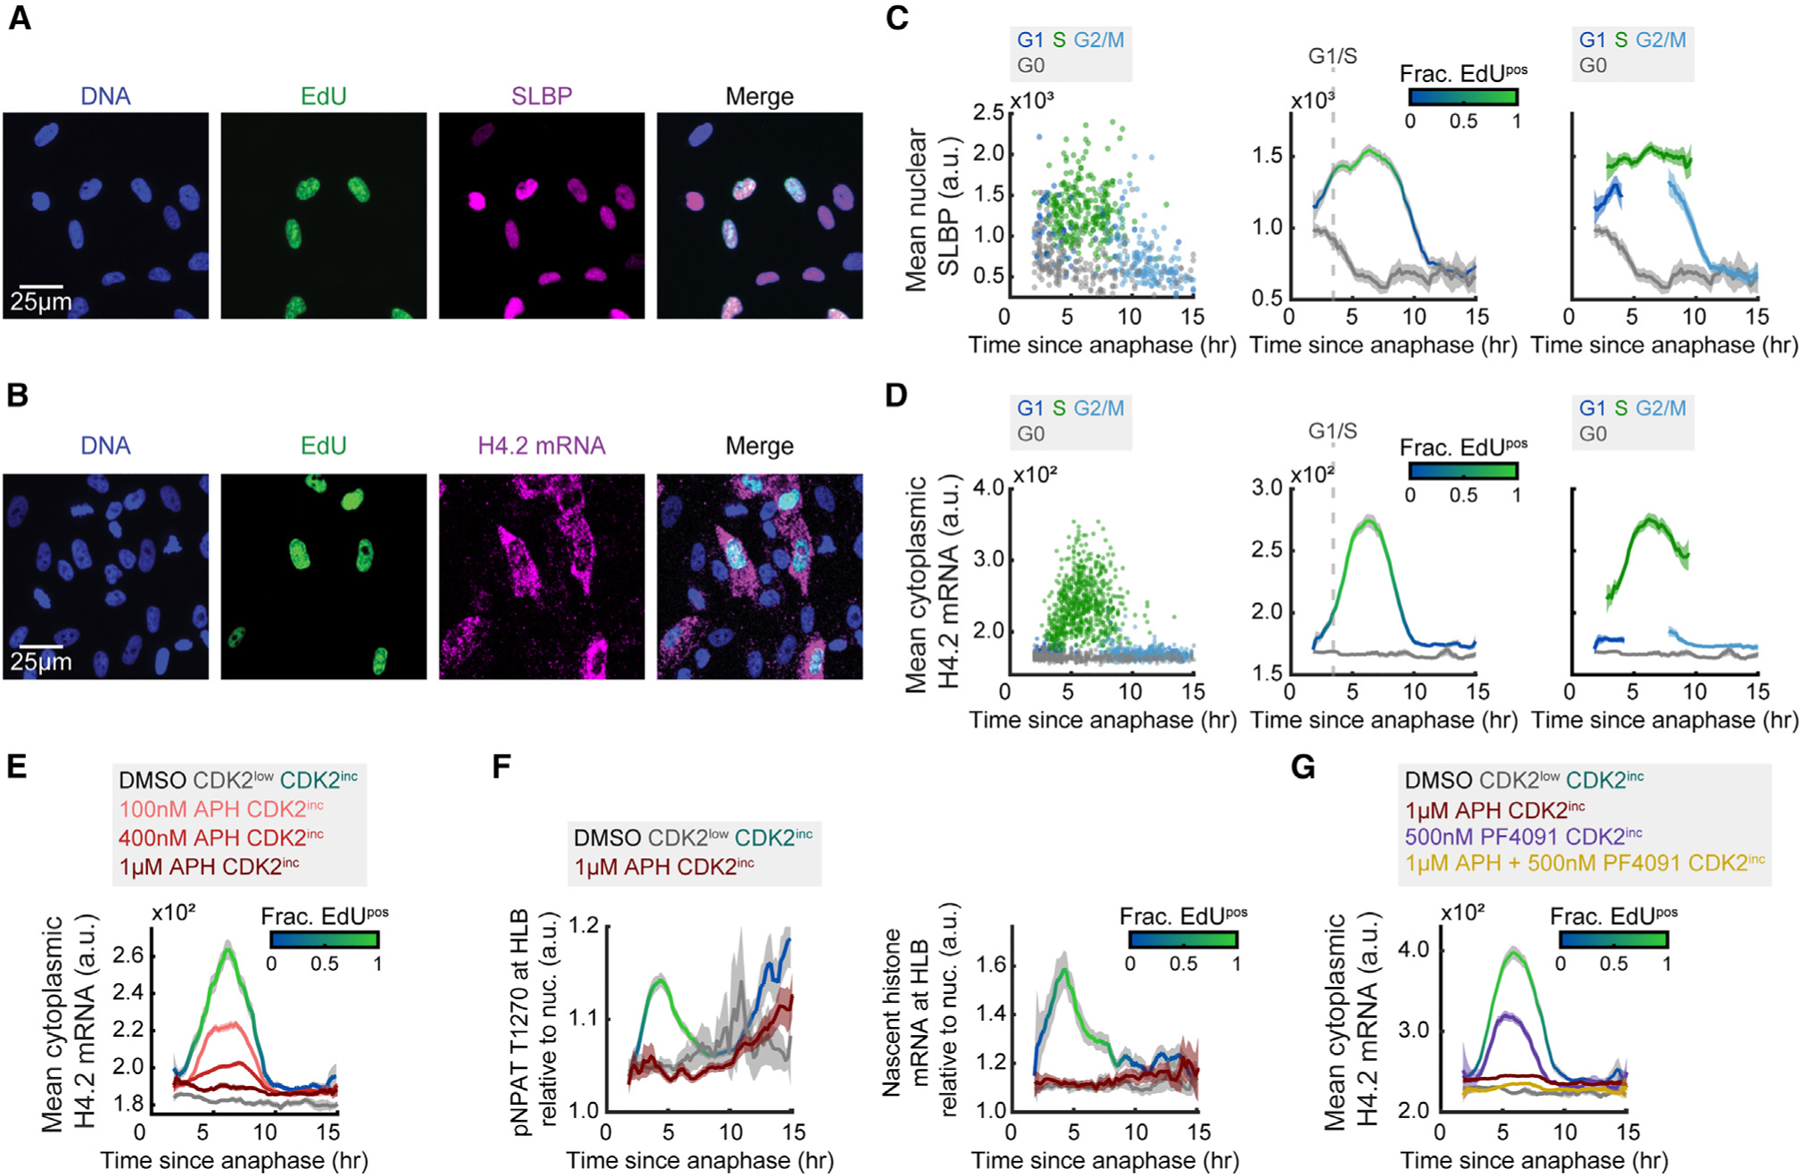
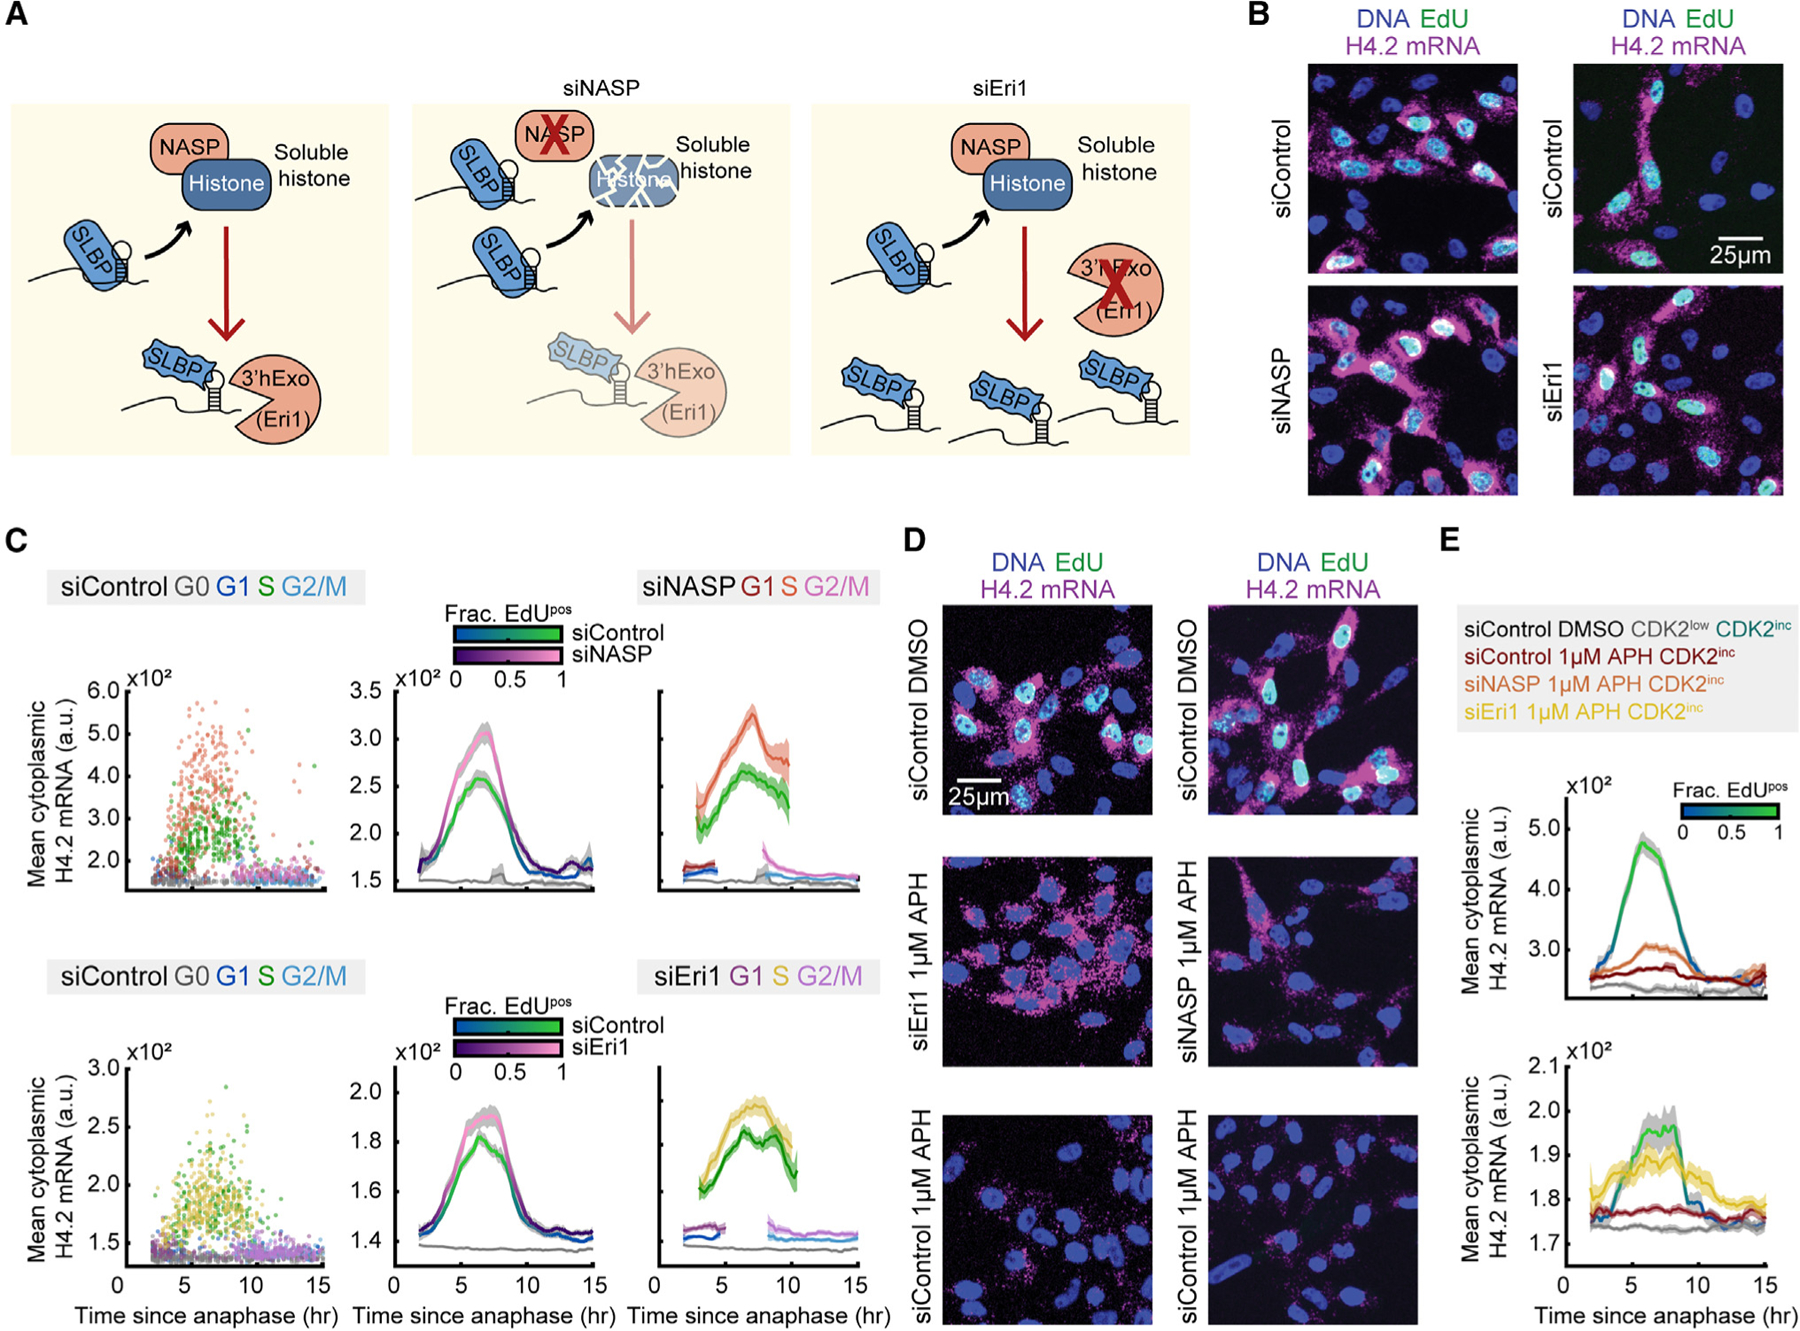
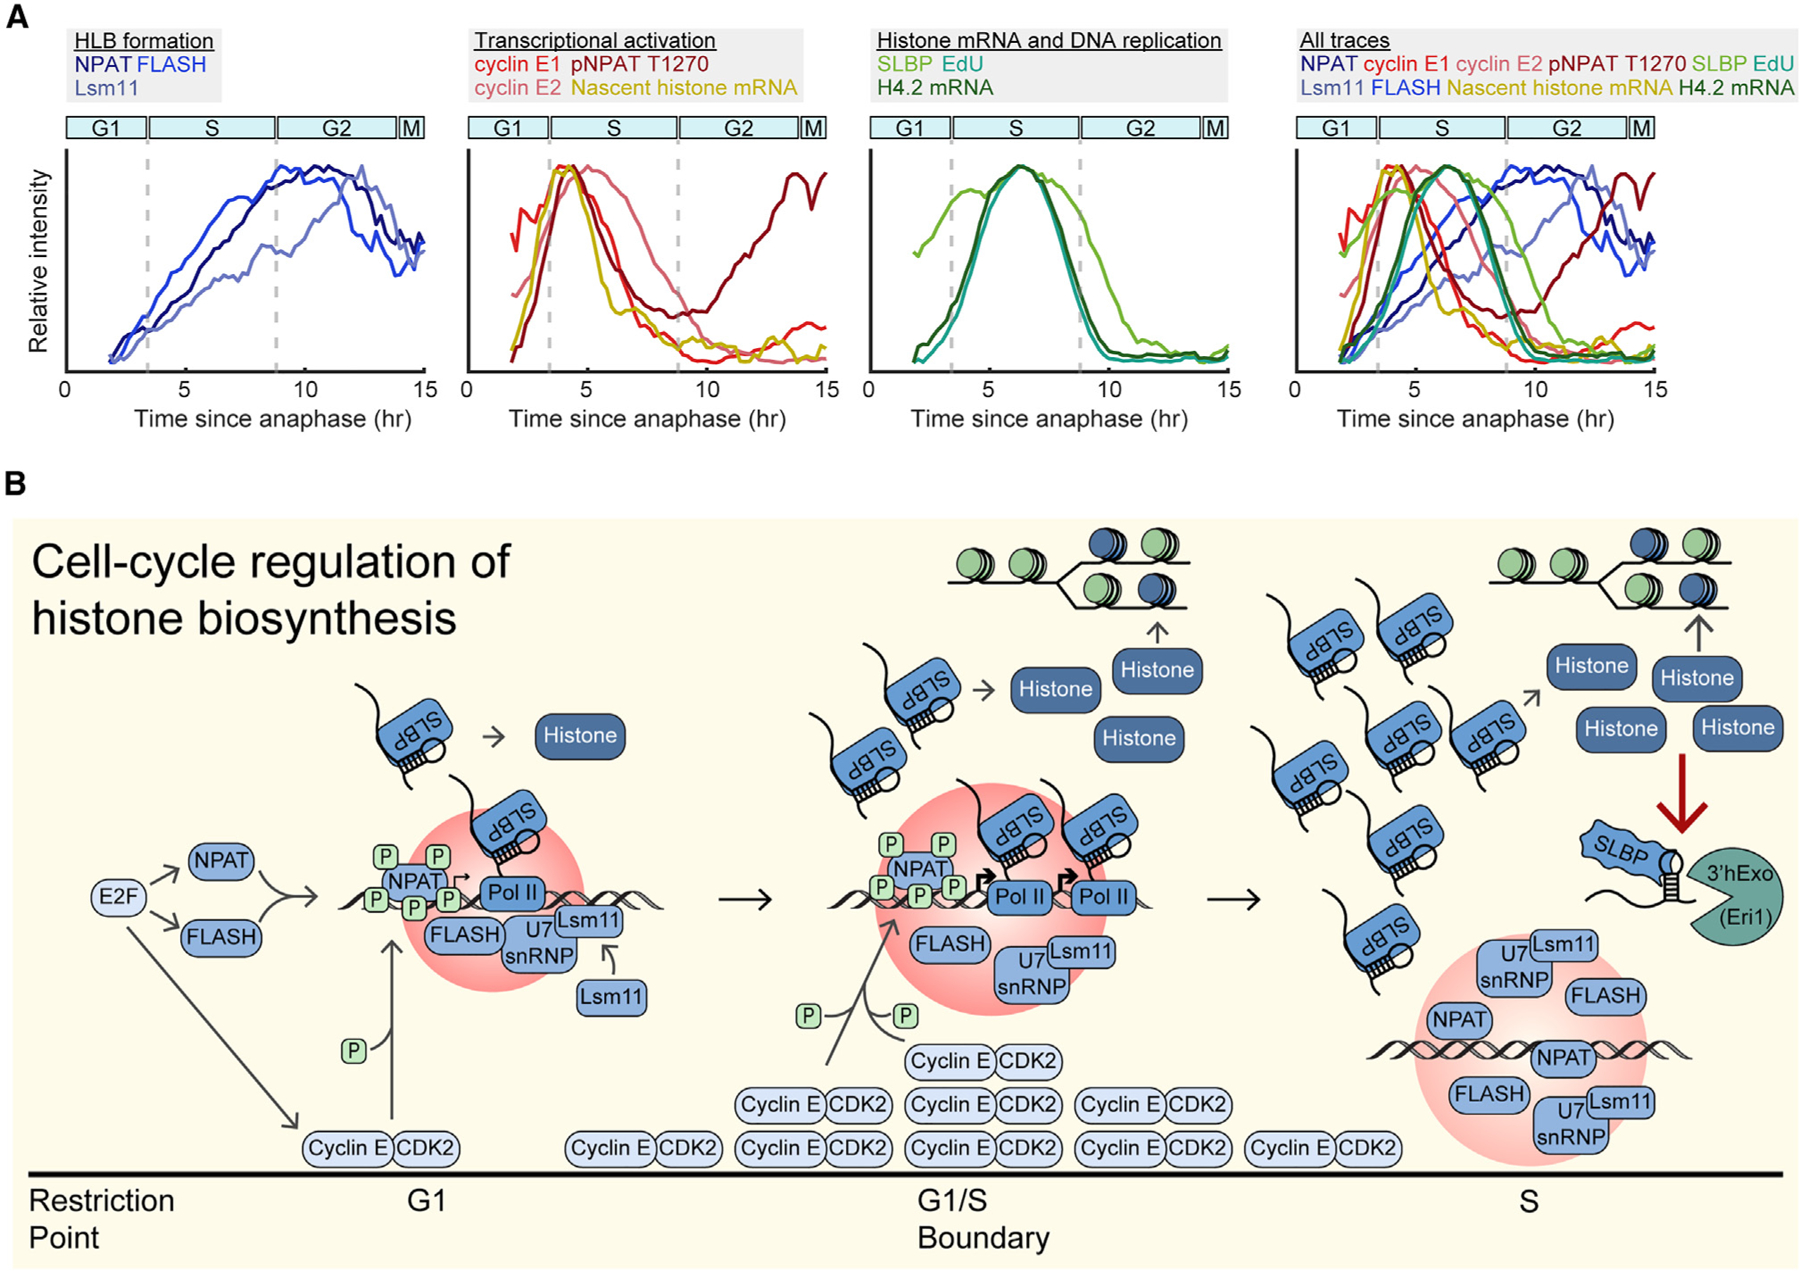
Faithful DNA replication requires that cells fine-tune their histone pool in coordination with cell-cycle progression. Replication-dependent histone biosynthesis is initiated at a low level upon cell-cycle commitment, followed by a burst at the G1/S transition, but it remains unclear how exactly the cell regulates this burst in histone biosynthesis as DNA replication begins. Here, we use single-cell time-lapse imaging to elucidate the mechanisms by which cells modulate histone production during different phases of the cell cycle. We find that CDK2-mediated phosphorylation of NPAT at the restriction point triggers histone transcription, which results in a burst of histone mRNA precisely at the G1/S phase boundary. Excess soluble histone protein further modulates histone abundance by promoting the degradation of histone mRNA for the duration of S phase. Thus, cells regulate their histone production in strict coordination with cell-cycle progression by two distinct mechanisms acting in concert.

Keywords: 3′hExo; CDK2; CP: Cell biology; CP: Molecular biology; FLASH; Lsm11; NASP; NPAT; SLBP; histone locus body; replication-dependent histone; restriction point.


Conflict of interest statement

Declaration of interests The authors declare no competing interests.

Figures

Figure 1.
Figure 1.. HLB factors are recruited in G1 and retained through the cell cycle
(A) Schematic of histone biosynthesis relative to the restriction point and cell-cycle progression. (B) Schematic of the CDK2 sensor and live-cell tracking. (C) Representative images of cells following time-lapse imaging, stained for DNA content, EdU, NPAT, and either FLASH or Lsm11. (D) Column 1: raw single-cell data by cell-cycle phase. CDK2 activity was tracked using time-lapse microscopy followed immediately by cell staining of individual cells’ immunofluorescent signal at the HLB as a function of time since anaphase. Cells are color-coded according to whether they are in G0 (CDK2low cells), G1 (CDK2inc, 2N, and EdUneg), S (CDK2inc and EdUpos), or G2/M (CDK2inc, 4N, and EdUneg) during the staining immediately following the last frame of the movie. Column 2: average of each cell’s immunofluorescence signal and 95% confidence intervals as a function of time since anaphase for CDK2inc and CDK2low populations. The G1/S transition is marked as the time when 50% of cells are EdUpos (dashed line). Column 3: CDK2inc population from column 2 segmented into G1, S, and G2/M (see also Figure S1). Information on biological and technical replicates can be found in Table S2.
Figure 2.
Figure 2.. NPAT and FLASH are required for HLB formation
(A and B) Representative images of cells stained for DNA, NPAT, and either FLASH (A) or Lsm11 (B). (C) Scatter of individual HLBs with FLASH volume vs. NPAT volume. (D) Mean protein intensity for FLASH (column 1) or Lsm11 (column 2) vs. NPAT volume of HLBs, designated as positive or negative for either FLASH or Lsm11 on the basis of the detection limit for FLASH or Lsm11 puncta. (E) Distribution of NPAT volume for populations either positive or negative for FLASH (column 1) or Lsm11 (column 2) puncta detection. (F) Violin plots of average HLB size for all CDK2inc cells (left-most plot) and mean intensity of NPAT, FLASH, or Lsm11 at HLB for CDK2inc cells with HLB following 48 h treatment with siControl, siNPAT, siFLASH, or siLsm11. (G) Representative images of cells following time-lapse imaging and staining for DNA, β-catenin for cytoplasmic segmentation, and either NPAT or FLASH mRNA. (H) Column 1: raw single-cell RNA FISH data for CDK2inc and CDK2low populations. Column 2: NPAT or FLASH mRNA FISH puncta number and 95% confidence interval as a function of time since anaphase. (I) NPAT or FLASH mRNA FISH puncta number for CDK2inc vs. CDK2low cells. p values are indicated as ****p ≤ 0.0001 from two-sample t test, with red asterisks indicating an increase in mean value. Information on biological and technical replicates can be found in Table S2.
Figure 3.
Figure 3.. Transcriptional activation of histone genes at the HLB is triggered by CDK2-mediated phosphorylation of NPAT
(A) Schematic of nascent histone mRNA FISH probe design (see Table S1). (B) Representative images following time-lapse imaging of cells stained for DNA, EdU, NPAT, and either pNPAT T1270 or nascent histone mRNA FISH. (C) Column 1: raw single-cell data by cell-cycle phase. Column 2: mean pNPAT T1270 or nascent histone mRNA at the HLB normalized to nuclear signal and 95% confidence intervals as a function of time since anaphase for CDK2inc and CDK2low populations. The G1/S transition is marked as the time when 50% of cells are EdUpos (dashed line). Column 3: CDK2inc population from column 2 segmented in to G1, S, and G2/M. (D and E) Mean pNPAT T1270 and nascent histone mRNA FISH at the HLB normalized to nuclear signal for CDK2inc and CDK2low populations for cells treated with DMSO, and CDK2inc population for cells treated with 500 nM PF-07104091 (D) or 100 nM PF-06873600 (E) for the last 1 h of live-cell imaging. (F and G) Mean HLB size and protein signal at the HLB with 95% confidence interval for NPAT, FLASH, and Lsm11 for CDK2inc and CDK2low populations for cells treated with DMSO, and CDK2inc population for cells treated with 500 nM PF-07104091 (F) or 100 nM PF-06873600 (G) for the last 1 h of live-cell imaging. Information on biological and technical replicates can be found in Table S2.
Figure 4.
Figure 4.. Phosphorylation of NPAT at the G1/S boundary is mediated by cyclin E1/CDK2
(A) Representative images following time-lapse imaging of cells stained for DNA, EdU, NPAT, and either cyclin E1 or cyclin E2. (B and C) Column 1: raw single-cell data by cell-cycle phase for nuclear cyclin E1 or E2 (top) or cyclin E1 or E2 at the HLB (bottom). Column 2: mean nuclear signal for cyclin E1 or cyclin E2 and mean HLB signal for cyclin E1 or cyclin E2 normalized to nuclear signal and 95% confidence intervals as a function of time since anaphase for CDK2inc and CDK2low populations. The G1/S transition is marked as the time when 50% of cells are EdUpos (dashed line). Column 3: CDK2inc population from column 2 segmented in to G1, S, and G2/M. (D) Mean HLB signal for pNPAT T1270 normalized to nuclear signal for CDK2inc and CDK2low populations for cells treated with DMSO, and CDK2inc population for cells treated with 1 μM palbociclib (CDK4/6i), 100 nM PF-06873600 (CDK2i), or 9 μM RO-3306 (CDK1i) for the last 1 h of live-cell imaging. (E) Mean HLB signal for pNPAT T1270 normalized to nuclear signal for CDK2inc and CDK2low populations for cells treated with siControl, siCCNE1, or siCCNE2 for 6 h (left and middle), or cells treated with siControl or siCCNA2 for 8 h (right). Information on biological and technical replicates can be found in Table S2.
Figure 5.
Figure 5.. Histone mRNA degrades rapidly and proportionally upon inhibition of DNA synthesis
(A and B) Representative images following time-lapse imaging of cells stained for DNA, EdU, and SLBP (A) or H4.2 mRNA (B). (C and D) Column 1: raw single-cell data by cell-cycle phase. Column 2: mean nuclear SLBP signal (C) or cytoplasmic histone H4.2 mRNA (D) and 95% confidence intervals as a function of time since anaphase for CDK2inc and CDK2low populations. The G1/S transition is marked as the time when 50% of cells are EdUpos (dashed line). Column 3: CDK2inc population from column 2 segmented in to G1, S, and G2/M. (E) Mean cytoplasmic histone H4.2 mRNA signal for CDK2inc and CDK2low populations for cells treated with DMSO, and CDK2inc population for cells treated with 100 nM, 400 nM, or 1 μM APH for the last 1 h of live-cell imaging. (F) Mean HLB signal for pNPAT T1270 and nascent histone mRNA FISH normalized to nuclear signal for CDK2inc and CDK2low populations for cells treated with DMSO, and CDK2inc population for cells treated with 1 μM APH for the last 1 h of live-cell imaging. (G) Mean cytoplasmic histone H4.2 mRNA signal and 95% confidence interval for CDK2inc and CDK2low populations for cells treated with DMSO, and CDK2inc population for cells treated with 1 μM APH, 500 nM PF-07104091 (PF4091), or a combination of 1 μM APH and 500 nM PF-07104091 (PF4091) for the last 1 h of live-cell imaging. Information on biological and technical replicates can be found in Table S2.
Figure 6.
Figure 6.. Soluble histone protein promotes the degradation of histone mRNA in S phase
(A) Schematic of histone protein and histone mRNA stabilization with siRNA knockdown of NASP and Eri1. Soluble histone protein disrupts the interaction between SLBP and histone mRNA (squiggly SLBP), and Eri1 (3′hExo) is required for histone mRNA degradation. (B) Representative images of cells treated with 20 nM siControl or siNASP for 24 h before fixation, or cells treated with 25 nM siControl or siEri1 for 48 h before fixation. (C) Column 1: raw single-cell data. Column 2: mean cytoplasmic histone H4.2 mRNA signal and 95% confidence intervals as a function of time since anaphase for CDK2inc and CDK2low populations for cells treated with siControl vs. siNASP or siControl vs. siEri1. Column 3: CDK2inc population from column 2 segmented in to G1, S, and G2/M populations. (D) Representative images of cells treated with 20 nM siControl for 24 h with 1 h of DMSO, 20 nM siControl for 24 h with 1 h of 1 μM APH, or 20 nM siNASP for 24 h with 1 h of 1 μM APH before fixation; and cells treated with 25 nM siControl for 48 h with 1 h of DMSO, 25 nM siControl for 48 h with 1 h of 1 μM APH, or 25 nM siEri1 for 48 h with 1 h of 1 μM APH before fixation. (E) Mean histone H4.2 mRNA signal and 95% confidence interval for cells in (D), showing partial rescue of cytoplasmic histone H4.2 mRNA after APH treatment with siNASP or siEri1 knockdown. Information on biological and technical replicates can be found in Table S2.
Figure 7.
Figure 7.. Temporal dynamics and cell-cycle regulation of histone biosynthesis
(A) Overlay of normalized mean signals presented in this study, categorized by HLB formation, transcriptional activation, histone mRNA and DNA replication, and all traces. Cyclin E signals are mean nuclear intensity. (B) Schematic of cell-cycle regulation of histone biosynthesis relative to cell-cycle progression.

Update of

References

    1. Duronio RJ, and Marzluff WF (2017). Coordinating cell cycle-regulated histone gene expression through assembly and function of the Histone Locus Body. RNA Biol 14, 726–738. 10.1080/15476286.2016.1265198. - DOI - PMC - PubMed
    1. Armstrong C, and Spencer SL (2021). Replication-dependent histone biosynthesis is coupled to cell-cycle commitment. Proc. Natl. Acad. Sci. USA 118, e2100178118. 10.1073/pnas.2100178118. - DOI - PMC - PubMed
    1. Tatomer DC, Terzo E, Curry KP, Salzler H, Sabath I, Zapotoczny G, McKay DJ, Dominski Z, Marzluff WF, and Duronio RJ (2016). Concentrating pre-mRNA processing factors in the histone locus body facilitates efficient histone mRNA biogenesis. J. Cell Biol 213, 557–570. 10.1083/jcb.201504043. - DOI - PMC - PubMed
    1. Marzluff WF, Gongidi P, Woods KR, Jin J, and Maltais LJ (2002). The human and mouse replication-dependent histone genes. Genomics 80, 487–498. - PubMed
    1. Yang XC, Burch BD, Yan Y, Marzluff WF, and Dominski Z (2009). FLASH, a proapoptotic protein involved in activation of caspase-8, is essential for 3’ end processing of histone pre-mRNAs. Mol. Cell 36, 267–278. 10.1016/j.molcel.2009.08.016. - DOI - PMC - PubMed

Publication types

LinkOut - more resources