. 2023 Sep;601(17):3739-3764.
doi: 10.1113/JP284994. Epub 2023 Jul 10.

Long QT syndrome-associated calmodulin variants disrupt the activity of the slowly activating delayed rectifier potassium channel

Affiliations

Long QT syndrome-associated calmodulin variants disrupt the activity of the slowly activating delayed rectifier potassium channel

Liam McCormick et al. J Physiol. 2023 Sep.

Abstract

Calmodulin (CaM) is a highly conserved mediator of calcium (Ca2+ )-dependent signalling and modulates various cardiac ion channels. Genotyping has revealed several CaM mutations associated with long QT syndrome (LQTS). LQTS patients display prolonged ventricular recovery times (QT interval), increasing their risk of incurring life-threatening arrhythmic events. Loss-of-function mutations to Kv7.1 (which drives the slow delayed rectifier potassium current, IKs, a key ventricular repolarising current) are the largest contributor to congenital LQTS (>50% of cases). CaM modulates Kv7.1 to produce a Ca2+ -sensitive IKs, but little is known about the consequences of LQTS-associated CaM mutations on Kv7.1 function. Here, we present novel data characterising the biophysical and modulatory properties of three LQTS-associated CaM variants (D95V, N97I and D131H). We showed that mutations induced structural alterations in CaM and reduced affinity for Kv7.1, when compared with wild-type (WT). Using HEK293T cells expressing Kv7.1 channel subunits (KCNQ1/KCNE1) and patch-clamp electrophysiology, we demonstrated that LQTS-associated CaM variants reduced current density at systolic Ca2+ concentrations (1 μm), revealing a direct QT-prolonging modulatory effect. Our data highlight for the first time that LQTS-associated perturbations to CaM's structure impede complex formation with Kv7.1 and subsequently result in reduced IKs. This provides a novel mechanistic insight into how the perturbed structure-function relationship of CaM variants contributes to the LQTS phenotype. KEY POINTS: Calmodulin (CaM) is a ubiquitous, highly conserved calcium (Ca2+ ) sensor playing a key role in cardiac muscle contraction. Genotyping has revealed several CaM mutations associated with long QT syndrome (LQTS), a life-threatening cardiac arrhythmia syndrome. LQTS-associated CaM variants (D95V, N97I and D131H) induced structural alterations, altered binding to Kv7.1 and reduced IKs. Our data provide a novel mechanistic insight into how the perturbed structure-function relationship of CaM variants contributes to the LQTS phenotype.

Keywords: IKs; Kv7.1; LQTS; calcium; calmodulin; cardiac arrhythmia.


Conflict of interest statement

The authors declare that they have no known competing financial interests or personal relationships that could have appeared to influence the work reported in this paper.

Figures

Figure 1
Figure 1. Representation of Ca2+/CaM highlighting LQTS‐associated mutations
Left shows the location of the mutations in the crystal structure of Ca2+/CaM (PDB: 1CLL). Right illustrates their location within the C‐lobe, all of which occur within residues which directly coordinate Ca2+, as depicted by black lines. Mutants D95V and N97I are located in the third Ca2+‐binding site of CaM (EF‐hand III), whereas D131H is found in the fourth EF‐hand (EF‐hand IV).
Figure 2
Figure 2. LQTS‐associated CaM mutations decrease IKs densities and reduce voltage sensitivity at resting intracellular [Ca2+] (100 nm)
A, representative traces from HEK293T cells transiently transfected with KCNQ1, KCNE1 and CaM variants. Currents were obtained in whole‐cell voltage‐clamp configuration by holding cells at −80 mV and stepping for 4 s from −60 mV to +100 mV in 20 mV increments, followed by a repolarising step at −40 mV. B, current–voltage (I/V) relationships of IKs currents modulated by CaM. Differences between groups were determined using a two‐way ANOVA with Dunnett's multiple comparisons tests. C, activation kinetics. (Left panel) mean ± s.e.m. Channel conductance, G, normalised to peak conductance, Gmax, to give mean activation/activation curves. (Right panel) mean ± s.e.m. Half maximal activation voltages, V1/2, calculated from individual curves fitted using the Boltzmann equation. Differences between groups were determined using a one‐way ANOVA with Dunnett's multiple comparisons tests.
Figure 3
Figure 3. LQTS‐associated CaM mutations decrease IKs densities and reduce voltage sensitivity at high intracellular [Ca2+] (1 μm)
A, representative traces from HEK293T cells transiently transfected with KCNQ1, KCNE1 and CaM variants. Currents were obtained in whole‐cell voltage‐clamp configuration by holding cells at −80 mV and stepping for 4 s from −60 mV to +100 mV in 20 mV increments, followed by a repolarising step at −40 mV. B, current–voltage (I/V) relationships of IKs currents modulated by CaM. Differences between groups were determined using a two‐way ANOVA with Dunnett's multiple comparisons tests. C, activation kinetics. (Left panel) mean ± s.e.m. Channel conductance, G, normalised to peak conductance, Gmax, to give mean activation/activation curves. (Right panel) mean ± s.e.m. Half maximal activation voltages, V1/2, calculated from individual curves fitted using the Boltzmann equation. Differences between groups were determined using a one‐way ANOVA with Dunnett's multiple comparisons tests.
Figure 4
Figure 4. Optical detection of cell surface density of Kv7.1 with flow cytometry
A, schematic showing Alexa Fluor 647 labelling of cell surface BBS‐tagged ECFP‐KCNQ1, KCNE1 and CaM‐EGFP. HEK293T cells were co‐transfected with ECFP‐BBS‐KCNQ1, KCNE1 and EGFP‐labelled CaM at the C‐terminus. A bungarotoxin‐binding site (BBS) was introduced within the extracellular S1–S2 loop of KCNQ1, allowing for surface labelling using Alexa Fluor 647 conjugated to α‐bungarotoxin (BTX647). B, dot plots of surface‐labelled Kv7.1 channels in HEK293T cells expressing ECFP‐BBS‐KCNQ1, KCNE1 and CaM variants, and incubated with α‐bungarotoxin‐Alexa Fluor 647. Plots show ECFP vs. Alexa Fluor 647 fluorescence (arbitrary units). Ten thousand cells were counted for each experiment. Dots represent a live, single cell as determined after SSC‐A/FSC‐A and FSC‐H/FSC‐A gating. Vertical and horizontal lines represent threshold values set based on isochronal and untransfected cells. Top left quadrant (blue) denotes ECFP‐BBS‐KCNQ1‐expressing cells with little Alexa647 signal, indicating low channel surface density. Top right quadrant (purple) represents ECFP‐BBS‐KCNQ1‐positive cells with robust channel trafficking to the surface. Bottom quadrants indicate untransfected cells. C, analysis of flow cytometry data to determine the relative surface density for KCNQ1 in the presence of CaM variants (data has been filtered for EGFP‐positive cells). Data are expressed as means ± s.e.m. Differences between groups were determined using a one‐way ANOVA with Dunnett's multiple comparisons tests.
Figure 5
Figure 5. Arrhythmogenic mutations alter the secondary structure content of CaM
A, circular dichroism spectra of CaM proteins in either 1 mm EGTA (left panel) or 5 mm CaCl2 (right panel). Spectra were collected between 180 and 260 nm at 20°C and buffer‐subtracted. B, structural distributions predicted using the CDSSTR program (Dichroweb, reference dataset 7) in 1 mm EGTA (left panel) or 5 mm CaCl2 (right panel). Data represent averages of five replicates ± s.e.m. Differences between groups were determined using a two‐way ANOVA with Dunnett's multiple comparisons tests.
Figure 6
Figure 6. LQTS‐associated mutations induce localised changes in the 3D structure of CaM
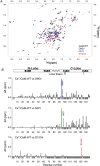
A, two dimensional 1H, 15N HSQC NMR spectra of Ca2+/CaM variants. Overlay of spectra collected from uniformly labelled 15N CaM proteins in the presence of 1 mm CaCl2. Spectra were collected at 30°C on 700/800 MHz NMR spectrometers (Bruker). B, chemical shift perturbation of Ca2+‐saturated, LQTS‐associated CaM mutants compared with CaM‐WT. B, top panel, schematic of the distribution of key structural features of CaM (N‐lobe: 1−72, linker region: 73−87, C‐lobe: 88−148). The regions containing the Ca2+‐binding EF‐hands are outlined (EF‐hand I: 21−32, EF‐hand II: 57−68, EF‐hand III: 94−105, EF‐hand IV: 130−141). B, bottom panels, chemical shift differences (15N and 1H) between the residues of Ca2+‐saturated CaM‐WT and LQTS‐associated variants in the presence of 1 mm CaCl2. Residues for which chemical shift differences could not be calculated are shown with an arbitrary value of −0.1 ppm. Chemical shift differences were expressed in ppm as Δδ = [(ΔH)2+(0.15ΔN)2]1/2.
Figure 7
Figure 7. LQTS‐associated CaM mutants show increased susceptibility to protease digestion
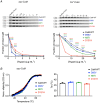
A, limited proteolysis of CaM variants in the presence of either (left) 10 mm EGTA or (right) 5 mm CaCl2. Purified CaM proteins were mixed with increasing concentrations of trypsin for 30 min at 37°C. The fraction of intact CaM was determined by SDS‐PAGE and Coomassie staining. Bands were quantified by densitometry analysis using Fiji. B, temperature induced unfolding of CaM proteins monitored via circular dichroism at 222 nm in the presence of 1 mm EGTA. B, left panel, coloured lines represent averages of triplicate data subject to the Boltzmann sigmoid equation. B, right panel, melting points (T m) of CaM proteins derived calculated from interpolating sigmoidal unfolding curves at half‐maximal response. Data were normalised and expressed as means ± s.e.m (for each CaM variant, experimental replicates are n = 4 in EGTA and n = 3 in CaCl2). Differences between groups were determined using a one‐way ANOVA with Dunnett's multiple comparisons tests.
Figure 8
Figure 8. Interaction between CaM and Kv7.1‐HA370‐389 is Ca2+‐dependent
A, B, representative isothermal titration calorimetry (ITC) titration curves (upper panel) and binding isotherms (lower panel) for the interaction between CaM and helix A of the Kv7.1 C‐terminus (Kv7.1‐HA370‐389) in the presence of (A) 1 mm EGTA or (B) 5 mm CaCl2. Data were processed using the MicroCal PEAQ‐ITC software using a one‐site binding model. The sum of the change in enthalpy (ΔH) and the change in entropy (ΔS) multiplied by the absolute temperature (T) gives the change in free energy (ΔG). Experiments were performed at 25°C. DP, differential power.
Figure 9
Figure 9. Apo‐CaM binding to Kv7.1‐HB507‐536 is decreased for LQTS‐associated variants
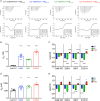
A, representative ITC titration curves (upper panel) and binding isotherms (lower panel) for the interaction between apo‐CaM and helix B of the Kv7.1 C‐terminus (Kv7.1‐HB507‐536). B, affinity and (C) thermodynamic profile of the binding of apo‐CaM to Kv7.1‐HB507‐536 obtained by fitting to a one‐site binding model. Data are means ± s.e.m. N, stoichiometry; n, number of experimental replicates. The sum of the change in enthalpy (ΔH) and the change in entropy (ΔS) multiplied by the absolute temperature (T) gives the change in free energy (ΔG). Experiments were performed at 25°C in the presence of 1 mM EGTA. DP, differential power. Differences between groups were determined using a one‐way ANOVA with Dunnett's multiple comparisons tests.
Figure 10
Figure 10. Ca2+‐CaM binding to Kv7.1‐HB507‐536 is decreased for LQTS‐associated variants
A, representative ITC titration curves (upper panel) and binding isotherms (lower panel) for the interaction between apo‐CaM and helix B of the Kv7.1 C‐terminus (Kv7.1‐HB507‐536). B, D, affinity and (C, E) thermodynamic profile of the binding of apo‐CaM to Kv7.1‐HB507‐536 obtained by fitting to a two‐site binding model. B, C, binding parameters for the first interaction and (D, E) for the second interaction. Data are means ± s.e.m. N, stoichiometry; n, number of experimental replicates. The sum of the change in enthalpy (ΔH) and the change in entropy (ΔS) multiplied by the absolute temperature (T) gives the change in free energy (ΔG). Experiments were performed at 25°C in the presence of 5 mM CaCl2. DP, differential power. Differences between groups were determined using a one‐way ANOVA with Dunnett's multiple comparisons tests.
Figure 11
Figure 11. Arrhythmogenic mutations induce changes in the 3D structure of the CaM:Kv7.1‐HB507‐536 complex
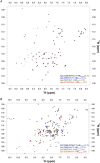
A, two dimensional 1H, 15N HSQC NMR spectra of CaM variants in complex with Kv7.1‐HB507‐536. Overlay of spectra collected from uniformly labelled 15N CaM proteins in the presence one molar equivalent of Kv7.1‐HB507‐536 and (A) 1 mm EGTA or (B) 1 mm CaCl2. Spectra were collected at 30°C on 700/800 MHz NMR spectrometers (Bruker).
Figure 12
Figure 12. Predicted effects of direct IKs inhibition by LQTS‐associated CaM variants
Simulations run in CellML using an adapted version of the O'Hara–Rudy model (O'Hara et al., 2011), see Methods. A, different values of Kb (eqn 2, see Methods) were used until the resulting block of peak IKs matched that of the experimental data for CaM‐WT, D95V, N97I and D131H variants. B, output simulated ventricular action potentials for each of these situations. The dotted line indicates the action potential 50% level (APD50) where action potential duration has been measured. C, expanded view of the simulated action potentials shown in panel B. D, plot of APD duration increase for the given reduction in IKs current density. In each of A,B, the waveforms are colour coded to the simulation condition: black is CaM‐WT, blue is D95V, green is N97I and red is D131H.

Comment in

References

    1. Adam, M. P. , Mirzaa, G. M. , Pagon, R. A. , Wallace, S. E. , Bean, L. J. H. , Gripp, K. W. , & Amemiya, A. (1993). GeneReviews. Advance online publication. https://www.ncbi.nlm.nih.gov/pubmed/20301308
    1. Ahn, J. , Kim, H. J. , Choi, J. I. , Lee, K. N. , Shim, J. , Ahn, H. S. , & Kim, Y. H. (2017). Effectiveness of beta‐blockers depending on the genotype of congenital long‐QT syndrome: A meta‐analysis. PLoS ONE, 12(10), e0185680. - PMC - PubMed
    1. Archer, C. R. , Enslow, B. T. , Taylor, A. B. , De la Rosa, V. , Bhattacharya, A. , & Shapiro, M. S. (2019). A mutually induced conformational fit underlies Ca. Journal of Biological Chemistry, 294(15), 6094–6112. - PMC - PubMed
    1. Aromolaran, A. S. , Subramanyam, P. , Chang, D. D. , Kobertz, W. R. , & Colecraft, H. M. (2014). LQT1 mutations in KCNQ1 C‐terminus assembly domain suppress IKs using different mechanisms. Cardiovascular Research, 104(3), 501–511. - PMC - PubMed
    1. Asada, K. , Kurokawa, J. , & Furukawa, T. (2009). Redox‐ and calmodulin‐dependent S‐nitrosylation of the KCNQ1 channel. Journal of Biological Chemistry, 284(9), 6014–6020. - PubMed

Publication types