. 2023 Jul 10;19(7):e1011300.
doi: 10.1371/journal.pcbi.1011300. eCollection 2023 Jul.

LRT: Integrative analysis of scRNA-seq and scTCR-seq data to investigate clonal differentiation heterogeneity

Affiliations

LRT: Integrative analysis of scRNA-seq and scTCR-seq data to investigate clonal differentiation heterogeneity

Juan Xie et al. PLoS Comput Biol. .

Abstract

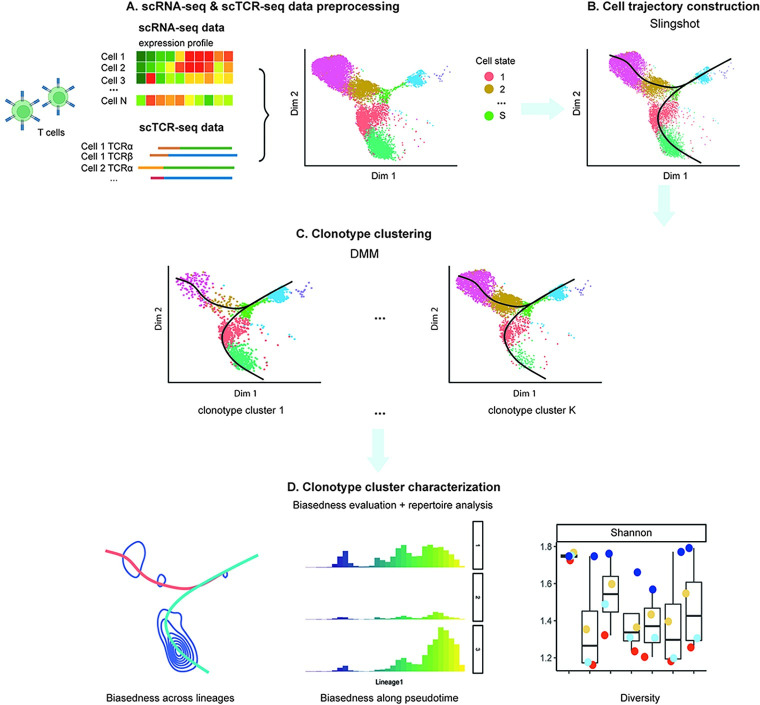
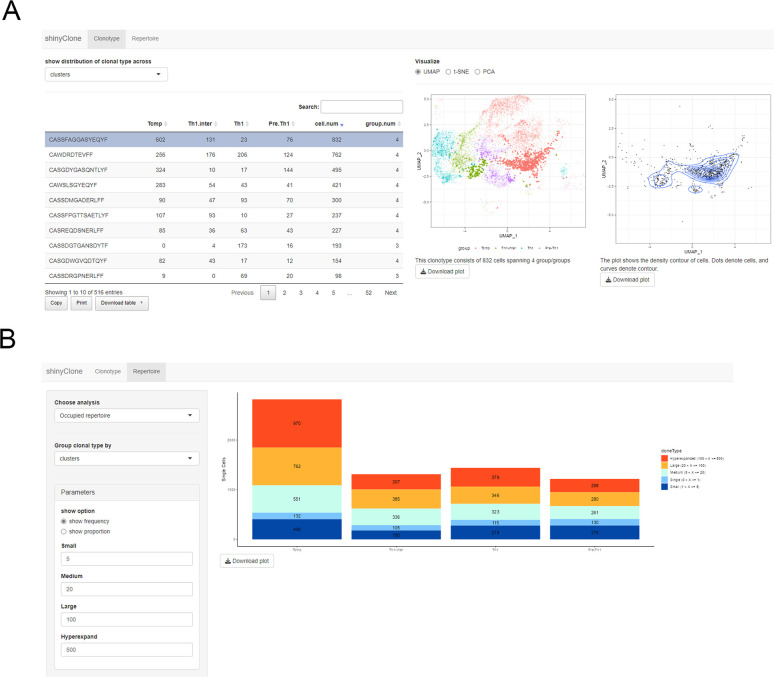
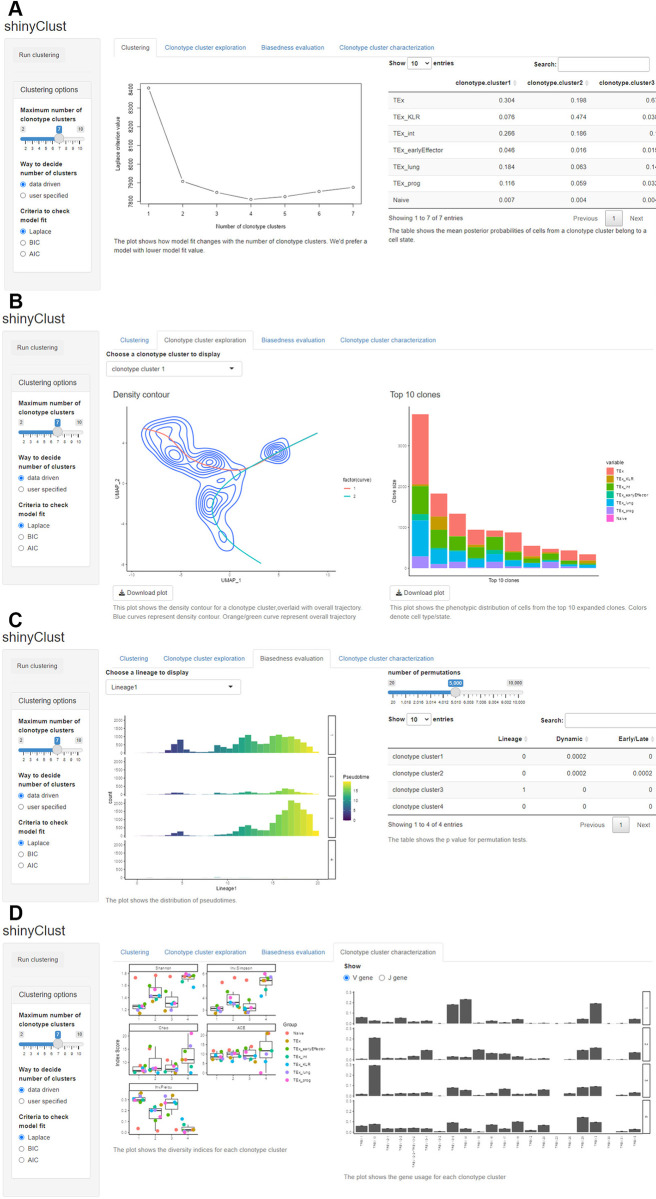
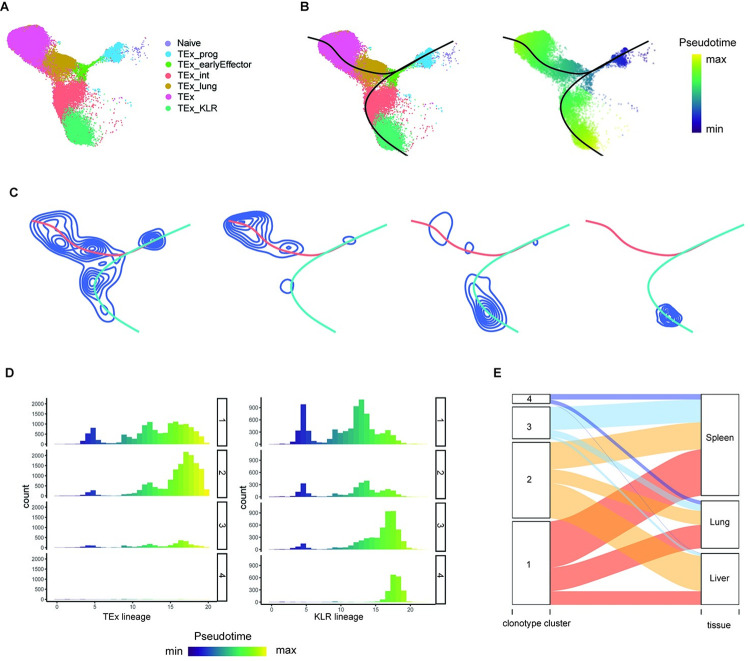
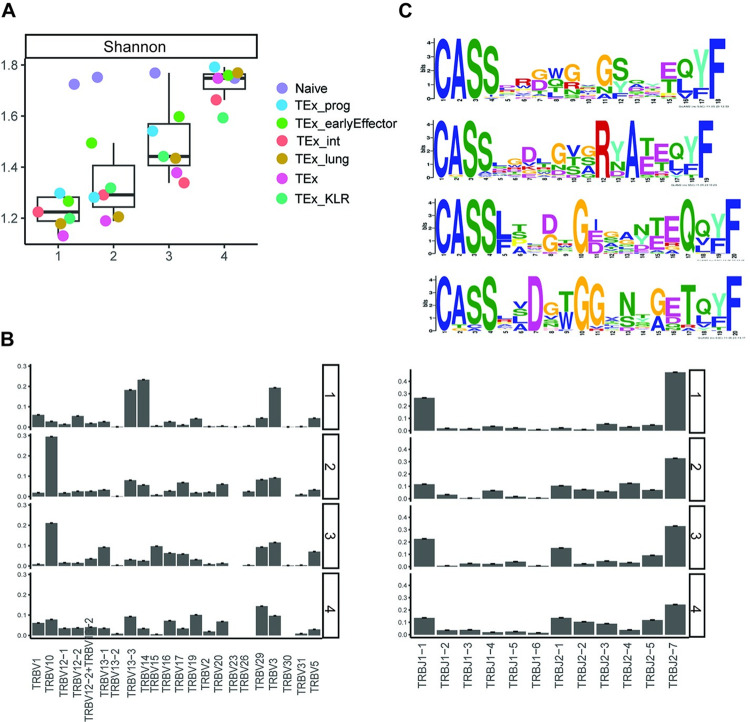
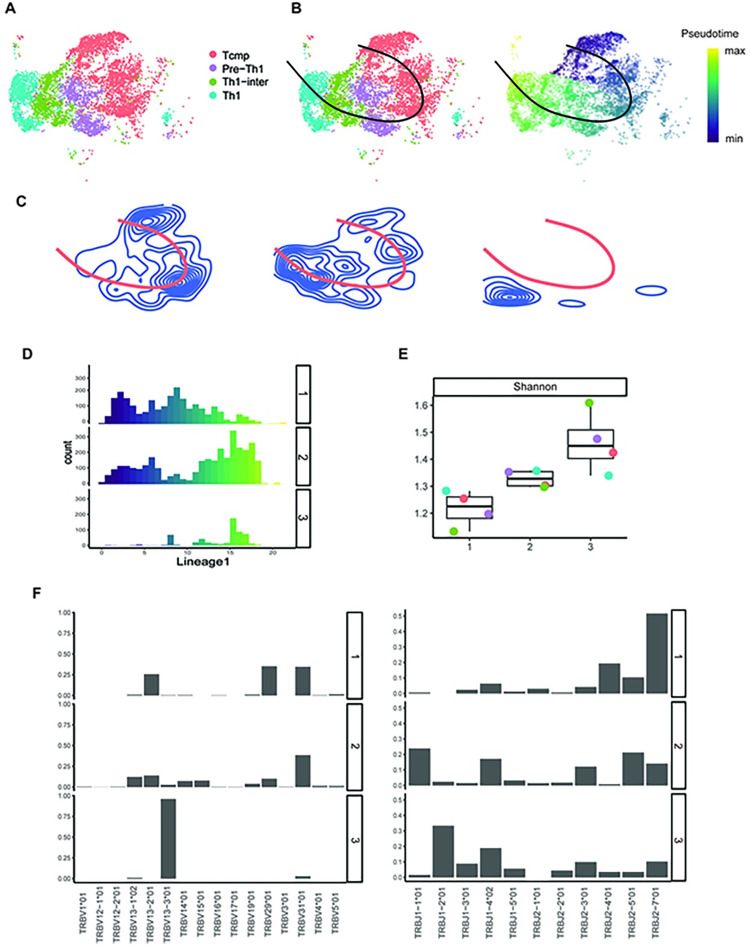
Single-cell RNA sequencing (scRNA-seq) data has been widely used for cell trajectory inference, with the assumption that cells with similar expression profiles share the same differentiation state. However, the inferred trajectory may not reveal clonal differentiation heterogeneity among T cell clones. Single-cell T cell receptor sequencing (scTCR-seq) data provides invaluable insights into the clonal relationship among cells, yet it lacks functional characteristics. Therefore, scRNA-seq and scTCR-seq data complement each other in improving trajectory inference, where a reliable computational tool is still missing. We developed LRT, a computational framework for the integrative analysis of scTCR-seq and scRNA-seq data to explore clonal differentiation trajectory heterogeneity. Specifically, LRT uses the transcriptomics information from scRNA-seq data to construct overall cell trajectories and then utilizes both the TCR sequence information and phenotype information to identify clonotype clusters with distinct differentiation biasedness. LRT provides a comprehensive analysis workflow, including preprocessing, cell trajectory inference, clonotype clustering, trajectory biasedness evaluation, and clonotype cluster characterization. We illustrated its utility using scRNA-seq and scTCR-seq data of CD8+ T cells and CD4+ T cells with acute lymphocytic choriomeningitis virus infection. These analyses identified several clonotype clusters with distinct skewed distribution along the differentiation path, which cannot be revealed solely based on scRNA-seq data. Clones from different clonotype clusters exhibited diverse expansion capability, V-J gene usage pattern and CDR3 motifs. The LRT framework was implemented as an R package 'LRT', and it is now publicly accessible at https://github.com/JuanXie19/LRT. In addition, it provides two Shiny apps 'shinyClone' and 'shinyClust' that allow users to interactively explore distributions of clonotypes, conduct repertoire analysis, implement clustering of clonotypes, trajectory biasedness evaluation, and clonotype cluster characterization.


Conflict of interest statement

The authors have declared that no competing interests exist.

Figures

Fig 1
Fig 1. The framework of LRT.
(A) The preprocessed scRNA-seq and scTCR-seq data are integrated based on cell barcodes matching. (B) Cell trajectories are first obtained using the Slingshot algorithm. (C) Clonotypes with similar cell cluster composition are grouped using the Dirichlet multinomial mixtures (DMM) model. (D) For each clonotype cluster, the distributional bias of clones along the trajectories is evaluated via permutation tests. The repertoire is characterized in terms of clonal expansion and diversity, the top-ranked clonotypes, and V and J gene usage patterns, among others.
Fig 2
Fig 2. shinyClone, a Shiny app for exploratory analysis of clonotypes.
(A) The ‘Clonotype’ tab allows users to implement various exploratory analyses of clonotype distributions. (B) The ‘Repertoire’ tab provides various TCR repertoire analysis functionalities.
Fig 3
Fig 3. shinyClust, a Shiny app for clonotype clustering and marker identification.
(A) The ‘Clustering’ tab shows the summary of clonotype clustering. (B) The ‘clonotype cluster exploration’ tab displays the density contour of cells and distribution of top-expanded clones in the selected clonotype cluster. (C) The ‘Biasedness evaluation’ tab shows the results of permutation tests to evaluate trajectory biasedness. (D) The ‘Clonotype cluster characterization’ tab shows the characteristics of the selected clonotype cluster.
Fig 4
Fig 4. LRT analysis of the CD8+ T cells from the mouse chronic LCMV infection data at D21.
(A) UMAP of the cells. Colors represent T cell subsets. (B) Trajectory analysis. Left: divergent trajectories inferred by Slingshot; Right: pseudotime of cells. (C) Density contour plots for the identified clonotype clusters overlayed with overall trajectories. Blue curves denote the cell density contour, and colored curves denote overall trajectories. (D) Histogram of pseudotime for cells in each clonotype cluster. (E) Alluvial plot showing the flows of cells in each clonotype cluster across cell state and across tissues.
Fig 5
Fig 5. LRT analysis of the CD8+ T cells from the mouse chronic LCMV infection data at D21.
(A) Boxplot showing the Shannon indices across cell states for each clonotype cluster. Dots color denotes cell state. (B) Bar plot showing TCR β chain J (left) and V gene usage (right) in each clonotype cluster. (C) TCR β CDR3 motif in each clonotype cluster.
Fig 6
Fig 6. LRT analysis of CD4+ T cells from the mouse chronic LCMV infection data.
(A) UMAP of the cells. Colors represent T cell subsets. (B) Trajectory analysis. Left: a single trajectory inferred by Slingshot; Right: pseudotime of cells. (C) Density contour plots for the identified clonotype clusters. Blue curves denote density contours, and orange curve represents the overall trajectory. (D) Histogram of pseudotime for cells in each clonotype cluster. (E) Boxplot showing the Shannon indices across cell states for each clonotype cluster. Dots color denotes cell state. (F) Bar plot showing TCR β chain J (left) and V gene usage (right) in each clonotype cluster.

Similar articles

Cited by

References

    1. Wagner DE, Klein AM. Lineage tracing meets single-cell omics: opportunities and challenges. Nature Reviews Genetics. 2020;21(7):410–27. doi: 10.1038/s41576-020-0223-2 - DOI - PMC - PubMed
    1. Trapnell C, Cacchiarelli D, Grimsby J, Pokharel P, Li S, Morse M, et al.. The dynamics and regulators of cell fate decisions are revealed by pseudotemporal ordering of single cells. Nature biotechnology. 2014;32(4):381–6. doi: 10.1038/nbt.2859 - DOI - PMC - PubMed
    1. Street K, Risso D, Fletcher RB, Das D, Ngai J, Yosef N, et al.. Slingshot: cell lineage and pseudotime inference for single-cell transcriptomics. BMC genomics. 2018;19(1):1–16. - PMC - PubMed
    1. Saelens W, Cannoodt R, Todorov H, Saeys Y. A comparison of single-cell trajectory inference methods. Nature biotechnology. 2019;37(5):547–54. doi: 10.1038/s41587-019-0071-9 - DOI - PubMed
    1. Zafar H, Lin C, Bar-Joseph Z. Single-cell lineage tracing by integrating CRISPR-Cas9 mutations with transcriptomic data. Nature communications. 2020;11(1):1–14. - PMC - PubMed

Publication types

Substances