. 2023 Jul 10;19(7):e1011286.
doi: 10.1371/journal.pcbi.1011286. eCollection 2023 Jul.

Leveraging epigenomes and three-dimensional genome organization for interpreting regulatory variation

Affiliations

Leveraging epigenomes and three-dimensional genome organization for interpreting regulatory variation

Brittany Baur et al. PLoS Comput Biol. .

Abstract

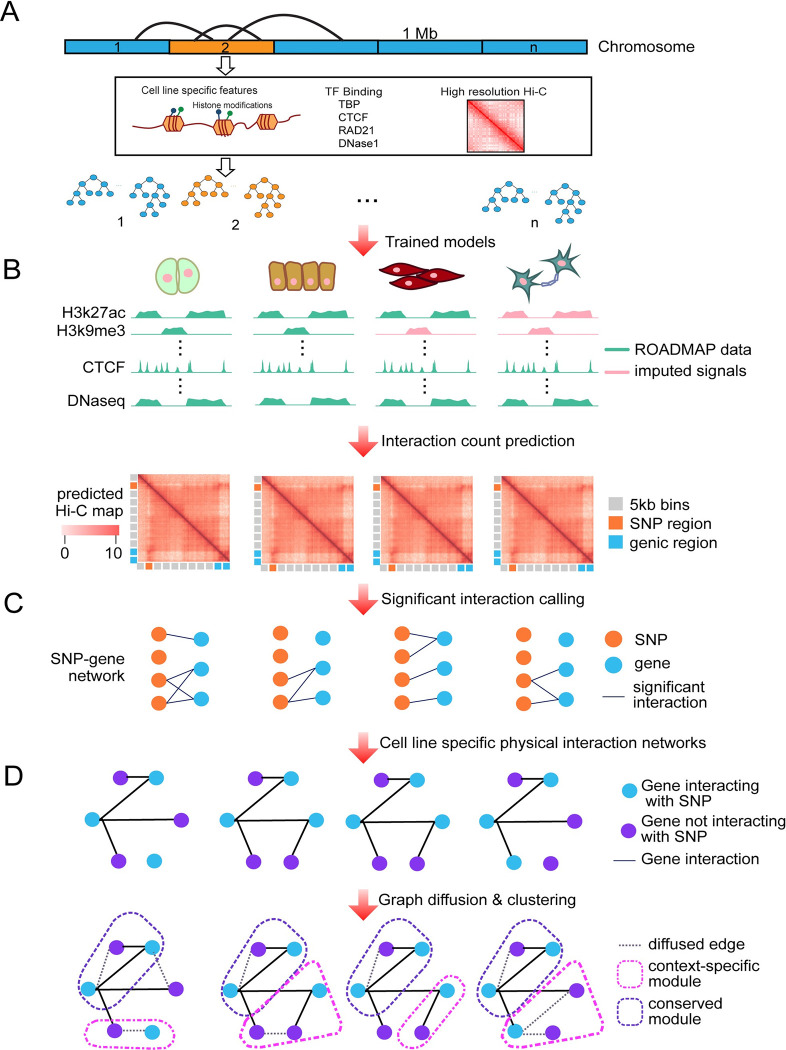
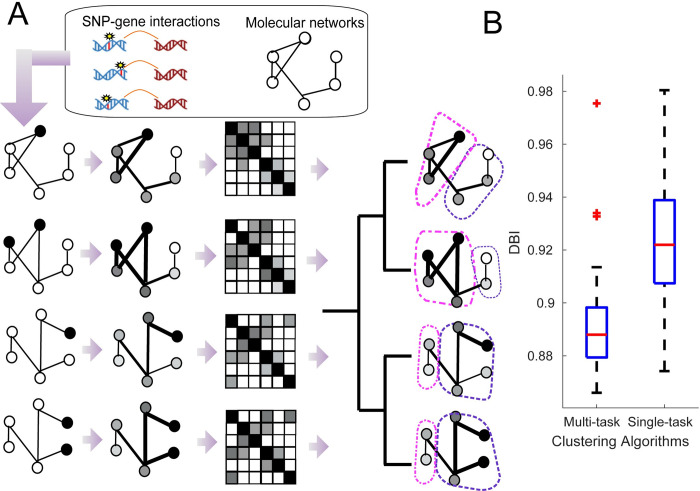
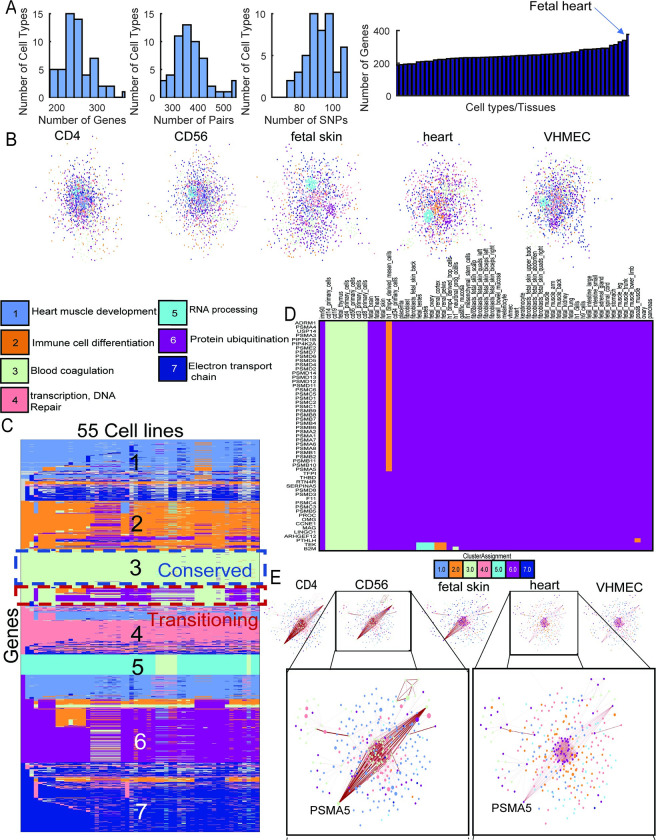
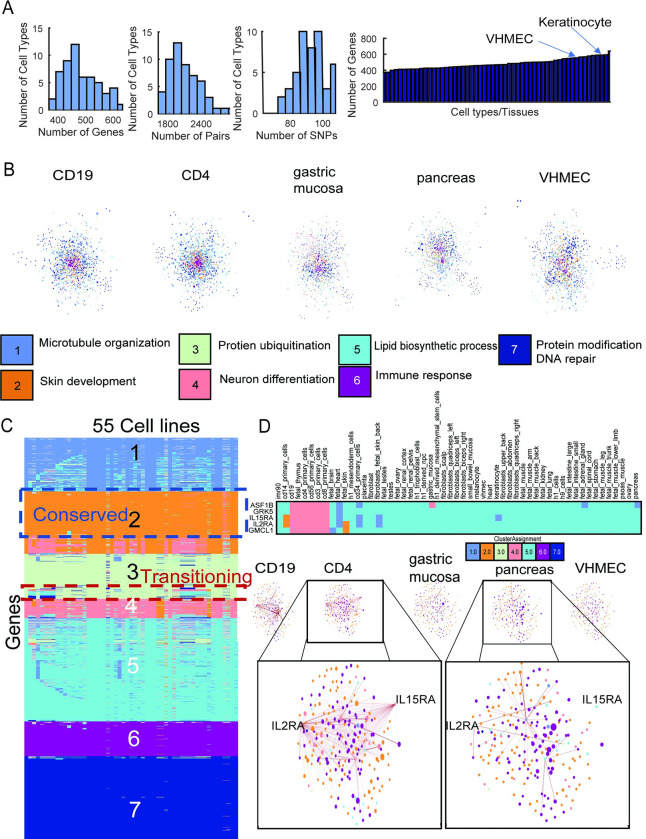
Understanding the impact of regulatory variants on complex phenotypes is a significant challenge because the genes and pathways that are targeted by such variants and the cell type context in which regulatory variants operate are typically unknown. Cell-type-specific long-range regulatory interactions that occur between a distal regulatory sequence and a gene offer a powerful framework for examining the impact of regulatory variants on complex phenotypes. However, high-resolution maps of such long-range interactions are available only for a handful of cell types. Furthermore, identifying specific gene subnetworks or pathways that are targeted by a set of variants is a significant challenge. We have developed L-HiC-Reg, a Random Forests regression method to predict high-resolution contact counts in new cell types, and a network-based framework to identify candidate cell-type-specific gene networks targeted by a set of variants from a genome-wide association study (GWAS). We applied our approach to predict interactions in 55 Roadmap Epigenomics Mapping Consortium cell types, which we used to interpret regulatory single nucleotide polymorphisms (SNPs) in the NHGRI-EBI GWAS catalogue. Using our approach, we performed an in-depth characterization of fifteen different phenotypes including schizophrenia, coronary artery disease (CAD) and Crohn's disease. We found differentially wired subnetworks consisting of known as well as novel gene targets of regulatory SNPs. Taken together, our compendium of interactions and the associated network-based analysis pipeline leverages long-range regulatory interactions to examine the context-specific impact of regulatory variation in complex phenotypes.


Conflict of interest statement

The authors have declared that no competing interests exist.

Figures

Fig 1
Fig 1. Overview of long-range interaction prediction and graph-based variant interpretation.
A. L-HiC-Reg is trained on 1 MB regions of a chromosome with one-dimensional regulatory genomic datasets and high resolution Hi-C data using a random forest regression algorithm. B. The trained models are then applied to measured and imputed datasets in the Roadmap epigenomics database to generate a compendium of predictions in 55 cell types. Generic 5kb bins are shown in gray, bins overlapping SNPs are in orange and TSS bins are in blue. C. SNPs and genes are connected in the SNP-gene network via long-range interactions with the SNPs for a given phenotype. Genes are scored based on the average significance of interactions with SNPs D. Physical molecular interactions from protein-protein interaction networks and transcription factor (TF)-gene interaction networks are used to perform graph diffusion on the scores from C. Multi-task graph clustering is used to identify gene subnetworks jointly across each cell type to identify pathways affected by the set of SNPs.
Fig 2
Fig 2. Evaluation of L-HiC-Reg predictions.
A. Performance of L-HiC-Reg for count prediction between pairs of regions is assessed with the Area Under the correlation Curve (AUC) against HiC-Reg (top) and against transfer count (bottom). Each panel is a different test cell type and the color indicates the training cell type. B. Performance of L-HiC-Reg based on identified TADs from L-HiC-Reg predictions versus HiC-Reg predictions based on Jaccard coefficient similarity of TADs from true and predicted counts. Jaccard coefficient was used to assess the overlap of TADs found on the true counts with TADs found on the predicted counts by L-HiC-Reg (y-axis) and HiC-Reg (x-axis). C. Heatmaps of exemplar regions on chromosome 17 comparing Huvec L-HiC-Reg predictions and HiC-Reg predictions (top) against measured Huvec Hi-C data (bottom). D. Assessing predictions from measured versus imputed marks. AUC for L-HiC-Reg predictions generated from experimental one-dimensional datasets (y-axis) and imputed one-dimensional datasets (x-axis) in the test cell type (top). Jaccard coefficients comparing TAD recovery from measured (y-axis) and imputed data (x-axis) (bottom).
Fig 3
Fig 3. Performance of long-range interaction prediction approaches against experimentally derived datasets.
A. Fold enrichment of JEME (cyan), GeneHancer (red) and L-HiC-Reg (purple) against gold standard ChIA-PET datasets. Blue asterisks indicate where L-HiC-Reg performed better than GeneHancer. Red asterisks indicate where L-HiC-Reg performed better than JEME. Predictions for each cell type from L-HiC-Reg and JEME were compared against each ChIA-PET dataset shown as a separate panel. GeneHancer is not cell type specific and had single set of predictions that were compared against all ChIA-PET datasets. Enrichment was calculated separately for each chromosome. The box plot shows the distribution of the enrichment values for each chromosome for a pair of predicted and ChIA-PET interactions B. Fold enrichment against capture Hi-C data. The predictions from L-HiC-Reg and JEME were compared to interactions from the capture Hi-C dataset matched by cell type. Enrichment was calculated separately for each chromosome. Colors correspond to different methods as in A. C. Comparing the fold enrichment of pairs of computational approaches GeneHancer and L-HiC-Reg, JEME and L-HiC-Reg and JEME and GeneHancer in matched cell types. D. Expression of genes (RPKM) with interactions compared to genes with no interaction in GeneHancer (red), JEME (cyan) and L-HiC-Reg (purple). L-HiC-Reg and JEME were matched for the cell type.
Fig 4
Fig 4
A. Distribution plots for all GWAS non-coding SNPs and SNPs in LD that were linked to genes across the 55 cell types (left), genes linked to SNPs (middle) and SNP-Gene pairs (right). B. Number of genes associated with SNPs (row and then column normalized to length one) across phenotypes (rows) and cell types (columns). Each entry is normalized such the rows are of length 1. Rows and columns are reordered using non-negative matrix factorization. C. Precision (left) and recall (right) of L-HiC-Reg, JEME, GeneHancer and nearest neighbor (NN) for eQTL SNP-gene associations as a function of distance (x-axis). D. Contact count and one-dimensional signals centered around the vitiligo-associated SNP rs10876864. The GDF11 gene is highlighted on the Gene of interest track. The first row of the black-white heatmap below represents the presence(black)/absence(white) of the GDF11-rs10876864 interaction. The columns are cell types and tissues. The second row indicates which cell types are skin-related and the bottom row represents which cell types are immune-related. E. Contact count and one-dimensional signals for coronary artery disease-associated SNP rs599839. The PSMA5 gene is highlighted on the Gene of interest track. The first row of the black-white heatmap below indicates the presence or absence of the PSMA5- rs599839 loop, the second row indicates which are the skin cell types and the third row indicates the immune cell types.
Fig 5
Fig 5
A. Overview of our Multi-task Graph Clustering (MTGC) method. Genes are scored based on their significant interactions with SNP-containing regions and mapped to a physical molecular interaction network. Two stage graph diffusion is performed to obtain a fully connected adjacency matrix with edge weights corresponding to the effect of SNP from one gene to another. The input into the multi-task graph clustering approach is a matrix for each cell type, the number of clusters and relationship tree for the cell types. The outputs are the matched gene clusters (dashed purple and magenta groups) corresponding to gene networks for each cell type. B. Comparison of the quality of clusters with Davies-Bouldin index for single task spectral clustering and our multi-task clustering approach (lower values are better) in the breast cancer phenotype for all cell lines and tissues.
Fig 6
Fig 6. Interpreting regulatory variants in Coronary Artery Disease (CAD).
A. Distribution of the number of genes linked to SNPs, number of pairs and number of SNPs linked to genes across tissues (left). Number of genes linked to SNPs for each cell type (right). B. Example networks with nodes (genes) colored by their clustering assignment and the major GO enrichment process for each cluster. C. Cluster assignments across the genes (rows) and cell types (columns). Rows are ordered according to cluster assignment in small bowel mucosa (first column), which is indicated in large font on the row groups. Some genes do not maintain their cluster assignment and are referred to as transitioning or differential. Conserved gene sets are those that have the same cluster assignment across all cell types. D. An example transitioning gene set. Rows are the genes and columns are the cell types with the color indicating cluster assignment (top). E. Networks of the genes in the set in D for representative cell types with (CD4, CD56) or without the interactions (heart) around PSMA5 with edge weight represented by edge thickness (bottom). The size of the node represents the node score after graph diffusion.
Fig 7
Fig 7. Interpreting regulatory variants in breast cancer.
A. Distribution of the number of genes linked to SNPs, number of pairs (blue) and SNPs linked to genes across tissues (left). Number of genes linked to SNPs for every cell type (right). B. Example networks with nodes (genes) colored by their clustering assignment and the major GO enrichment process for each cluster. C. Cluster assignments across the genes (rows) and cell types (columns). Conserved and transitioning gene sets are indicated. D. An example transitioning gene set. Rows are the genes and columns are the cell types with the color indicating cluster assignment (top). Networks of the genes in this set (triangles) and their nearest neighbor target genes (circles) with edge weight represented by edge thickness (bottom) for five representative cell types where the interaction is present (CD19, CD4) or absent (pancreas, vHMEC).

Similar articles

Cited by

References

    1. MacArthur J, Bowler E, Cerezo M, Gil L, Hall P, Hastings E, et al. The new NHGRI-EBI Catalog of published genome-wide association studies (GWAS Catalog). Nucleic Acids Res. 2017;45:D896–901. doi: 10.1093/nar/gkw1133 - DOI - PMC - PubMed
    1. Maurano MT, Humbert R, Rynes E, Thurman RE, Haugen E, Wang H, et al. Systematic Localization of Common Disease-Associated Variation in Regulatory DNA. Science. 2012;337:1190–5. doi: 10.1126/science.1222794 - DOI - PMC - PubMed
    1. Watanabe K, Stringer S, Frei O, Umićević Mirkov M, de Leeuw C, Polderman TJC, et al. A global overview of pleiotropy and genetic architecture in complex traits. Nat Genet. 2019;51:1339–48. doi: 10.1038/s41588-019-0481-0 - DOI - PubMed
    1. Boyd M, Thodberg M, Vitezic M, Bornholdt J, Vitting-Seerup K, Chen Y, et al. Characterization of the enhancer and promoter landscape of inflammatory bowel disease from human colon biopsies. Nat Commun. 2018;9:1661. doi: 10.1038/s41467-018-03766-z - DOI - PMC - PubMed
    1. Gacita AM, Fullenkamp DE, Ohiri J, Pottinger T, Puckelwartz MJ, Nobrega MA, et al. Genetic Variation in Enhancers Modifies Cardiomyopathy Gene Expression and Progression. Circulation. 2021;143:1302–16. doi: 10.1161/CIRCULATIONAHA.120.050432 - DOI - PMC - PubMed

Publication types