. 2023 Oct 24;7(20):6367-6380.
doi: 10.1182/bloodadvances.2023010817.

Complement and platelets: prothrombotic cell activation requires membrane attack complex-induced release of danger signals

Affiliations

Complement and platelets: prothrombotic cell activation requires membrane attack complex-induced release of danger signals

Marco Mannes et al. Blood Adv. .

Abstract

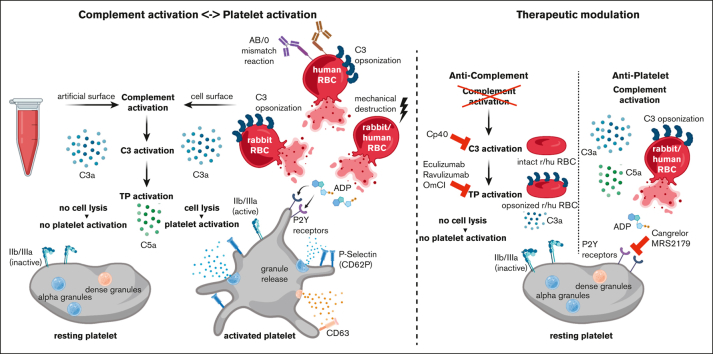
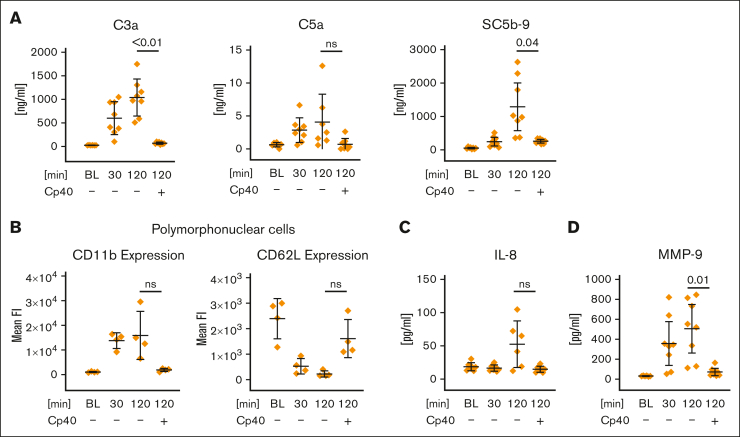
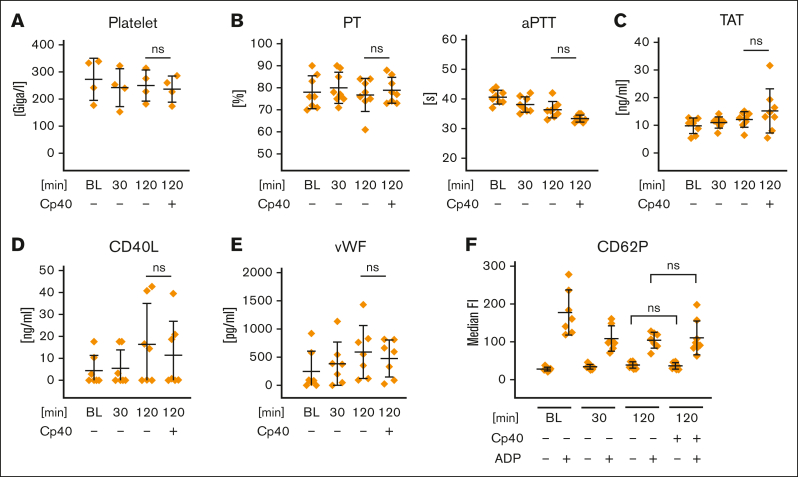
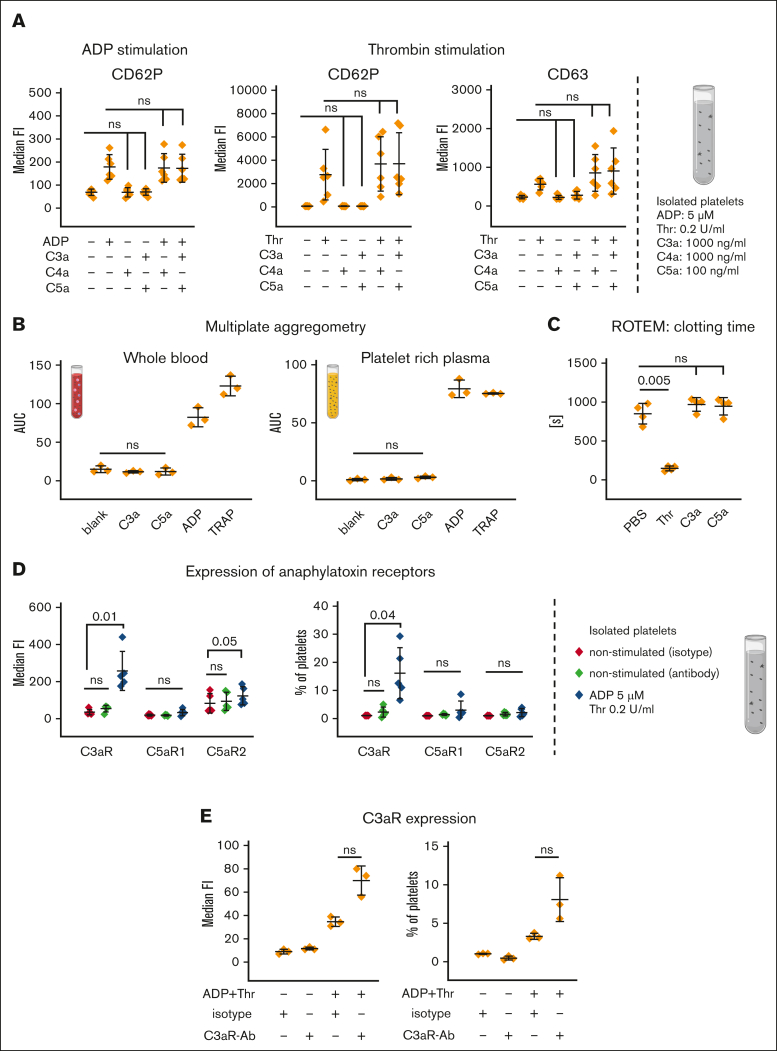
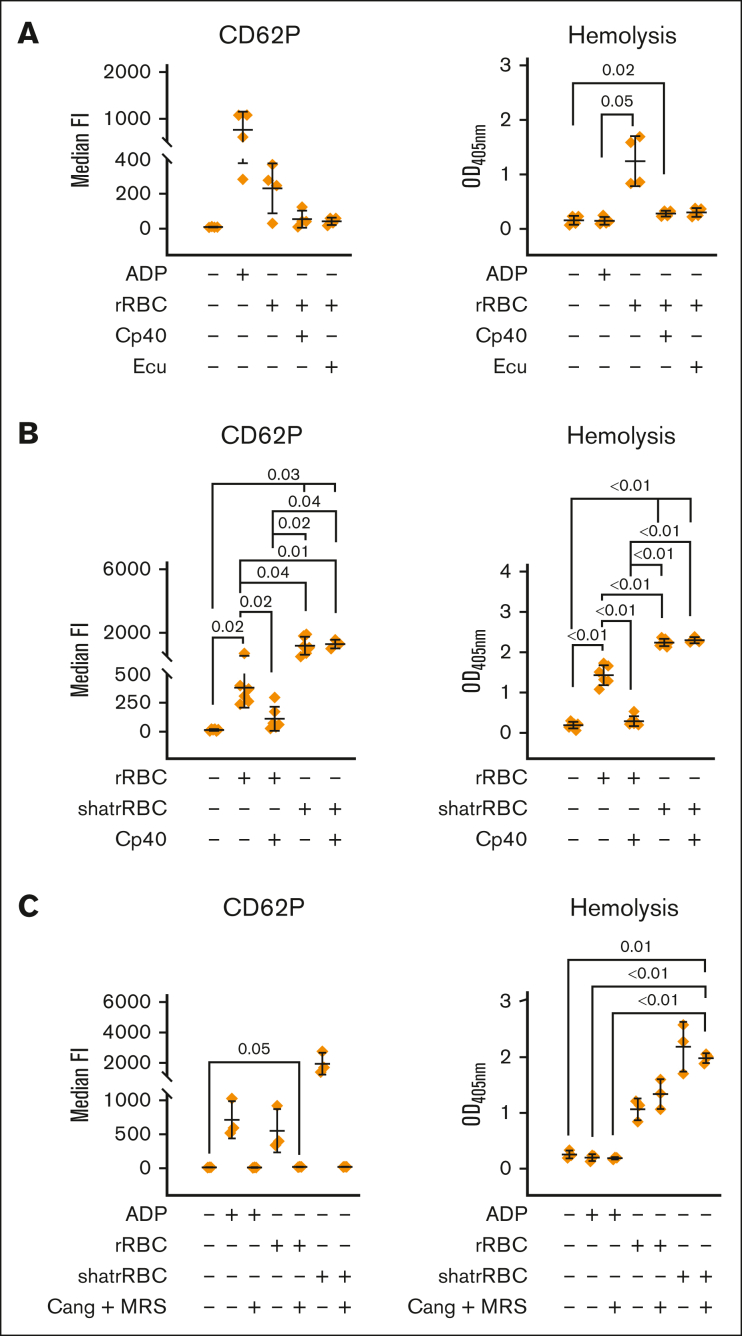
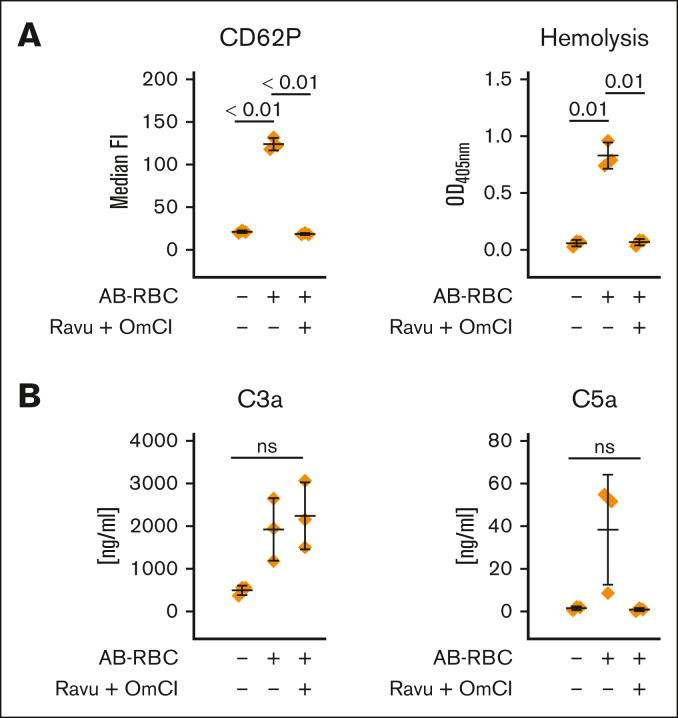
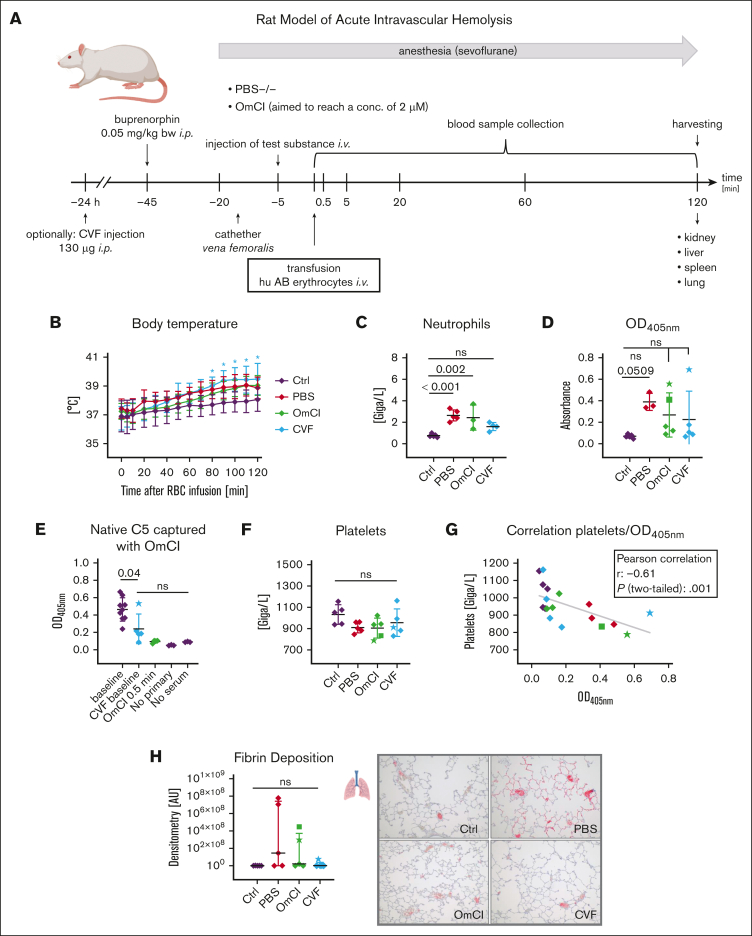
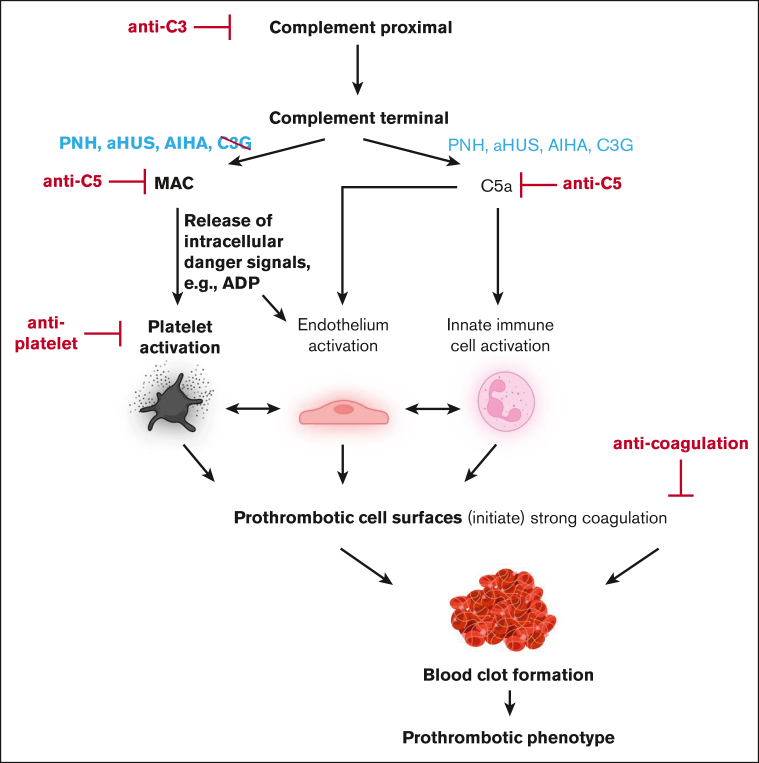
Complement activation in the diseases paroxysmal nocturnal hemoglobinuria (PNH) and atypical hemolytic uremic syndrome (aHUS) results in cytolysis and fatal thrombotic events, which are largely refractory to anticoagulation and/or antiplatelet therapy. Anticomplement therapy, however, efficiently prevents thrombotic events in PNH and aHUS, but the underlying mechanisms remain unresolved. We show that complement-mediated hemolysis in whole blood induces platelet activation similarly to activation by adenosine 5'-diphosphate (ADP). Blockage of C3 or C5 abolished platelet activation. We found that human platelets failed to respond functionally to the anaphylatoxins C3a and C5a. Instead, complement activation did lead to prothrombotic cell activation in the whole blood when membrane attack complex (MAC)-mediated cytolysis occurred. Consequently, we demonstrate that ADP receptor antagonists efficiently inhibited platelet activation, although full complement activation, which causes hemolysis, occurred. By using an established model of mismatched erythrocyte transfusions in rats, we crossvalidated these findings in vivo using the complement inhibitor OmCI and cobra venom factor. Consumptive complement activation in this animal model only led to a thrombotic phenotype when MAC-mediated cytolysis occurred. In conclusion, complement activation only induces substantial prothrombotic cell activation if terminal pathway activation culminates in MAC-mediated release of intracellular ADP. These results explain why anticomplement therapy efficiently prevents thromboembolisms without interfering negatively with hemostasis.


Conflict of interest statement

Conflict-of-interest disclosure: C.Q.S., H.S., and M.H.-L. are listed as inventors on (a) patent application(s) that describes the use of complement inhibitors for therapeutic applications. C.Q.S. has received research funding from pharmaceutical companies. M.H.-L., C.Q.S., and H.S. received honoraria for speaking at symposia organized by Alexion Pharmaceuticals. H.S. served on advisory committees for Alexion AstraZeneca Rare Diseases, Sanofi, Sobi, and Novartis; received research funding from Alexion Pharmaceuticals (all to the University of Ulm); and served on an advisory committee for Ra Pharmaceuticals and Alnylam. The remaining authors declare no competing financial interests.

Figures

None
Graphical abstract
Figure 1.
Figure 1.
Artificial surface-induced complement activation and its effect on polymorphonuclear cell activation in whole blood. FPX-anticoagulated blood was incubated for 0 (BL), 30, or 120 minutes at 37°C in the presence or absence of Cp40 (20 μM). (A) Levels of C3a, C5a, and SC5b-9 were determined via enzyme-linked immunosorbent assay (ELISA), using EDTA plasma that was obtained from the whole blood model after each time point. (B) Activation of polymorphonuclear cells. Surface expression of the activation markers CD11b and CD62L was measured via flow cytometry. The average of the mean fluorescence intensities is shown. (C-D) Inflammation marker interleukin-8 (IL-8) and matrix metalloproteinase-9 (MMP-9) were determined from EDTA-treated plasma (derived from the whole blood model) via ELISA. For all panels, the mean values from 4 to 8 independent assays ± standard deviation are shown. Data sets were tested for outliers using the ROUT outlier test (Q = 5%). In the data set of panel A, 2 outliers were removed for each C3a and C5a before statistical testing; in the data set of panel C, 5 and 2 outliers were removed for IL-8 and MMP-9, respectively. Data sets were analyzed using either the Prism mixed-effects model (panels A [C3a, C5a] and C) or repeated measures one-way analysis of variance (ANOVA) (panels A [SC5b-9] and B). Experimental groups were post hoc tested for statistical significance against the 120 minutes + Cp40 group with correction for multiple comparisons (Tukey test, panel A; or Dunnett comparison in panels B-C). For the sake of visibility, nonsignificant P values were omitted from graphs, unless they were of relevance to the experimental hypotheses. ns, not significant.
Figure 2.
Figure 2.
Effect of artificial surface-induced complement activation on the hemostatic system in whole blood. FPX-anticoagulated blood was incubated for 0, 30, or 120 minutes at 37°C in the presence or absence of Cp40 (20 μM) and assessed for (A) platelet count and (B) global coagulatory parameters (prothrombin time [PT] and partial thromboplastin time [aPTT]). (C) The generation of thrombin/antithrombin complexes was measured in EDTA-treated plasma via ELISA. (D-E) EDTA-treated plasma derived from the whole blood reactions was analyzed for the concentrations of the soluble platelet activation markers CD40L and von Willebrand factor. (F) The activation status of platelets in whole blood was determined by CD62P surface expression using flow cytometry. After the indicated incubation time, blood was exposed for 10 minutes either to PBS (negative control [neg. Ctrl]) or ADP (5 μM). All graphs show mean values with standard deviation of at least 4 independent assays. For all panels, the mean values of at least 4 independent assays ± standard deviation are shown. Data sets were tested for outliers using the ROUT outlier test (Q = 5%). Data sets were either analyzed using either Prism mixed-effects model (in case of missing values) or repeated measures one-way ANOVA. Experimental groups were post hoc tested for statistical significance against the 120 minutes + Cp40 group with Dunnett correction for multiple comparisons (panels A-E) or against each other experimental group (Tukey test with correction for multiple comparisons). For the sake of visibility, nonsignificant P values were omitted from graphs, unless they were of relevance to the experimental hypotheses.
Figure 3.
Figure 3.
Influence of anaphylatoxins on platelet activation. (A) Anaphylatoxin stimulation of isolated platelets. Isolated platelets were exposed to either PBS−/− (neg Ctrl), ADP (5 μM), thrombin (Thr, 0.2 U/mL), C3a (1000 ng/mL), C4a (1000 ng/mL), or C5a (100 ng/mL) alone or in combination, as indicated. After stimulation for 10 minutes, cells were analyzed via flow cytometry for surface expression of the activation markers CD62P or CD63. (B) Multiplate aggregometry. Lepirudin-anticoagulated blood or platelet-rich plasma was mixed with NaCl (0.9%, neg. Ctrl), ADP (6.5 μM), TRAP (32 μM), C3a (1.8 μM), or C5a (0.18 μM), 2 minutes before analyzing platelet aggregation. Mean of the area under the curve with standard deviation is shown. (C) ROTEM without the addition of a specific reagent that activates the intrinsic or extrinsic pathway. Immediately before starting the reaction, citrated blood was exposed to Thr (1 U/mL), C3a (1.8 μM), or C5a (0.18 μM) and was recalcified without addition of the extrinsic or intrinsic pathway starting reagents. Mean values with standard deviation of the clotting time are shown. (D) Expression of anaphylatoxin receptors on platelets. Isolated platelets were stimulated with either PBS−/− (neg Ctrl) or ADP (5 μM) and Thr (0.2 U/mL) for 10 minutes before being analyzed for C3aR (final antibody concentration: 2 μg/mL, clone: hC3aRZ8), C5aR1 (final antibody concentration: 1 μg/mL; clone: S5/1), and C5aR2 (final antibody concentration: 4 μg/mL; clone: 1D9-M12) surface expression. Respective isotype controls were included in equimolar concentrations. Mean values with standard deviations are shown. (E) C3aR expression on isolated platelets. As in panel D but with isotype staining after platelet stimulation. At least 3 independent assays are shown in each panel. Data sets were tested for outliers using the ROUT outlier test (Q = 5%). Data sets in panels A [CD62P ADP, CD62P Thr], B-C, and E were analyzed using repeated measures one-way ANOVA and data set in panel A [CD63 Thr]) by Prism mixed-effects model (because of a missing value). Experimental groups were post hoc tested for statistical significance with correction for multiple comparisons (panel A, Sidak; panel B, Dunnet comparison; and panels C,E, Tukey test). The data set in panel D was tested using a repeated measures two-way ANOVA test for adjusted multiple comparisons. For the sake of visibility, nonsignificant P values were omitted from graphs, unless they were of relevance to the experimental hypotheses.
Figure 4.
Figure 4.
Complement-dependent and independent lysis of rabbit erythrocytes cause platelet activation, which is abolished via ADP receptor antagonists. (A) Complement-mediated lysis of rRBCs induces platelet activation. Hirudin-anticoagulated blood was exposed to PBS−/− (neg Ctrl), ADP (5 μM), or rRBCs in presence or absence of proximal (Cp40, 4 μM) and terminal (eculizumab [Ecu], 0.4 μM) complement inhibitors. The final blood percentage was 20%. Surface expression of the activation marker CD62P was determined via flow cytometry. Hemolytic activity was determined in respective plasma samples measuring released hemoglobin from the supernatant (after blank subtraction). (B) Complement-dependent and -independent lysis of cells lead to platelet activation. As in panel A, but in addition to intact rRBCs, mechanically shattered rRBCs (shatrRBC) were also assayed with and without complement inhibition by Cp40. All graphs show mean values with standard deviation. (C) Hirudin-anticoagulated blood was exposed to PBS−/− (neg Ctrl), ADP (5 μM), rRBCs, or shatrRBC in presence or absence of ADP receptor antagonists cangrelor (1 μM) or MRS2179 (10 μM). Surface expression of CD62P on platelets was determined by flow cytometry. Hemolytic activity was measured in respective plasma samples. Mean values with standard deviation are shown. Data sets were tested for outliers using the ROUT outlier test (Q = 5%). Data sets were either analyzed using a Prism mixed-effects model (in case of missing values) or repeated measures one-way ANOVA. Experimental groups were post hoc tested for statistical significance with Tukey correction for multiple comparisons. For the sake of visibility, nonsignificant P values were omitted from graphs, unless they were of relevance to the experimental hypotheses.
Figure 5.
Figure 5.
AB/O-mismatch–induced lysis of human RBCs causes platelet activation. Washed erythrocytes of a donor with AB-group blood were added to hirudin-anticoagulated whole blood of a donor with group O blood in absence or presence of ravulizumab and OmCI (both at final concentration of 0.8 μM). (A) Surface expression of the platelet activation marker CD62P was determined via flow cytometry, and hemolytic activity was determined in the respective plasma samples measuring released hemoglobin from the supernatant. (B) The level of complement activation in the reaction mixtures was investigated by measurement of C3a and C5a concentrations after the reactions had been stopped by the addition of EDTA. Data sets were either analyzed using a Prism mixed-effects model (in case of missing values) or repeated measures one-way ANOVA. Experimental groups were post hoc tested for statistical significance with Tukey correction for multiple comparisons. For the sake of visibility, nonsignificant P values were omitted from graphs, unless they were of relevance to the experimental hypotheses.
Figure 6.
Figure 6.
Rat model of acute intravascular hemolysis. (A) Experimental setup. Human AB erythrocytes were transfused in male Wistar rats simulating a 15% mismatch transfusion to induce an acute intravascular hemolysis. Animals were either pretreated with PBS−/− or OmCI (the aim was a 2-μM final concentration), alternatively, CVF (130 μg) was injected 24 hours before the start of transfusion to allow depletion of the complement system. Blood collection took place at indicated time points after transfusion. After 2 hours, animals were euthanized, and organs were extracted to assess end-organ analysis. (B) Body temperature. Animals were monitored for temperature after transfusion. Mean values with standard deviation are shown at each time point. A star indicates significant difference from control animals without RBC treatment. (C-D) End point clinical blood analysis of neutrophil count and hemolysis levels measured by spectrophotometric analysis of released hemoglobin. Mean values with standard deviation are shown. Star or square symbols in the OmCI and CVF group indicate outlier animals and correspond to star or square values in all other graphs. (E) ELISA-based measurement of nonactivated C5. EDTA-treated plasma samples were added to the surface-coated OmCI-FH8-15 fusion protein, which only binds native, nonactivated C5. Captured C5 was detected using a polyclonal anti-rat C5a antibody (PA5-78891). (F) End point clinical blood analysis of neutrophil count. (G) Correlation between platelets and released hemoglobin (optical density, 405 nm [OD405nm]). (H) Fibrin deposition in lungs was visualized via immunohistochemical staining against fibrinogen β chain and red signal intensity was quantified. From each group, 1 representative image (original magnification ×100) is shown. Data sets were tested for outliers using the ROUT outlier test (Q = 5%). In panel B, each time point was compared with the respective time point in the Ctrl group. Data sets in panels C-F and panel H were analyzed with one-way ANOVA. Experimental groups were post hoc tested for statistical significance against Ctrl/baseline with Dunnett correction for multiple comparisons (panels C-D,F,H) or against each other experimental group (Tukey test with correction for multiple comparisons). In panel G, data sets were tested for correlation using Pearson test. For the sake of visibility, nonsignificant P values were omitted from graphs, unless they were of relevance to the experimental hypotheses.
Figure 7.
Figure 7.
Schematic diagram of complement-induced prothrombotic phenotype. Strong proximal complement activation culminates in terminal pathway activation liberating C5a and inducing MAC assembly. Although C5a is liberated in C3G, PNH, aHUS, and autoimmune hemolytic anemia (AIHA), cytolytic MAC complexes are reported for the latter 3 but not C3G. MAC-mediated release of the intracellular danger signal ADP induces prothrombotic activation states of platelets and endothelial cells, culminating in thrombosis. Potential therapeutic intervention strategies are shown in red. Elements in bold font depict concepts derived from data of this study. The illustration was created with BioRender.com.

Comment in

References

    1. Luzzatto L, Gianfaldoni G, Notaro R. Management of paroxysmal nocturnal haemoglobinuria: a personal view. Br J Haematol. 2011;153(6):709–720. - PubMed
    1. Brodsky RA. Paroxysmal nocturnal hemoglobinuria. Blood. 2014;124(18):2804–2811. - PMC - PubMed
    1. Parker CJ. The pathophysiology of paroxysmal nocturnal hemoglobinuria. Exp Hematol. 2007;35(4):523–533. - PubMed
    1. Hill A, Kelly RJ, Hillmen P. Thrombosis in paroxysmal nocturnal hemoglobinuria. Blood. 2013;121(25):4985–4996. quiz 5105. - PubMed
    1. Audebert HJ, Planck J, Eisenburg M, Schrezenmeier H, Haberl RL. Cerebral ischemic infarction in paroxysmal nocturnal hemoglobinuria report of 2 cases and updated review of 7 previously published patients. J Neurol. 2005;252(11):1379–1386. - PubMed

Publication types

Substances