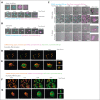
Lack of eosinophil extracellular trap formation due to failure of plasma membrane breakdown in the absence of elastase
- PMID: 37428870
- PMCID: PMC10558608
- DOI: 10.1182/bloodadvances.2022009432
Lack of eosinophil extracellular trap formation due to failure of plasma membrane breakdown in the absence of elastase
Abstract
Activated eosinophils are described to release eosinophil extracellular traps (EETs), which consist of the cell's DNA covered with granule-derived antimicrobial peptides. Upon stimulation of eosinophils with the known EET-inducers phorbol 12-myristate 13-acetate, monosodium urate crystals, or Candida albicans, we observed that their plasma membrane became compromised, resulting in accessibility of the nuclear DNA for staining with the impermeable DNA dye Sytox Green. However, we did not observe any DNA decondensation or plasma membrane rupture by eosinophils, which sharply contrasts with neutrophil extracellular trap (NET) formation and the subsequent cell death known as NETosis. Neutrophil elastase (NE) activity is thought to be essential for the cleavage of histones and chromatin decondensation during NETosis. We observed that the neutrophils of a patient with a mutation in ELANE, leading to congenital neutropenia and NE deficiency, were unable to undergo NETosis. Taken together, we may suggest that the natural absence of any NE-like proteolytic activity in human eosinophils explains why EET formation is not observed, even when eosinophils become positive for an impermeable DNA dye in response to stimuli that induce NETosis in neutrophils.
© 2023 by The American Society of Hematology. Licensed under Creative Commons Attribution-NonCommercial-NoDerivatives 4.0 International (CC BY-NC-ND 4.0), permitting only noncommercial, nonderivative use with attribution. All other rights reserved.
Conflict of interest statement
Conflict-of-interest disclosure: The authors declare no competing financial interests.
Figures


Similar articles
-
Neutrophil elastase-deficient mice form neutrophil extracellular traps in an experimental model of deep vein thrombosis.J Thromb Haemost. 2016 Mar;14(3):551-8. doi: 10.1111/jth.13239. Epub 2016 Feb 5. J Thromb Haemost. 2016. PMID: 26712312 Free PMC article.
-
NETosis proceeds by cytoskeleton and endomembrane disassembly and PAD4-mediated chromatin decondensation and nuclear envelope rupture.Proc Natl Acad Sci U S A. 2020 Mar 31;117(13):7326-7337. doi: 10.1073/pnas.1909546117. Epub 2020 Mar 13. Proc Natl Acad Sci U S A. 2020. PMID: 32170015 Free PMC article.
-
Measurement of NET formation in vitro and in vivo by flow cytometry.Cytometry A. 2017 Aug;91(8):822-829. doi: 10.1002/cyto.a.23169. Epub 2017 Jul 17. Cytometry A. 2017. PMID: 28715618 Free PMC article.
-
Metastatic potential of NET in neoplastic disease.Postepy Hig Med Dosw (Online). 2016 Aug 31;70(0):887-95. doi: 10.5604/17322693.1216275. Postepy Hig Med Dosw (Online). 2016. PMID: 27594564 Review.
-
NETosis: Molecular Mechanisms, Role in Physiology and Pathology.Biochemistry (Mosc). 2020 Oct;85(10):1178-1190. doi: 10.1134/S0006297920100065. Biochemistry (Mosc). 2020. PMID: 33202203 Free PMC article. Review.
Cited by
-
Serum Galectin-10: A biomarker for persistent airflow limitation in adult asthmatics.World Allergy Organ J. 2024 Aug 21;17(9):100955. doi: 10.1016/j.waojou.2024.100955. eCollection 2024 Sep. World Allergy Organ J. 2024. PMID: 39252790 Free PMC article.
-
Shirebi granules ameliorate acute gouty arthritis by inhibiting NETs-induced imbalance between immunity and inflammation.Chin Med. 2024 Aug 9;19(1):105. doi: 10.1186/s13020-024-00962-6. Chin Med. 2024. PMID: 39123236 Free PMC article.
References
-
- Brinkmann V, Reichard U, Goosmann C, et al. Neutrophil extracellular traps kill bacteria. Science. 2004;303(5663):1532–1535. - PubMed
-
- Daniel C, Leppkes M, Munoz LE, Schley G, Schett G, Herrmann M. Extracellular DNA traps in inflammation, injury and healing. Nat Rev Nephrol. 2019;15(9):559–575. - PubMed
-
- Persson C, Uller L. Primary lysis of eosinophils as a major mode of activation of eosinophils in human diseased tissues. Nat Rev Immunol. 2013;13(12):902. - PubMed

