. 2023 Jul 18;120(29):e2207993120.
doi: 10.1073/pnas.2207993120. Epub 2023 Jul 10.

NOS inhibition reverses TLR2-induced chondrocyte dysfunction and attenuates age-related osteoarthritis

Affiliations

NOS inhibition reverses TLR2-induced chondrocyte dysfunction and attenuates age-related osteoarthritis

Ping Shen et al. Proc Natl Acad Sci U S A. .

Abstract

Osteoarthritis (OA) is a joint disease featuring cartilage breakdown and chronic pain. Although age and joint trauma are prominently associated with OA occurrence, the trigger and signaling pathways propagating their pathogenic aspects are ill defined. Following long-term catabolic activity and traumatic cartilage breakdown, debris accumulates and can trigger Toll-like receptors (TLRs). Here we show that TLR2 stimulation suppressed the expression of matrix proteins and induced an inflammatory phenotype in human chondrocytes. Further, TLR2 stimulation impaired chondrocyte mitochondrial function, resulting in severely reduced adenosine triphosphate (ATP) production. RNA-sequencing analysis revealed that TLR2 stimulation upregulated nitric oxide synthase 2 (NOS2) expression and downregulated mitochondria function-associated genes. NOS inhibition partially restored the expression of these genes, and rescued mitochondrial function and ATP production. Correspondingly, Nos2-/- mice were protected from age-related OA development. Taken together, the TLR2-NOS axis promotes human chondrocyte dysfunction and murine OA development, and targeted interventions may provide therapeutic and preventive approaches in OA.

Keywords: Toll-like receptors; cartilage-anabolic and catabolic activities; chondrocytes; nitric oxide synthase; osteoarthritis.


Conflict of interest statement

The authors declare no competing interest.

Figures
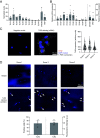
Fig. 1.
Fig. 1.
Human chondrocytes express various TLRs. (A) Cartilage tissue from knee joints of OA patients was dissected freshly ex vivo and immediately subjected to RNA isolation (two samples per patient). RNA-seq analysis was conducted. Normalized read counts of the duplicates were averaged. Data present averaged normalized read counts of TLR1 to TLR10 MYD88, and TRIF (n = 4, mean + SD). (B) TaqMan PCR was further employed to detect the expression of TLR family members, MYD88, and TRIF in fresh cartilage (n = 7, mean + SD). (C) Cylinders of cartilage tissue were collected freshly ex vivo and processed for RNAScope assay. Probes against the bacterial gene DapB were used for negative control stainings. Violin plots show TLR2 mRNA expression in situ, using 100 arbitrary units as cutoff, in individual chondrocytes of three patients (mean ± SD). (D) Cartilage cylinders were collected immediately after surgery and processed for immunofluorescence analysis of TLR2 protein. The upper panel shows representative pictures of TLR2 and the corresponding isotype control staining from three donors, and the lower panel indicates the percentage of TLR2-positive cells among all the cells in the analyzed fields and the fluorescence intensity (arbitrary units) of the TLR2-positive cells (n = 8, mean + SD).
Fig. 2.
Fig. 2.
Chondrocytes respond differently to distinct TLR stimulation. Chondrocyte spheroids were generated from knee cartilage of OA patients and stimulated with agonists of TLR1/2, 3, 4, 5, 2/6, 7, 8, and 9 for 28 d. (A) The weight of three spheroids per condition was averaged. Combined data of independent experiments with chondrocytes derived from six OA patients are shown (n = 6, mean + SD). (B) Spheroids were formalin-fixed, paraffin-embedded, sectioned, and stained with Alcian blue and Nuclear Fast red. Representative images of each condition from the same patient are shown. (CF) Spheroids were lysed for mRNA isolation. The expression of anabolic factors COL2A1 and ACAN (n = 6), and catabolic factors MMP3 and ADAMTS5 (n = 7) was assessed by qPCR (mean + SD). (GI) Supernatants were harvested on day 28 and analyzed using Bio-Plex assays to determine the concentrations of IL-6, IL-8, and G-CSF (n = 6, mean + SD). For statistical analysis, Friedman test was performed comparing each TLR-stimulated condition to the respective Ctrl. P values > 0.05 are considered as nonsignificant (ns).
Fig. 3.
Fig. 3.
TLR1/2 stimulation impairs mitochondrial respiration of human chondrocytes, and anti-TLR2 pretreatment prevents the impairment of mitochondrial respiration and the loss of matrix components. Chondrocyte spheroids were stimulated with TLR1/2 agonist P3C4 for 3.5 d. (A) Spheroids were grinded and lysed individually to release ATP, which was immediately quantified and calculated as number of ATP molecules per spheroid (n = 9). (B and C) Spheroids were dissociated with collagenase II to generate single chondrocytes, which were subsequently stained with MitoSpy and TMRM. Graphs show representative stainings and fluorescence intensity of MitoSpy (B) and TMRM (C) (n = 10). (D and E) Chondrocyte spheroids were transferred individually into Seahorse XFe96 Spheroid Microplate wells and analyzed for their OXPHOS (D) and glycolytic activity (E) using Mito Stress Test Kits (n = 13). Data were compared using paired two-tailed t test. For (B and C), Wilcoxon matched-pairs signed-rank test was applied. (F and G) Chondrocyte spheroids were generated and preincubated with a monoclonal blocking TLR2 antibody for 3 h, prior to the addition of P3C4. After 4 d of culture, spheroids were collected for Seahorse assays (F, n = 5, mean + SD). Some spheroids were kept in culture until day 28. Glycosaminoglycans (GAGs) and DNA content were quantified, and the ratios of GAGs to DNA are plotted (G, n = 4, mean + SD). Data were analyzed with one-way ANOVA (ns, P > 0.05).
Fig. 4.
Fig. 4.
32-mer treatment tends to reduce anabolic factor expression and metabolic activity and to increase the expression of catabolic and inflammatory factors. 32-mer peptide of aggrecan was added to chondrocyte spheroid cultures. On day 4, spheroids were harvested for mRNA detection (A and B, n = 4, mean + SD) or for Seahorse assay (C, n = 3, mean + SD). Data were analyzed with one-tailed paired t test.
Fig. 5.
Fig. 5.
TLR1/2-induced chondrocyte dysfunction is not mediated by enhanced ROS accumulation or reduced mitochondrial respiration. Chondrocyte spheroids were stimulated with P3C4 for 3.5 d. Spheroids were then dissociated with collagenase II to generate single chondrocytes, which were stained with MitoSOX (A) and DCFDA (B), separately. Left, Representative FACS plots. Right, geometric fluorescence intensity of MitoSOX (n = 10) or DCFDA (n = 7). Data (mean + SD) were analyzed using two-tailed Wilcoxon matched-pairs test. (CI) Chondrocyte spheroids were generated and stimulated with P3C4 for 3.5 d. Decreasing concentrations of rotenone were added to inhibit mitochondrial respiration. Spheroids were grinded and lysed to quantify ATP production (C). Spheroids were lysed for mRNA isolation. COL2A1, ACAN, ADAMTS5, IL6, IL8, and GCSF expression was determined by qPCR (DI). (CI) Data (n = 6, mean + SD) were analyzed using Friedman test to compare each TLR-stimulated condition to the respective Ctrl. P values > 0.05 are considered as nonsignificant (ns).
Fig. 6.
Fig. 6.
TLR1/2 stimulation promotes nitric oxide production and reduces metabolic gene expression. (A) RNA-seq was performed on human chondrocyte spheroids that were cultured with or without P3C4 for 3.5 d. Differentially expressed genes are plotted in a volcano plot, in which genes encoding cartilage-anabolic and catabolic factors are colored in purple and the top 15 hits of genes belonging to the gene set “cytokine signaling in immune system” are colored in red. (B) Heatmap displaying the expression of the top 15 hits of genes belonging to the gene set “cytokine signaling in immune system” per patient sample. (C) Expression of NOS2 mRNA (n = 7) and production of nitric oxide (n = 12) were determined in chondrocyte spheroid cells and supernatants, respectively. Data (mean + SD) were analyzed using two-tailed Wilcoxon matched-pairs test. (D) Chondrocyte spheroids were preincubated with a blocking TLR2 antibody for three hours, prior to the addition of P3C4. After 4 d of culture, supernatants were harvested for NO quantification (n = 7, mean + SD). (E) 32-mer peptide was added to chondrocyte spheroids. On day 4, supernatants were collected for NO quantification (n = 4, mean + SD). Data were analyzed with one-tailed paired t test. (F and G) Gene set enrichment analysis was performed on four Gene Ontology gene sets based on a ranked gene list with the log2(Fold change) as underlying metric. P values and normalized enrichment scores (NES) are given per gene set.
Fig. 7.
Fig. 7.
NOS inhibition restores mitochondrial gene expression and function. Chondrocyte spheroids were cultured with or without P3C4 for 3.5 d. In parallel, increasing amounts of NOS inhibitor L-NAME (N) were added to the P3C4-stimulated cultures (N0.1: 0.1 mM; N1: 1 mM; N10: 10 mM). (A) Nitric oxide content in the supernatants was determined by Griess reaction assay (n = 16, mean + SD). (B) Mitochondrial membrane potential of spheroid chondrocytes was assessed via TMRM staining (n = 7, mean + SD). (C) Intracellular ATP production of spheroid chondrocytes was quantified (n = 5, mean + SD). (D) RNA-seq analysis was performed for spheroids that were unstimulated (Ctrl) or stimulated with P3C4 or with P3C4+N1. Overrepresentation analysis on genes downregulated by P3C4 and then restored by addition of L-NAME (N1) on all “gene ontology biological processes” gene sets, of which three pathways that relate to oxygen consumption and metabolism have been selected among the gene sets with a FDR < 0.05. (E) The 26 mitochondroid genes that were downregulated by P3C4 and restored by addition of N1 were grouped according to their biological functions. (F) Spheroids were transferred individually into the Seahorse XFe96 Spheroid Microplate and analyzed for their OXPHOS activity using Mito Stress Test kits (n = 10, mean + SD). For AC and F, statistical analyses were done using Friedman test. P values > 0.05 are considered as nonsignificant (ns).
Fig. 8.
Fig. 8.
NOS inhibition attenuates inflammation and prevents age-related OA. (A) Chondrocyte spheroids were cultured with or without P3C4 for 3.5 d. In parallel, 1 mM NOS inhibitor L-NAME (N) were added to the P3C4-stimulated cultures. Unstimulated spheroids (Ctrl), together with those stimulated with P3C4 or P3C4+N1 were processed for mRNA isolation. Expression of NFKB, IL6, IL8, GCSF, MMP3, ADAMTS5, COL2A1, and ACAN was determined by qPCR (n = 10, mean + SD). (B) Spheroids that were unstimulated (Ctrl) or stimulated with P3C4 or with P3C4+N1 were cultured for 28 d. The weight of each spheroid was determined (n = 8, mean + SD). For panels A and B, statistical analyses were done using Friedman test. P values > 0.05 are considered as nonsignificant (ns). (CE) C57BL/6 (WT) and Nos2−/− mice were kept until 2 y of age. Knee OA severity and body weight were determined. Representative images of Safranin-O/Fast green staining of knee joints and modified OARSI scores (C), representative images of Safranin-O/Fast green staining of knee joints and modified Krenn scores to assess synovitis (D), as well as body weight (E) of WT and Nos2−/− mice (n = 8, mean + SD) are shown. Modified OARSI and Krenn scores were compared using Mann–Whitney U test, and weight comparison was performed using unpaired two-tailed t test.

References

    1. Safiri S., et al. , Global, regional and national burden of osteoarthritis 1990–2017: A systematic analysis of the Global Burden of Disease Study 2017. Ann. Rheum. Dis. 79, 819–828 (2020). - PubMed
    1. Imamura M., et al. , Serum levels of proinflammatory cytokines in painful knee osteoarthritis and sensitization. Int. J. Inflam. 2015, 329792 (2015). - PMC - PubMed
    1. Ren G., et al. , Serum and synovial fluid cytokine profiling in hip osteoarthritis: Distinct from knee osteoarthritis and correlated with pain. BMC Musculoskelet. Disord. 19, 39 (2018). - PMC - PubMed
    1. Kapoor M., Martel-Pelletier J., Lajeunesse D., Pelletier J. P., Fahmi H., Role of proinflammatory cytokines in the pathophysiology of osteoarthritis. Nat. Rev. Rheumatol. 7, 33–42 (2011). - PubMed
    1. Chevalier X., et al. , Intraarticular injection of anakinra in osteoarthritis of the knee: A multicenter, randomized, double-blind, placebo-controlled study. Arthritis Rheum. 61, 344–352 (2009). - PubMed

Publication types