. 2023 Jul 18;120(29):e2305764120.
doi: 10.1073/pnas.2305764120. Epub 2023 Jul 10.

Functional interrogation of lymphocyte subsets in alopecia areata using single-cell RNA sequencing

Affiliations

Functional interrogation of lymphocyte subsets in alopecia areata using single-cell RNA sequencing

Eunice Y Lee et al. Proc Natl Acad Sci U S A. .

Abstract

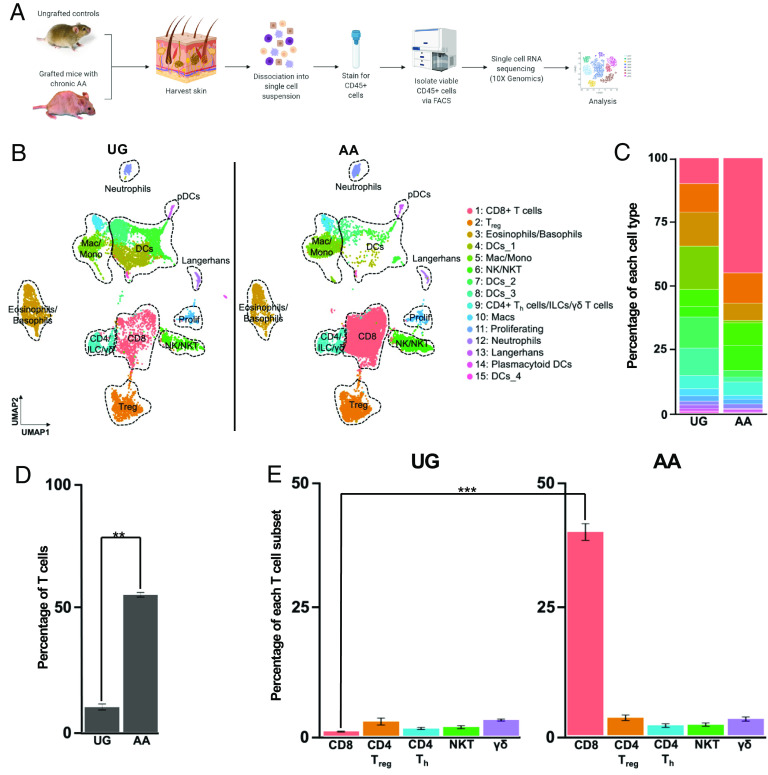
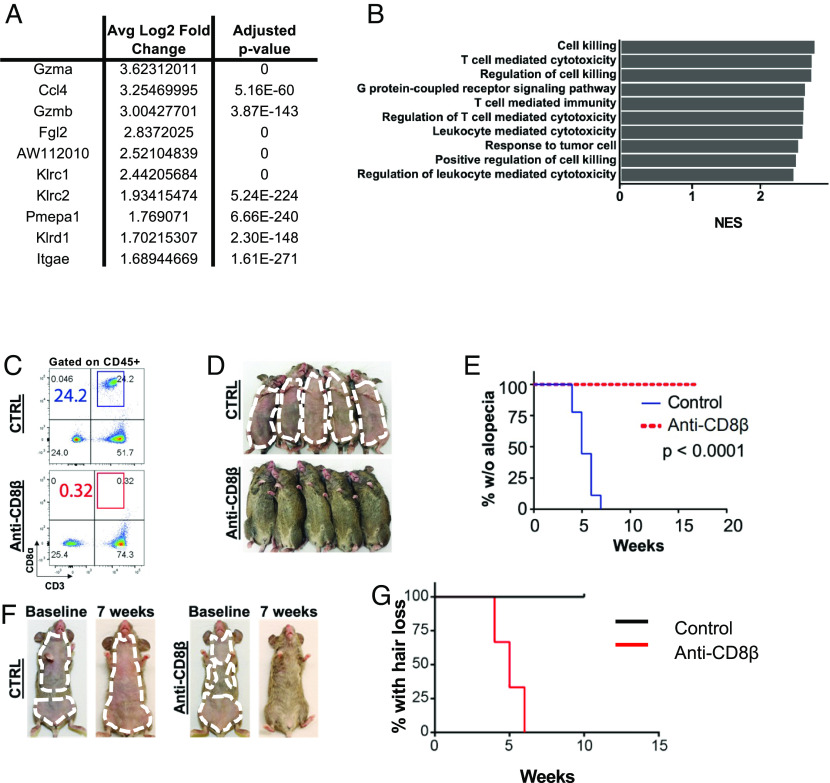
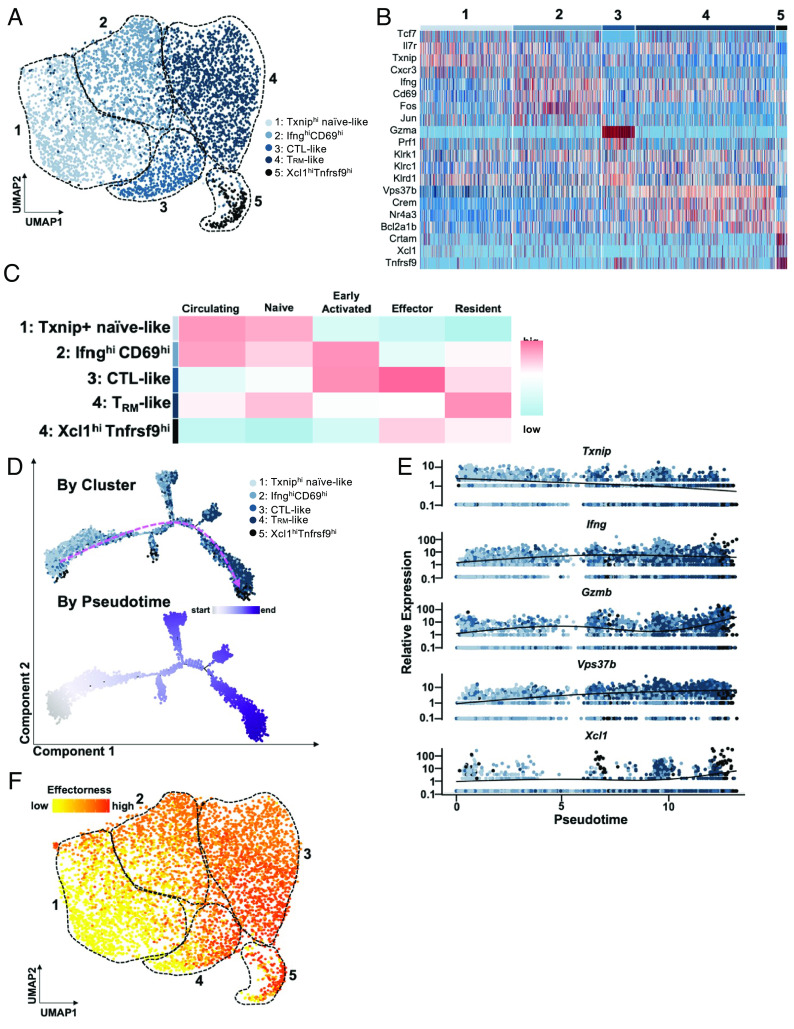
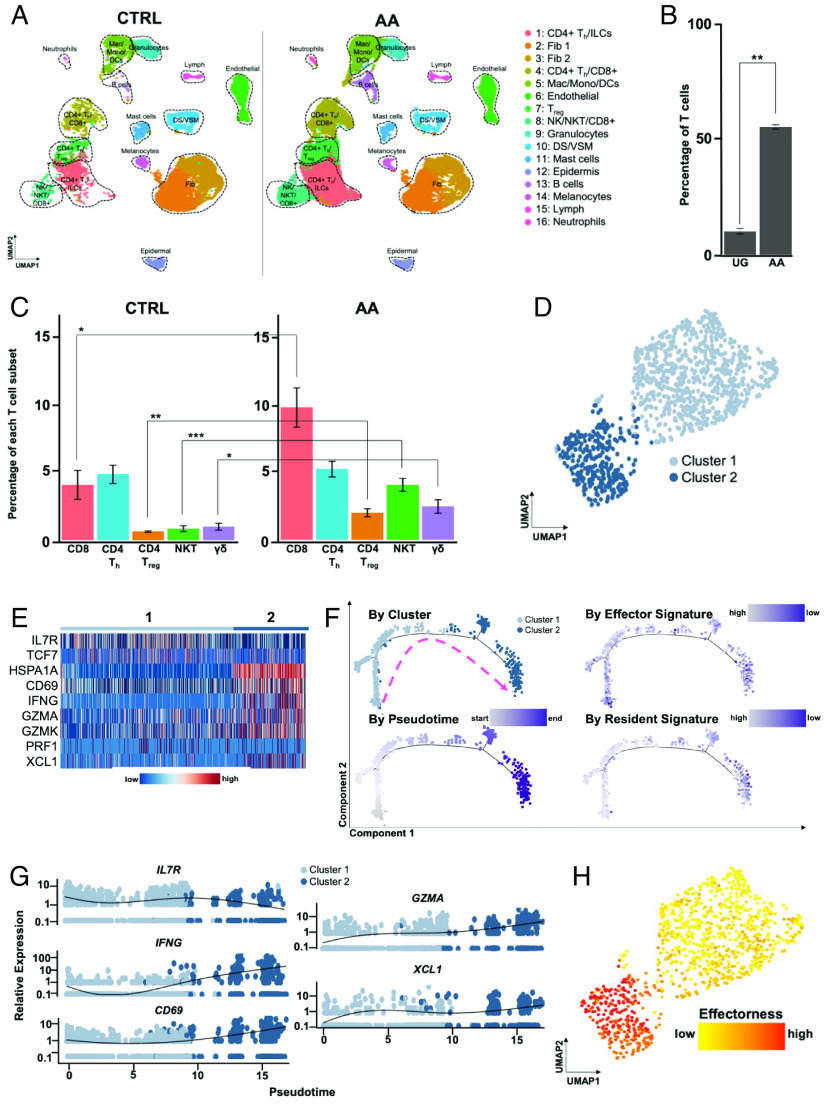
Alopecia areata (AA) is among the most prevalent autoimmune diseases, but the development of innovative therapeutic strategies has lagged due to an incomplete understanding of the immunological underpinnings of disease. Here, we performed single-cell RNA sequencing (scRNAseq) of skin-infiltrating immune cells from the graft-induced C3H/HeJ mouse model of AA, coupled with antibody-based depletion to interrogate the functional role of specific cell types in AA in vivo. Since AA is predominantly T cell-mediated, we focused on dissecting lymphocyte function in AA. Both our scRNAseq and functional studies established CD8+ T cells as the primary disease-driving cell type in AA. Only the depletion of CD8+ T cells, but not CD4+ T cells, NK, B, or γδ T cells, was sufficient to prevent and reverse AA. Selective depletion of regulatory T cells (Treg) showed that Treg are protective against AA in C3H/HeJ mice, suggesting that failure of Treg-mediated immunosuppression is not a major disease mechanism in AA. Focused analyses of CD8+ T cells revealed five subsets, whose heterogeneity is defined by an "effectorness gradient" of interrelated transcriptional states that culminate in increased effector function and tissue residency. scRNAseq of human AA skin showed that CD8+ T cells in human AA follow a similar trajectory, underscoring that shared mechanisms drive disease in both murine and human AA. Our study represents a comprehensive, systematic interrogation of lymphocyte heterogeneity in AA and uncovers a novel framework for AA-associated CD8+ T cells with implications for the design of future therapeutics.

Keywords: T cells; alopecia areata; autoimmunity; hair follicle; single-cell RNA sequencing.


Conflict of interest statement

N.A. is a scientific advisor and an equity holder in Shennon Biotechnologies and is a consultant for Janssen, Immunitas, 23 and me, and Cellino Pharmaceuticals. A.M.C. is a consultant/scientific advisor for Almirall S.A., Arcutis Biotherapeutics, Inc., Intrinsic Medicine, Inc., and Pfizer, Inc.; is a shareholder of Aclaris Therapeutics, Inc. and Intrinsic Medicine, Inc.; has received research grant support from Pfizer, Inc.; is a coinventor on several patents filed by Columbia University on the use of JAK inhibitors in treating hair loss disorders, which have been licensed to Aclaris Therapeutics, Inc. and sublicensed from Aclaris to Eli Lilly & Co., resulting in intellectual property payments to the coinventors and to Columbia University; serves on the scientific advisory boards for the Dystrophic EB Research Association of America and the National AA Foundation; and is currently President of the American Hair Research Society.

Figures

Fig. 1.
Fig. 1.
CD8+ T cells are the predominant expanded cell type in AA skin. (A) Schematic of scRNAseq experiment. We harvested full-thickness skin from three skin-grafted C3H/HeJ mice with AA and three UG controls and isolated live CD45+ immune cells for scRNAseq (10× Genomics). Individual cDNA libraries were prepared for each sample prior to sequencing. (B) UMAP of scRNAseq data from (A) split across disease condition. Unsupervised clustering of 20,321 cells (9,102 UG; 11,219 AA) after quality control and CCA-based alignment uncovered 15 distinct populations. Note the marked increase in T cell infiltration in AA skin, especially that of CD8+ T cells. (C) Stacked bar plot showing distribution of each cluster relative to the total number of cells per disease condition. (D) Percentage of T cells relative to the total number of sequenced cells, averaged across the three replicates for each disease condition, showing a statistically significant (P = 0.002) increase in T cells in AA skin. Error bars represent SD. (E) Percentage of specific T cell subsets relative to the total number of sequenced cells, averaged across the three replicates for each disease condition, showing a statistically significant (P = 0.00089) increase in CD8+ T cells in AA skin. Error bars represent SD. DCs, dendritic cells; ILC, innate lymphoid cells; Mac, macrophages; Mono, Monocytes; NK, natural killer cells; NKT, natural killer T cells; Treg, regulatory T cells. Significance is indicated as follows: *P < 0.05; **P < 0.01; ***P < 0.001.
Fig. 2.
Fig. 2.
CD8+ T cells are required for disease development and progression in murine AA. (A) Top 10 genes up-regulated in AA-associated CD8+ T cells compared to UG-associated CD8+ T cells in differential gene expression analysis, showing upregulation of genes associated with T cell cytotoxicity and activation such as Ccl5Gzma, and Gzmb. “0” for adjusted P value indicates a near-zero value that was rounded to 0 by the R software. (B) Top 10 GO terms enriched in AA CD8+ T cells as identified by GSEA of differentially expressed genes between AA and UG CD8+ T cells, arranged via descending Normalized Enrichment Score (NES). Shown pathways were enriched in AA CD8+ T cells in a statistically significant manner, with P < 0.05. (C) Treatment of grafted C3H/HeJ mice with anti-CD8β efficiently depleted CD8+ T cells compared to isotype control. (D) Anti-CD8β administration in grafted C3H/HeJ mice prior to hair loss onset prevented AA compared to isotype control. (E) Kaplan–Meier curve for experiment shown in (D). (F) Anti-CD8β administration in grafted C3H/HeJ mice with established disease reversed AA and induced hair regrowth. Those treated with isotype control progressed to total body hair loss. (G) Kaplan–Meier curve for experiment shown in (F). P = 0.0246.
Fig. 3.
Fig. 3.
An effectorness gradient underlies CD8+ T cell heterogeneity in AA skin and identifies a potential trajectory for their differentiation. (A) UMAP of AA CD8+ T cell subsets. Unsupervised re-clustering of AA CD8+ T cells uncovered five subpopulations. (B) Heatmap of top highly expressed genes in each cluster. Cluster 1 showed higher expression of Tcf7, Il7r, Txnip, and Cxcr3; cluster 2 showed upregulation of Ifng, Cd69, Fos, and Jun; cluster 3 was enriched for Gzma, Prf1, Klrc1, and Klrd1; cluster 4 was up-regulated for Vps37b, Crem, Nr4a3, Bcl2a1b; cluster 5 showed higher expression of Crtam, Xcl1, and Tnfrsf9. Interestingly, expression of Klrk1, which encodes NKG2D, was not restricted to a single cluster. (C) Heatmap of scores for signatures of CD8+ T cell subpopulations described in previously published studies. Note that expression of gene signatures varies across clusters on a gradual continuum, as opposed to being exclusive to a particular cluster. (D) Pseudotime trajectory analysis of AA CD8+ T cells, colored by cluster (Top) and by position along pseudotime (Bottom). Pink dashed arrow denotes general direction of inferred differentiation across pseudotime. (E) Expression of select marker genes as identified in Fig. 3B along pseudotime, colored by cluster. (F) Pseudotime values were used to compute effectorness scores for each cell. Effectorness scores overlaid onto the UMAP of AA-associated CD8+ T cells demonstrated a high degree of correlation with the separation of the five CD8+ T cell subsets via unsupervised clustering of their transcriptional profiles, as shown in (A).
Fig. 4.
Fig. 4.
An effectorness gradient underlies CD8+ T cell heterogeneity in human AA skin. (A) UMAP of scRNAseq data obtained from scalp biopsies of 5 AA patients and 2 healthy controls, split across disease condition. Unsupervised clustering of 32,134 cells (21,766 AA; 32,134 CTRL) after quality control and CCA- based alignment uncovered 16 distinct populations. Note the marked increase in T cell infiltration in AA skin. (B) Percentage of T cells relative to the total number of sequenced immune cells, averaged across the replicates for each disease condition, showing a statistically significant (P = 0.002) increase in T cells in AA skin. (C) Percentage of specific T cell subsets relative to the total number of sequenced immune cells, averaged across the replicates for each disease condition. We observed statistically significant increases in the frequency of CD8+ T cells (P = 0.017), CD4+ Treg (P = 0.0051), NK T cells (P = 0.0016) and γδ T cells (P = 0.047) in AA skin. Significance is indicated as follows: *P < 0.05; **P < 0.01; ***P < 0.001. (D) UMAP of AA CD8+ T cell subsets. Unsupervised reclustering of AA CD8+ T cells uncovered two subpopulations. (E) Heatmap showing enriched expression of IL7R and TCF7 in cluster 1, while cluster 2 cells showed enriched expression of HSPA1ACD69IFNGGZMAGZMKPRF1, and XCL1. (F) Pseudotime trajectory analysis of AA CD8+ T cells, colored by cluster (Top Left), position along pseudotime (Bottom Left), Effector signature scores (Top Right), and Resident signature scores (Bottom Right). Pink dashed arrow denotes general direction of inferred differentiation across pseudotime. (G) Expression of select genes as identified in (B) along pseudotime, colored by cluster. (H) Pseudotime values were used to compute effectorness scores for each cell. Effectorness scores overlaid onto the UMAP of AA-associated CD8+ T cells demonstrated a high degree of correlation with the separation of the two CD8+ T cell subsets via unsupervised clustering of their transcriptional profiles, as shown in (D). Error bars represent SD. DS, dermal sheath; Fib, fibroblasts; Lymph, lymphatic vessel; VSM, vascular smooth muscle.

References

    1. Villasante Fricke A. C., Miteva M., Epidemiology and burden of alopecia areata: A systematic review. Clin. Cosmet. Investig. Dermatol. 8, 397–403 (2015). - PMC - PubMed
    1. Jabbari A., Petukhova L., Cabral R. M., Clynes R., Christiano A. M., Genetic basis of alopecia areata: A roadmap for translational research. Dermatol. Clin. 31, 109–117 (2013). - PMC - PubMed
    1. Xing L., et al. , Alopecia areata is driven by cytotoxic T lymphocytes and is reversed by JAK inhibition. Nat. Med. 20, 1043–1049 (2014). - PMC - PubMed
    1. Mackay-Wiggan J., et al. , Oral ruxolitinib induces hair regrowth in patients with moderate-to-severe alopecia areata. JCI Insight 1, e89790 (2016). - PMC - PubMed
    1. Jabbari A., et al. , An open-label pilot study to evaluate the efficacy of tofacitinib in moderate to severe patch-type alopecia areata, totalis, and universalis. J. Invest. Dermatol. 138, 1539–1545 (2018). - PMC - PubMed

Publication types

Supplementary concepts