. 2023 Aug;299(8):104975.
doi: 10.1016/j.jbc.2023.104975. Epub 2023 Jul 8.

NAD metabolism modulates inflammation and mitochondria function in diabetic kidney disease

Affiliations

NAD metabolism modulates inflammation and mitochondria function in diabetic kidney disease

Komuraiah Myakala et al. J Biol Chem. 2023 Aug.

Abstract

Diabetes mellitus is the leading cause of cardiovascular and renal disease in the United -States. Despite the beneficial interventions available for patients with diabetes, there remains a need for additional therapeutic targets and therapies in diabetic kidney disease (DKD). Inflammation and oxidative stress are increasingly recognized as important causes of renal diseases. Inflammation is closely associated with mitochondrial damage. The molecular connection between inflammation and mitochondrial metabolism remains to be elucidated. Recently, nicotinamide adenine nucleotide (NAD+) metabolism has been found to regulate immune function and inflammation. In the present studies, we tested the hypothesis that enhancing NAD metabolism could prevent inflammation in and progression of DKD. We found that treatment of db/db mice with type 2 diabetes with nicotinamide riboside (NR) prevented several manifestations of kidney dysfunction (i.e., albuminuria, increased urinary kidney injury marker-1 (KIM1) excretion, and pathologic changes). These effects were associated with decreased inflammation, at least in part via inhibiting the activation of the cyclic GMP-AMP synthase-stimulator of interferon genes (cGAS-STING) signaling pathway. An antagonist of the serum stimulator of interferon genes (STING) and whole-body STING deletion in diabetic mice showed similar renoprotection. Further analysis found that NR increased SIRT3 activity and improved mitochondrial function, which led to decreased mitochondrial DNA damage, a trigger for mitochondrial DNA leakage which activates the cGAS-STING pathway. Overall, these data show that NR supplementation boosted NAD metabolism to augment mitochondrial function, reducing inflammation and thereby preventing the progression of diabetic kidney disease.

Keywords: NAD; cGAS-STING; diabetic kidney disease; inflammation, diabetes; mitochondria; mitochondrial DNA damage; sirtuin 3.


Conflict of interest statement

Conflict of interest The authors declare that they have no conflicts of interest with the contents of this article.

Figures
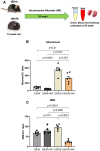
Figure 1
Figure 1
Effect of nicotinamide riboside (NR) treatment on diabetes-induced podocyte and tubular dysfunction.A, experimental scheme for the study with NR treatment. B, urinary albumin and (C) KIM1 normalized to creatinine ratio were measured in 24-h urine. Albumin and KIM1 excretion were significantly increased in db/db compared to non-diabetic db/m mice. Dietary supplementation with NR significantly reduced the urinary excretion of albumin and KIM1. D, PAS-stained images indicating increased PAS-positive area with mesangial matrix expansion, glomeruli size, and pathological changes were suppressed upon NR treatment in db/db mice with unchanged glomerular size. Scalar bar: 50 μm. E and F, immunofluorescence images indicating the collagen IV and fibronectin fluorescence signals were increased in db/db kidney and reduced significantly in NR-treated mice. Scalar bar: 100 μm. G, TGFβ, PAI1, CTGF, and αSMA mRNA levels were higher in the db/db kidneys. TGFβ, PAI1, and αSMA mRNA levels were significantly decreased upon NR treatment. H, immunochemistry images of podocyte positive marker p57 are markedly reduced in the kidney of db/db mice, and depletion was prevented upon NR treatment. p57-positive areas were quantified per each glomerulus of the kidney section. n = 6 to 8 per group, values presented as mean ± SEM with variance is calculated using one-way ANOVA. Scalar bar: 25 μm. I, representative SEM images of glomerular basement membrane (GBM) thickening with quantification showing an increased GBM thickness in the db/db kidney, which was normalized with NR treatment. Arrows indicate the GBM. Scale bars 1 um. Magnifications × 35,000. n = 3 per group. J, TEM images demonstrate the normal structure of podocyte foot processes (arrows) in db/m controls and db/m treated with NR. db/db mice showed podocyte foot processes effacement (arrow) and reduction in filtration slits frequency. Scale bars 500 nm. Magnifications × 80,000. The graphs show the widening of podocyte foot processes, a reduction in filtration slit frequency in db/db, and amelioration of those parameters in DB/DB with NR treatment. n = 3 per group.
Figure 1
Figure 1
Effect of nicotinamide riboside (NR) treatment on diabetes-induced podocyte and tubular dysfunction.A, experimental scheme for the study with NR treatment. B, urinary albumin and (C) KIM1 normalized to creatinine ratio were measured in 24-h urine. Albumin and KIM1 excretion were significantly increased in db/db compared to non-diabetic db/m mice. Dietary supplementation with NR significantly reduced the urinary excretion of albumin and KIM1. D, PAS-stained images indicating increased PAS-positive area with mesangial matrix expansion, glomeruli size, and pathological changes were suppressed upon NR treatment in db/db mice with unchanged glomerular size. Scalar bar: 50 μm. E and F, immunofluorescence images indicating the collagen IV and fibronectin fluorescence signals were increased in db/db kidney and reduced significantly in NR-treated mice. Scalar bar: 100 μm. G, TGFβ, PAI1, CTGF, and αSMA mRNA levels were higher in the db/db kidneys. TGFβ, PAI1, and αSMA mRNA levels were significantly decreased upon NR treatment. H, immunochemistry images of podocyte positive marker p57 are markedly reduced in the kidney of db/db mice, and depletion was prevented upon NR treatment. p57-positive areas were quantified per each glomerulus of the kidney section. n = 6 to 8 per group, values presented as mean ± SEM with variance is calculated using one-way ANOVA. Scalar bar: 25 μm. I, representative SEM images of glomerular basement membrane (GBM) thickening with quantification showing an increased GBM thickness in the db/db kidney, which was normalized with NR treatment. Arrows indicate the GBM. Scale bars 1 um. Magnifications × 35,000. n = 3 per group. J, TEM images demonstrate the normal structure of podocyte foot processes (arrows) in db/m controls and db/m treated with NR. db/db mice showed podocyte foot processes effacement (arrow) and reduction in filtration slits frequency. Scale bars 500 nm. Magnifications × 80,000. The graphs show the widening of podocyte foot processes, a reduction in filtration slit frequency in db/db, and amelioration of those parameters in DB/DB with NR treatment. n = 3 per group.
Figure 2
Figure 2
Effect of NR treatment on markers related to oxidative stress in diabetic mice.A, urinary thiobarbituric acid reactive substances (TBARS) and (B) NADPH oxidase 4 (NOX4) mRNA levels were significantly higher in db/db mice and NR treatment prevented increases in TBARS and NOX4 mRNA. C, Western blot analysis showing 4-hydroxynonenal (4-HNE) protein expression levels were upregulated and abrogated upon NR treatment in the kidney of db/db mice. n = 6 per group, values presented as mean ± SEM with variance is calculated using one-way ANOVA.
Figure 3
Figure 3
Effect of NR treatment on inflammation in the kidney of db/db mice.A, the inflammatory cytokine markers MCP-1, TNFα, IL-6, TIMP1, and CD68 transcript levels were significantly higher in db/db mice. Also, TLR2 an innate immune response marker increased in db/db mice. NR treatment successfully prevented their increases. Immunofluorescence microscopic images. B, CD45 stained in green, phalloidin as red (scalar bar: 100 μm), and (C and D) CD68 stained in green showing the infiltration of immune cells in the glomeruli (C) or tubulointerstitum (D) of db/db kidney which was prevented in the NR-treated db/db mice (scalar bar: 50 μm). n = 5 to 6 per group, values presented as mean ± SEM with variance is calculated using one-way ANOVA.
Figure 3
Figure 3
Effect of NR treatment on inflammation in the kidney of db/db mice.A, the inflammatory cytokine markers MCP-1, TNFα, IL-6, TIMP1, and CD68 transcript levels were significantly higher in db/db mice. Also, TLR2 an innate immune response marker increased in db/db mice. NR treatment successfully prevented their increases. Immunofluorescence microscopic images. B, CD45 stained in green, phalloidin as red (scalar bar: 100 μm), and (C and D) CD68 stained in green showing the infiltration of immune cells in the glomeruli (C) or tubulointerstitum (D) of db/db kidney which was prevented in the NR-treated db/db mice (scalar bar: 50 μm). n = 5 to 6 per group, values presented as mean ± SEM with variance is calculated using one-way ANOVA.
Figure 4
Figure 4
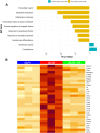
NR treatment inhibit the cGAS-STING activation in the kidney of db/db mice.A and B, transcriptome and (C) proteomic analysis of the kidney indicating the differentially regulated pathways in the kidneys. D, transcriptomic analysis found IFITM genes which belong to interferon-stimulated genes (ISG) were upregulated in db/db kidneys and inhibited by NR treatment. E, cGAS mRNA and Sting mRNA and proteins levels were increased in db/db mice, and NR treatment decreased their levels. Downstream of cGAS-Sting singling proteins, the active form of (F) phosphorylated TBK1, (G) phosphorylated IRF3, (H) phosphorylated Stat3, (I) phosphorylated p65 protein abundance were increased in db/db mice and normalized upon NR treatment, although total p65 levels were unchanged. Immunohistochemistry indicating (J) Sting protein expression was increased in the kidney of humans with diabetes. Scalar bar: 50 um (except top right panel which is 100 um). K, similar to humans, Sting expression levels were increased in glomeruli and interstitial kidney of db/db mice and reduced with NR treatment (scalar bar: 50 um). The Western blot images were quantified and normalized to the total protein or phosphorylated active form divided by inactive total protein as loading control. n = 5 to 6 per group, values presented as mean ± SEM with variance is calculated using one-way ANOVA.
Figure 4
Figure 4
NR treatment inhibit the cGAS-STING activation in the kidney of db/db mice.A and B, transcriptome and (C) proteomic analysis of the kidney indicating the differentially regulated pathways in the kidneys. D, transcriptomic analysis found IFITM genes which belong to interferon-stimulated genes (ISG) were upregulated in db/db kidneys and inhibited by NR treatment. E, cGAS mRNA and Sting mRNA and proteins levels were increased in db/db mice, and NR treatment decreased their levels. Downstream of cGAS-Sting singling proteins, the active form of (F) phosphorylated TBK1, (G) phosphorylated IRF3, (H) phosphorylated Stat3, (I) phosphorylated p65 protein abundance were increased in db/db mice and normalized upon NR treatment, although total p65 levels were unchanged. Immunohistochemistry indicating (J) Sting protein expression was increased in the kidney of humans with diabetes. Scalar bar: 50 um (except top right panel which is 100 um). K, similar to humans, Sting expression levels were increased in glomeruli and interstitial kidney of db/db mice and reduced with NR treatment (scalar bar: 50 um). The Western blot images were quantified and normalized to the total protein or phosphorylated active form divided by inactive total protein as loading control. n = 5 to 6 per group, values presented as mean ± SEM with variance is calculated using one-way ANOVA.
Figure 5
Figure 5
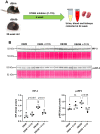
Effects of STING inhibitor C176 or STING knockout (KO) on the inflammatory response and kidney function in db/db and streptozotocin (STZ) induced diabetic mice.A, experimental scheme for the study with C176 treatment. B, total and phosphorylated IRF3 protein levels were decreased significantly in db/db mice treated with C176. C, phosphorylated Stat3 protein levels were higher in db/db mice and C176 treatment decreased their levels. IL1-β mRNA levels increased in the kidney and decreased with C176 treatment in db/db compared to control db/m mice. D, experimental scheme for the study with STING KO mice. E, sting protein levels were significantly increased in wild-type (WT) mice with STZ-induced diabetes and markedly decreased in Sting KO mice made diabetic with STZ. F, urinary albumin/creatinine and urinary KIM1/creatinine ratio were increased significantly in wild-type mice with STZ-induced diabetes, and they were markedly reduced in the Sting KO mice made diabetic with STZ. G, phosphorylation of stat3 protein levels were higher in the kidney of WT mice with STZ-induced diabetes and normalized in STZ-induced diabetic Sting KO mice. N = 4 to 6 per group, values presented as mean ± SEM with variance is calculated using one-way ANOVA.
Figure 5
Figure 5
Effects of STING inhibitor C176 or STING knockout (KO) on the inflammatory response and kidney function in db/db and streptozotocin (STZ) induced diabetic mice.A, experimental scheme for the study with C176 treatment. B, total and phosphorylated IRF3 protein levels were decreased significantly in db/db mice treated with C176. C, phosphorylated Stat3 protein levels were higher in db/db mice and C176 treatment decreased their levels. IL1-β mRNA levels increased in the kidney and decreased with C176 treatment in db/db compared to control db/m mice. D, experimental scheme for the study with STING KO mice. E, sting protein levels were significantly increased in wild-type (WT) mice with STZ-induced diabetes and markedly decreased in Sting KO mice made diabetic with STZ. F, urinary albumin/creatinine and urinary KIM1/creatinine ratio were increased significantly in wild-type mice with STZ-induced diabetes, and they were markedly reduced in the Sting KO mice made diabetic with STZ. G, phosphorylation of stat3 protein levels were higher in the kidney of WT mice with STZ-induced diabetes and normalized in STZ-induced diabetic Sting KO mice. N = 4 to 6 per group, values presented as mean ± SEM with variance is calculated using one-way ANOVA.
Figure 6
Figure 6
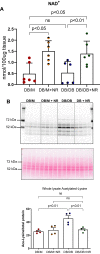
Effect of NR treatment on NAD+levels, SIRT3 expression, and activity in the kidney as well as expression of total acetylated proteins in the kidney of SIRT3 KO mice.A, NAD+ levels were measured in the kidney and comparable in both db/m and db/db mice. 1-methyl-nicotinamide was measured with metabolomics. NR treatment increased NAD+ level and 1-methyl-nicotinamide levels in both groups. B and C, acetylated-lysine protein expression levels in total kidney lysates and mitochondrial fractions were increased in db/db mice and NR supplementation decreased its abundance. D, SIRT3 protein abundance in whole tissue lysate, and (E) SIRT3 enzyme activity in mitochondrial fraction were reduced significantly in db/db kidney, and reduction was prevented upon NR treatment. In human diabetic kidneys (F) immunohistochemical (IHC) staining shows the SIRT3 protein abundance is significantly lower compared to non-diabetic human kidneys. Scalar bar: 60 um. G, SIRT1 protein abundance in kidney lysate was not changed in db/db mice. H, histology quantification of nuclear Sirt1 expression levels were unchanged between non-diabetic and diabetic human kidneys (scalar bar: 100 um). Western blot analysis of kidney mitochondrial lysates showing increased (I) protein expression levels of total acetylated lysine and acetylated superoxide dismutase 2 (SOD2) and isocitrate dehydrogenase 2 (IDH2) in the kidney of SIRT3 KO mice. In total kidney lysates, the abundance of (J) acetylated SOD2 and (K) acetylated IDH2 was increased in db/db mice and prevented in mice treated with NR. n = 6 per group, values presented as mean ± SEM with variance is calculated using one-way ANOVA.
Figure 6
Figure 6
Effect of NR treatment on NAD+levels, SIRT3 expression, and activity in the kidney as well as expression of total acetylated proteins in the kidney of SIRT3 KO mice.A, NAD+ levels were measured in the kidney and comparable in both db/m and db/db mice. 1-methyl-nicotinamide was measured with metabolomics. NR treatment increased NAD+ level and 1-methyl-nicotinamide levels in both groups. B and C, acetylated-lysine protein expression levels in total kidney lysates and mitochondrial fractions were increased in db/db mice and NR supplementation decreased its abundance. D, SIRT3 protein abundance in whole tissue lysate, and (E) SIRT3 enzyme activity in mitochondrial fraction were reduced significantly in db/db kidney, and reduction was prevented upon NR treatment. In human diabetic kidneys (F) immunohistochemical (IHC) staining shows the SIRT3 protein abundance is significantly lower compared to non-diabetic human kidneys. Scalar bar: 60 um. G, SIRT1 protein abundance in kidney lysate was not changed in db/db mice. H, histology quantification of nuclear Sirt1 expression levels were unchanged between non-diabetic and diabetic human kidneys (scalar bar: 100 um). Western blot analysis of kidney mitochondrial lysates showing increased (I) protein expression levels of total acetylated lysine and acetylated superoxide dismutase 2 (SOD2) and isocitrate dehydrogenase 2 (IDH2) in the kidney of SIRT3 KO mice. In total kidney lysates, the abundance of (J) acetylated SOD2 and (K) acetylated IDH2 was increased in db/db mice and prevented in mice treated with NR. n = 6 per group, values presented as mean ± SEM with variance is calculated using one-way ANOVA.
Figure 7
Figure 7
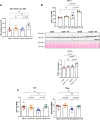
Effect of NR treatment on mitochondria in the kidney of diabetic db/db mice.A, mitochondrial DNA/nuclear DNA ratio was unchanged in db/db mice and NR supplementation increased the ratio of mito DNA. B, mRNA and protein expression levels of PGC1a a master regulator of mitochondrial biogenesis was increased with NR treatment in db/db mice though there is comparable differences between db/m and db/db mice. C, mRNA levels of Nrf2 and Tfam were decreased in db/db mice and prevented the decreasing upon NR treatment. D, complex 1 and III subunits Ndufa4 and Uqcrc2 mRNA levels were reduced significantly in db/db kidney and reduction was inhibited with NR treatment. Complex IV subunit Cox6a2 mRNA levels were increased in both db/m and db/db kidney with NR supplementation. E, complex 1 enzyme activity was markedly decreased in db/db mice and reversed in response to NR treatment. In addition, complex IV activity was also increased by NR treatment in db/db mice. F, representative electron microscopy images showing mitochondria morphology in proximal tubule cells. SEM images in db/db mice show a chaotic mitochondrial distribution and damaged mitochondria in db/db mice and an improvement with NR treatment. Scale bars 1 um. Magnifications 35,000. Higher magnification of TEM images shows normal cristae organization (arrow) in db/m mice and damage to the mitochondria in db/db mice such as cristae fragmentation (red arrow), cristae homogenization (blue arrow) in swollen electron-lucent matrix (asterisk) and ruptured outer membrane (black arrow). NR treatment of db/db mice resulted in the normalization of mitochondrial structure similar to the control (arrows). Scale bars 500 nm. Magnifications 50,000. The graphs show the percentage of mitochondria volume, mitochondria size <0.2 um, and mitochondrial types in db/m and db/db and NR treated mice. n = 3 per group. G, the fatty acid β-oxidation enzymes Cpt1a, Lcad mRNA, and Mcad mRNA and protein levels were increased with NR administration in db/db mice. H, lipidomics data showed increased triglycerides species in db/db kidneys and NR reduced the increase. I, mitochondrial DNA (mtDNA) damage markedly increased in db/db mice and damage was prevented by NR. n = 5 to 6 per group, values presented as mean ± SEM with variance is calculated using one-way ANOVA (except in F where two-way ANOVA was used).
Figure 7
Figure 7
Effect of NR treatment on mitochondria in the kidney of diabetic db/db mice.A, mitochondrial DNA/nuclear DNA ratio was unchanged in db/db mice and NR supplementation increased the ratio of mito DNA. B, mRNA and protein expression levels of PGC1a a master regulator of mitochondrial biogenesis was increased with NR treatment in db/db mice though there is comparable differences between db/m and db/db mice. C, mRNA levels of Nrf2 and Tfam were decreased in db/db mice and prevented the decreasing upon NR treatment. D, complex 1 and III subunits Ndufa4 and Uqcrc2 mRNA levels were reduced significantly in db/db kidney and reduction was inhibited with NR treatment. Complex IV subunit Cox6a2 mRNA levels were increased in both db/m and db/db kidney with NR supplementation. E, complex 1 enzyme activity was markedly decreased in db/db mice and reversed in response to NR treatment. In addition, complex IV activity was also increased by NR treatment in db/db mice. F, representative electron microscopy images showing mitochondria morphology in proximal tubule cells. SEM images in db/db mice show a chaotic mitochondrial distribution and damaged mitochondria in db/db mice and an improvement with NR treatment. Scale bars 1 um. Magnifications 35,000. Higher magnification of TEM images shows normal cristae organization (arrow) in db/m mice and damage to the mitochondria in db/db mice such as cristae fragmentation (red arrow), cristae homogenization (blue arrow) in swollen electron-lucent matrix (asterisk) and ruptured outer membrane (black arrow). NR treatment of db/db mice resulted in the normalization of mitochondrial structure similar to the control (arrows). Scale bars 500 nm. Magnifications 50,000. The graphs show the percentage of mitochondria volume, mitochondria size <0.2 um, and mitochondrial types in db/m and db/db and NR treated mice. n = 3 per group. G, the fatty acid β-oxidation enzymes Cpt1a, Lcad mRNA, and Mcad mRNA and protein levels were increased with NR administration in db/db mice. H, lipidomics data showed increased triglycerides species in db/db kidneys and NR reduced the increase. I, mitochondrial DNA (mtDNA) damage markedly increased in db/db mice and damage was prevented by NR. n = 5 to 6 per group, values presented as mean ± SEM with variance is calculated using one-way ANOVA (except in F where two-way ANOVA was used).

References

    1. Sedor J.R., Freedman B.I. Biologic underpinnings of type 1 diabetic kidney disease. J. Am. Soc. Nephrol. 2019;30:1782–1783. - PMC - PubMed
    1. Thomas M.C., Cooper M.E., Zimmet P. Changing epidemiology of type 2 diabetes mellitus and associated chronic kidney disease. Nat. Rev. Nephrol. 2016;12:73–81. - PubMed
    1. Breyer M.D., Coffman T.M., Flessner M.F., Fried L.F., Harris R.C., Ketchum C.J., et al. Diabetic nephropathy: a national dialogue. Clin. J. Am. Soc. Nephrol. 2013;8:1603–1605. - PMC - PubMed
    1. Boyle J.P., Thompson T.J., Gregg E.W., Barker L.E., Williamson D.F. Projection of the year 2050 burden of diabetes in the US adult population: dynamic modeling of incidence, mortality, and prediabetes prevalence. Popul. Health Metr. 2010;8:29. - PMC - PubMed
    1. Reidy K., Kang H.M., Hostetter T., Susztak K. Molecular mechanisms of diabetic kidney disease. J. Clin. Invest. 2014;124:2333–2340. - PMC - PubMed

Publication types

MeSH terms