. 2023 Sep:75:101767.
doi: 10.1016/j.molmet.2023.101767. Epub 2023 Jul 8.

Ube4A maintains metabolic homeostasis and facilitates insulin signaling in vivo

Affiliations

Ube4A maintains metabolic homeostasis and facilitates insulin signaling in vivo

Sandip Mukherjee et al. Mol Metab. 2023 Sep.

Abstract

Objective: Defining the regulators of cell metabolism and signaling is essential to design new therapeutic strategies in obesity and NAFLD/NASH. E3 ubiquitin ligases control diverse cellular functions by ubiquitination-mediated regulation of protein targets, and thus their functional aberration is associated with many diseases. The E3 ligase Ube4A has been implicated in human obesity, inflammation, and cancer. However, its in vivo function is unknown, and no animal models are available to study this novel protein.

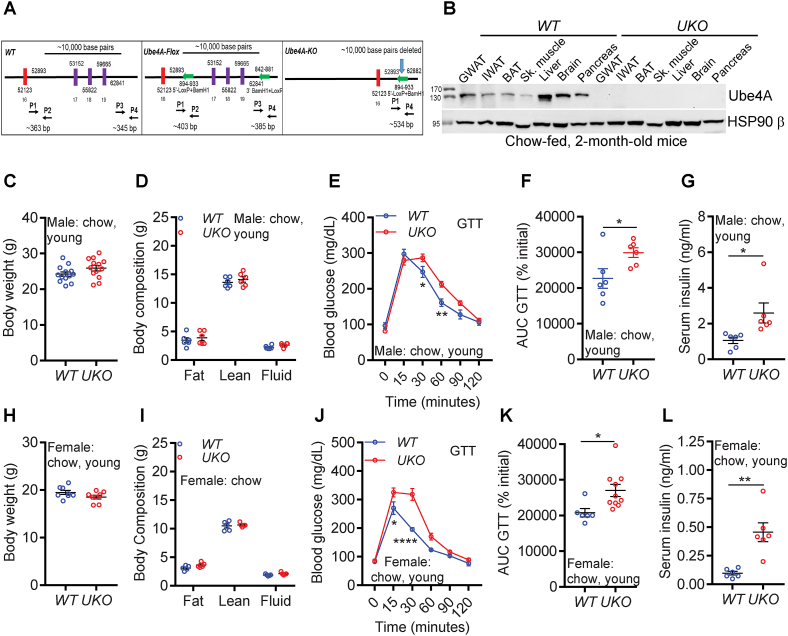
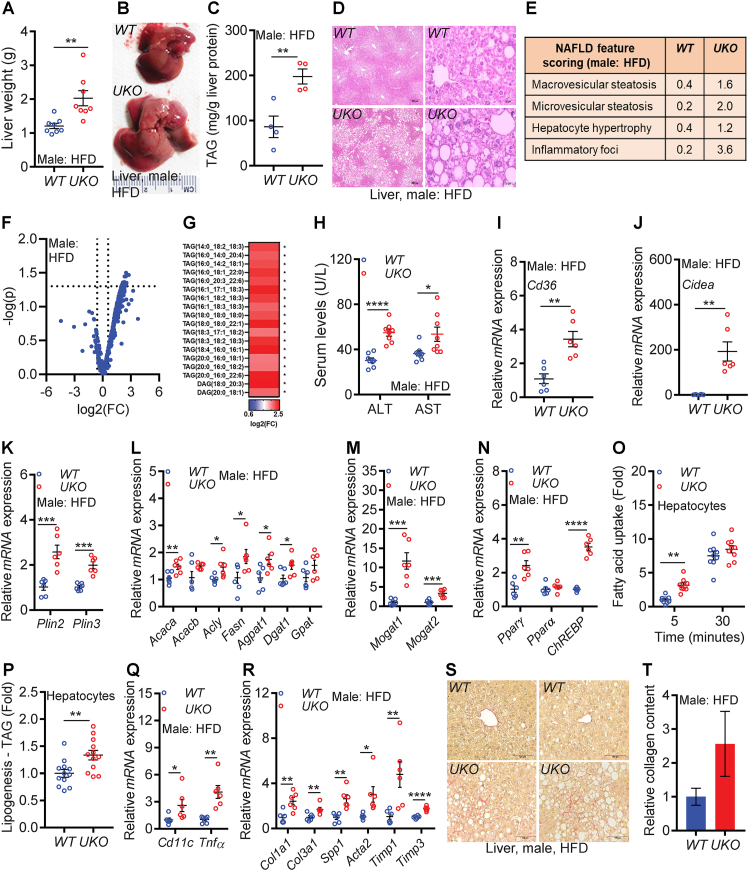
Methods: A whole-body Ube4A knockout (UKO) mouse model was generated, and various metabolic parameters were compared in chow- and high fat diet (HFD)-fed WT and UKO mice, and in their liver, adipose tissue, and serum. Lipidomics and RNA-Seq studies were performed in the liver samples of HFD-fed WT and UKO mice. Proteomic studies were conducted to identify Ube4A's targets in metabolism. Furthermore, a mechanism by which Ube4A regulates metabolism was identified.

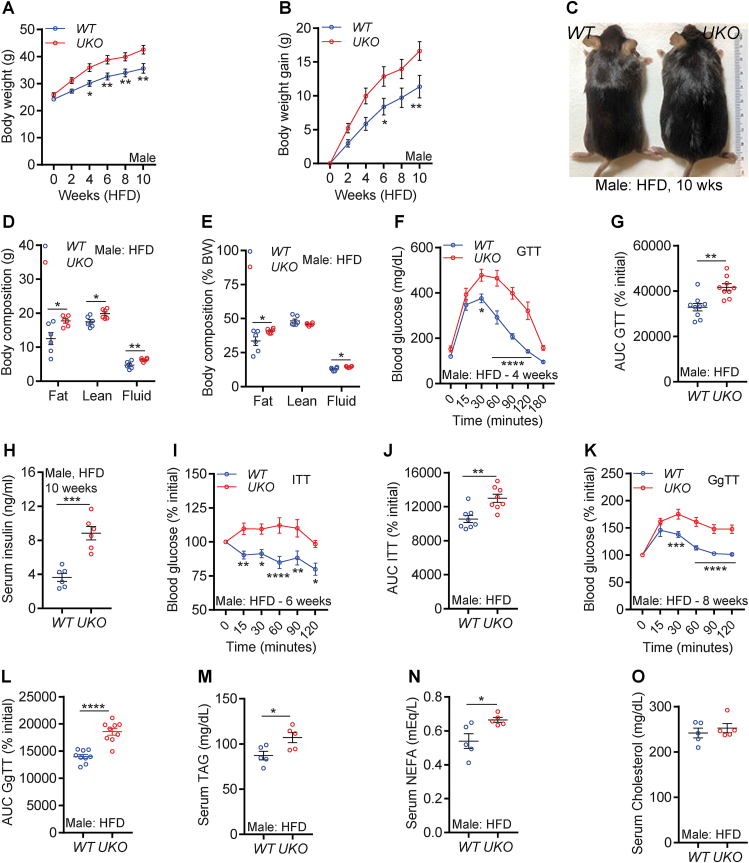
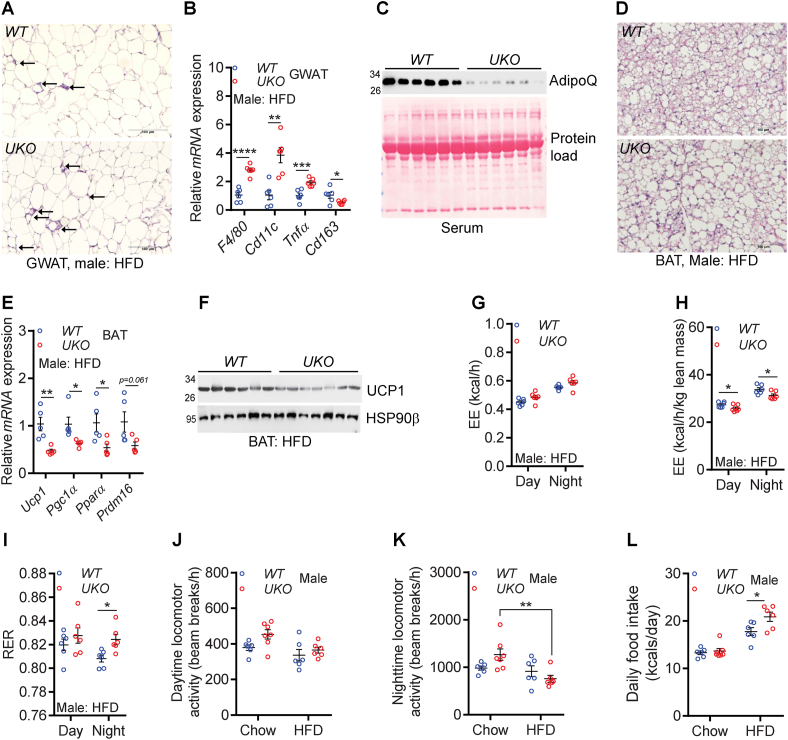
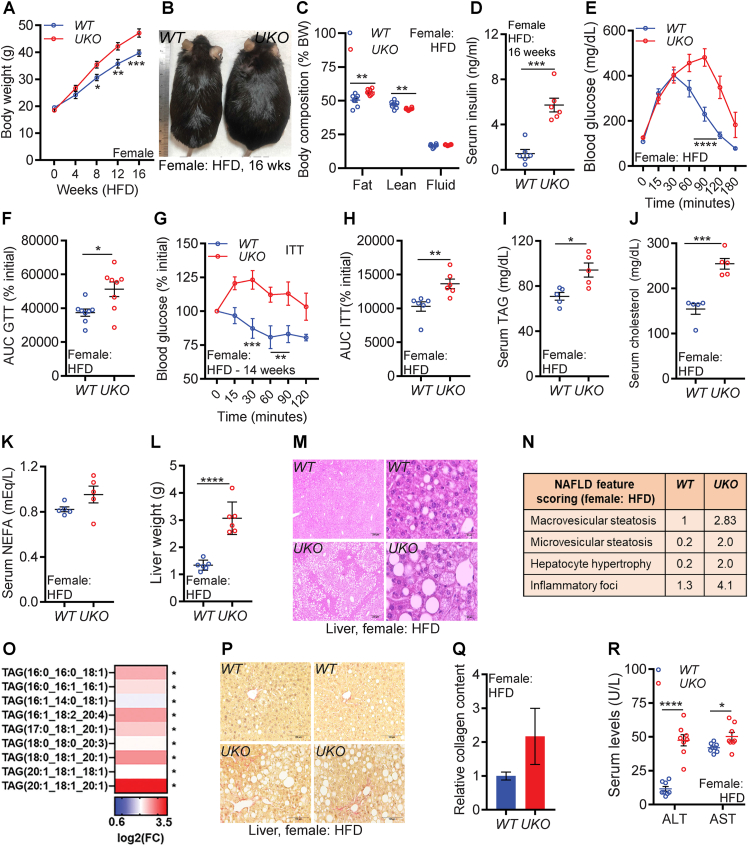
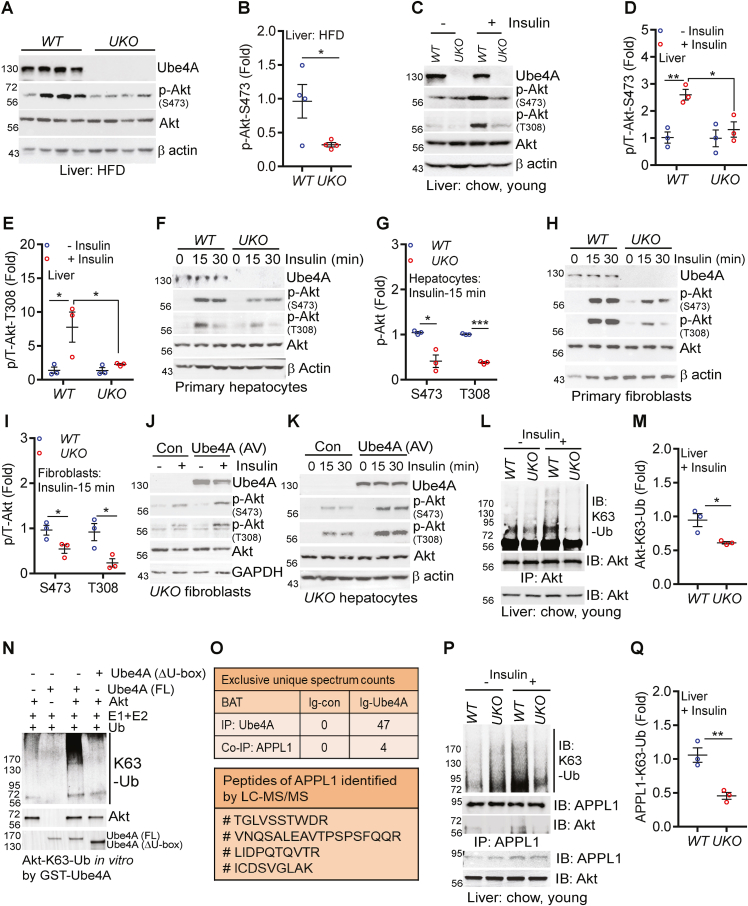
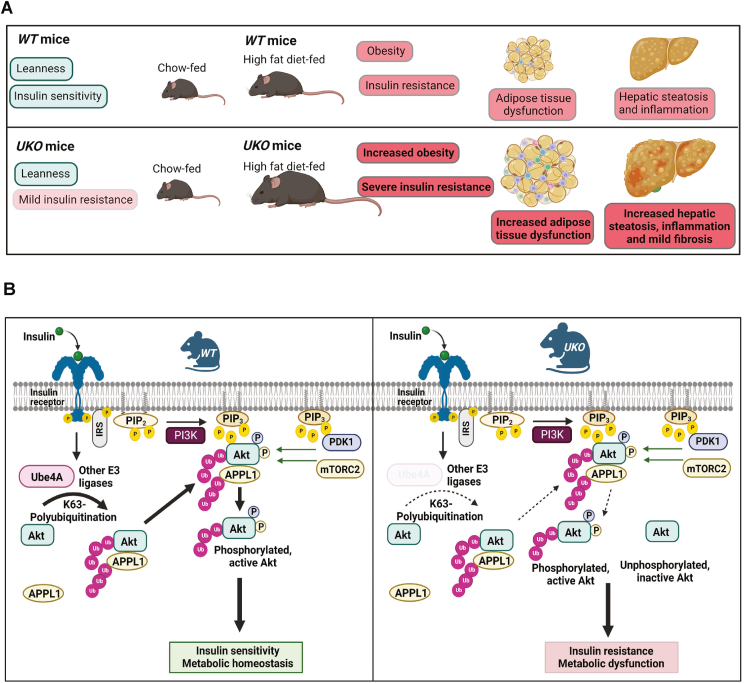
Results: Although the body weight and composition of young, chow-fed WT and UKO mice are similar, the knockouts exhibit mild hyperinsulinemia and insulin resistance. HFD feeding substantially augments obesity, hyperinsulinemia, and insulin resistance in both sexes of UKO mice. HFD-fed white and brown adipose tissue depots of UKO mice have increased insulin resistance and inflammation and reduced energy metabolism. Moreover, Ube4A deletion exacerbates hepatic steatosis, inflammation, and liver injury in HFD-fed mice with increased lipid uptake and lipogenesis in hepatocytes. Acute insulin treatment resulted in impaired activation of the insulin effector protein kinase Akt in liver and adipose tissue of chow-fed UKO mice. We identified the Akt activator protein APPL1 as a Ube4A interactor. The K63-linked ubiquitination (K63-Ub) of Akt and APPL1, known to facilitate insulin-induced Akt activation, is impaired in UKO mice. Furthermore, Ube4A K63-ubiquitinates Akt in vitro.

Conclusion: Ube4A is a novel regulator of obesity, insulin resistance, adipose tissue dysfunction and NAFLD, and preventing its downregulation may ameliorate these diseases.

Keywords: APPL1; Insulin/Akt signaling; NAFLD; Obesity; Ube4A; Ubiquitination.


Conflict of interest statement

Declaration of competing interest B.T. has been an advisor or consultant for Alimentiv, Allergan, Allysta, Alnylam, Amgen, Arrowhead, Axcella, Boehringer Ingelheim, BMS, Coherus, Cymabay, Enanta, Fortress, Genfit, Gilead, High Tide, HistoIndex, Innovo, Intercept, Ionis, LG Chem, Lipocine, Madrigal, Medimmune, Merck, Mirum, NGM, NovoNordisk, Novus Therapeutics, pHPharma, Sagimet, Target RWE, 89Bio; he has stock options in HepGene; he has institutional research grants from Allergan, BMS, Cirius, Enanta, Genfit, Gilead, Intercept, Madrigal, NGM. B.N.F is a shareholder and a member of the Scientific Advisory Board for Cirius Therapeutics. The other authors do not have any conflict of interest.

Figures

Figure 1
Figure 1
Ube4A deletion does not alter body weight but causes mild insulin resistance in young, chow-fed mice. A. CRISPR/Cas9-mediated targeting of the U-Box and part of the 3′-UTR of the Ube4A locus in the mouse chromosome 9. B. Expression levels of the Ube4A protein in tissues of young, chow-fed, WT and UKO mice. Figure represents data from N = 3 mice. C. Body weight of young, chow-fed male mice (n = 13/cohort). D. Body composition of young, chow-fed male mice (n = 6/cohort). E. Raw values of the GTT in young, chow-fed male mice (n = 6/cohort). F. Area under curve (AUC) values of the GTT (% initial) (n = 6/cohort). G. Serum insulin levels in 5 h-fasted, young, chow-fed male mice (N = 6/cohort). H. Body weight of young, chow-fed female mice (n = 8/cohort). I. Body composition (fat, lean and fluid mass) of young, chow-fed female mice (n = 5/cohort). J. Raw values of the GTT in young, chow-fed female mice (n = 6–10/cohort). K. AUC values of the GTT (% initial) in young, chow-fed female mice (n = 6–10/cohort). L. Serum insulin levels in 5 h-fasted young, chow-fed female mice (N = 6/cohort).
Figure 2
Figure 2
Ube4A deletion augments HFD-induced obesity and insulin resistance in male mice. A-B. Weekly body weight and weight gain of HFD-fed male mice (n = 13/cohort). C. Representative image of HFD-fed male mice after conclusion of the study. D-E. Total and percent (over total body weight) body composition of HFD-fed male mice (N = 6/cohort). F. Raw values of the GTT in HFD-fed male mice (n = 9/cohort). GTT was performed in 4-week-HFD-fed mice. E. AUC values of the rate (percent of 0 time point) of decrease in blood glucose levels in a GTT in HFD-fed male mice (n = 9/cohort). G. Serum insulin levels in 5 h-fasted male mice after 10-week of HFD feeding (n = 6/cohort). H. Rate (percent of 0 time point) of decrease in blood glucose levels in an insulin tolerance test (ITT) in HFD-fed male mice (n = 8/cohort). ITT was performed in 6-week-HFD-fed mice. I. AUC values of the ITT presented in Figure 2H (n = 9/cohort). sJ. Rate (percent of 0 time point) of increase in blood glucose levels in a glucagon tolerance test (GgTT) in HFD-fed male mice (n = 9/cohort). GgTT was performed in 8-week-HFD-fed mice. K. AUC values of the GgTT presented in Figure 2J (n = 9/cohort). L-N. Serum levels of TAG, NEFA and total cholesterol in HFD-fed male mice. The number of mice (n) used are presented as individual datapoints. Mean ± s.e.m. shown within dot plots. For multiple comparisons, two-way ANOVA with Holm-Šidák multiple comparison test and for two independent data sets, Two-tailed unpaired Student's t-test. ∗P < 0.05, ∗∗P < 0.01, ∗∗∗P < 0.001, ∗∗∗∗P < 0.0001.
Figure 3
Figure 3
Ube4A deletion exacerbates HFD-induced hepatic steatosis and liver injury in male mice with increased fatty acid uptake, lipogenesis, and lipid droplet stabilization. A. Weight of liver in HFD-fed male mice (N = 8/cohort). B. Representative image of liver of HFD-fed male mice. C. Liver triglyceride (TAG) levels in HFD-fed male mice (N = 4/cohort). D. Representative images of liver histology in HFD-fed male mice. Images were taken at 4X (left panel, scale bar: 250 μm) and 40X (right panel, scale bar: 25 μm) magnifications. E. Average values of NAFLD feature scores in HFD-fed male mouse livers (N = 5/cohort). F. Volcano plot from the lipidomics study in HFD-fed male mouse livers (N = 5/cohort). G. Species of TAG and DAG in HFD-fed male WT and UKO livers (N = 5/cohort). H. Serum levels of AST and ALT in HFD-fed male mice (N = 8/cohort). I–N. Relative mRNA expression of lipogenic genes and transcription factors in HFD-fed male mice (N = 6/cohort). O. Uptake of [3H]-oleate in hepatocytes under basal conditions (N = 4, experimental replicates from N = 3 male mice/cohort). P. Incorporation of [3H]-palmitate into TAG in hepatocytes (N = 12 experimental replicates from N = 4 male mice/cohort). Q-R. Inflammatory and fibrogenic gene expression in HFD-fed male mice (N = 6/cohort). S-T. Representative images (20X, scale bar: 100 μM) of Sirius-Red staining in HFD-fed mouse livers. For quantification, the mean value of WT was set as 1 (n = 5/cohort). The number of mice (n) are presented as individual datapoints. Mean ± s.e.m. shown within dot plots. For multiple comparisons, two-way ANOVA with Holm-Šidák multiple comparison test and for two independent data sets, Two-tailed unpaired Student's t-test. ∗P < 0.05, ∗∗P < 0.01, ∗∗∗P < 0.001, ∗∗∗∗P < 0.0001.
Figure 4
Figure 4
HFD-fed male UKO mice exhibit increased adipose tissue metabolic dysfunction. A. Representative histological images (20X, scale bar: 100 μm) of GWAT of HFD-fed mice. Arrows indicate crown-like structures. B. Relative mRNA levels of M1 and M2 macrophage markers in the GWAT of HFD-fed male mice (N = 6/cohort). C. Serum AdipoQ levels in HFD-fed male mice (N = 6/cohort). Serum samples were denatured and run on a denatured SDS-PAGE to detect monomeric AdipoQ. D. Representative histological images (20X, scale bar: 100 μm) of HFD-fed mouse BAT. E. Relative mRNA expression of the thermogenic machinery in the BAT of HFD-fed male mice (N = 5–6/cohort). F. Levels of UCP1 protein in the BAT of HFD-fed male mice (N = 6–7/cohort). G. EE (whole mouse) in HFD-fed mice (N = 6/cohort). H. EE (normalized by lean mass) in HFD-fed mice (N = 6/cohort). I. RER in HFD-fed mice (N = 6/cohort). J-K. Average daytime and nighttime activity in chow- and HFD-fed mice (N = 6–7/cohort). L. Average daily caloric intake in chow- and HFD-fed mice (N = 6–7/cohort). The number of mice (n) used are presented as individual datapoints. Mean ± s.e.m. shown within dot plots. For multiple comparisons, two-way ANOVA with Holm-Šidák multiple comparison test and for two independent data sets, Two-tailed unpaired Student's t-test. ∗P < 0.05, ∗∗P < 0.01, ∗∗∗P < 0.001, ∗∗∗∗P < 0.0001.
Figure 5
Figure 5
In female UKO mice, HFD feeding aggravates obesity, insulin resistance, hepatic steatosis, and liver injury. A. Weekly body weight in female mice (n = 8/cohort). B. Representative image of HFD-fed mice. C. Percent body composition of mice after 16 weeks of HFD-feeding (n = 6/cohort). D. Serum insulin levels in 5 h-fasted mice after 16 weeks of HFD-feeding (n = 6/cohort). E. Raw values of the GTT in HFD-fed mice (n = 8/cohort). GTT was performed in 12-week-HFD-fed mice. F. AUC values of the GTT (% initial) in HFD-fed mice (n = 8/cohort). G. Rate (percent of 0 time point) of decrease in blood glucose levels in an ITT in HFD-fed mice (n = 6/cohort). ITT was performed in 14-week-HFD-fed mice. H. AUC values of the ITT presented in Figure 5G (n = 6/cohort). I–K. Serum levels of TAG, NEFA and total cholesterol and in HFD-fed mice (n = 5/cohort). L. Weight of liver in HFD-fed mice (n = 6/cohort). M. Representative images of liver histology from HFD-fed mice. Images were taken at 4X (left panel, scale bar: 250 μm) and 40X (right panel, scale bar: 25 μm) magnifications. N. Average values of NAFLD feature scores in HFD-fed mouse livers (N = 5/cohort). O. Species of TAG in HFD-fed mouse livers (N = 5/cohort). P-Q. Representative images (20X, scale bar: 100 μM) of Sirius-Red staining in HFD-fed mouse livers. For quantification, the mean value of WT was set as 1 (n = 5/cohort). R. Serum levels of AST and ALT in HFD-fed mice (N = 8/cohort). The number of mice (n) used are presented as individual datapoints. Mean ± s.e.m. shown within dot plots. For multiple comparisons, two-way ANOVA with Holm-Šidák multiple comparison test and for two independent data sets, Two-tailed unpaired Student's t-test. ∗P < 0.05, ∗∗P < 0.01, ∗∗∗P < 0.001, ∗∗∗∗P < 0.0001.
Figure 6
Figure 6
Ube4A mediates insulin signaling via K63-Ub of Akt and APPL1. A-B. Stimulatory phosphorylation (S473) of Akt in the liver of HFD-fed mice (N = 4/cohort). C-E. Acute insulin-induced stimulatory phosphorylation of Akt (S473 and T308) in the liver of young, chow-fed mice. Quantification of 3 independent experiments is shown. F-G. Acute insulin-induced stimulatory phosphorylation of Akt (S473 and T308) in hepatocytes in vitro. Quantification of 3 independent experiments is shown. H–I. Acute insulin-induced stimulatory phosphorylation of Akt (S473 and T308) in primary fibroblasts in vitro. Quantification of 3 independent experiments is shown. J-K. Effects of adenovirus (AV)-mediated overexpression of Ube4A on acute insulin-induced stimulatory phosphorylation of Akt (S473 and T308) in primary fibroblasts and hepatocytes. In fibroblasts, the Akt-T308 antibody detected a non-specific band at a lower molecular weight, which did not respond to insulin. L-M. K63-Ub of Akt in the liver of untreated and acute insulin-treated young, chow-fed mice. Data represents 3 independent experiments. N. Ube4A (FL)-mediated K63-Ub of Akt in vitro. Ube4A-ΔU-box was used as a negative control. Data represents at least 3 independent experiments. O. Top panel: LC-MS/MS-based identification of the exclusive unique spectrum counts of immunoprecipitated Ube4A and co-immunoprecipitated APPL1 from the BAT of young, chow-fed WT mice. Ig-control samples did not show any spectrum. Bottom panel: LC-MS/MS-based identification of the APPL1 peptides in the above experiment. P-Q. Acute insulin-induced K63-Ub of APPL1 and APPL1-Akt binding in the liver of UKO mice. K63-Ub was detected in immunoprecipitated APPL1. Co-precipitated Akt was detected by immunoblotting in APPL1-immunoprecipitated samples. Data represents 3 independent experiments. Each figure represents the conclusion from at least three independent experiments. Mean ± s.e.m. shown within dot plots. For multiple comparisons, two-way ANOVA with Holm-Šidák multiple comparison test and for 2 independent data sets, Two-tailed unpaired Student's t-test. ∗P < 0.05, ∗∗P < 0.01, ∗∗∗P < 0.001.
Figure 7
Figure 7
Ube4A maintains metabolic homeostasis by mediating insulin signaling. A. Whole-body Ube4A deletion causes mild hyperinsulinemia and moderate impairment in glucose uptake in young, chow-fed mice. Moreover, HFD feeding develops severe insulin resistance in the knockouts. HFD-fed UKO mice also exhibit increased obesity, adipocyte dysfunction, hepatic steatosis, and liver injury. B. In WT conditions, Ube4A mediates K63-Ub of Akt and APPL1, leading to Akt activation and insulin-induced metabolic effects. In UKO mice, K63-Ub of these proteins is disrupted, affecting insulin signaling and metabolism. Solid and open arrows indicate fully and partially active processes, respectively.

References

    1. Chakravarthy M.V., Neuschwander-Tetri B.A. The metabolic basis of nonalcoholic steatohepatitis. Endocrinol Diabetes Metab. 2020;3 doi: 10.1002/edm2.112. - DOI - PMC - PubMed
    1. Loomba R., Friedman S.L., Shulman G.I. Mechanisms and disease consequences of nonalcoholic fatty liver disease. Cell. 2021;184:2537–2564. doi: 10.1016/j.cell.2021.04.015. - DOI - PubMed
    1. Friedman S.L., Neuschwander-Tetri B.A., Rinella M., Sanyal A.J. Mechanisms of NAFLD development and therapeutic strategies. Nat Med. 2018;24:908–922. doi: 10.1038/s41591-018-0104-9. - DOI - PMC - PubMed
    1. Kusminski C.M., Bickel P.E., Scherer P.E. Targeting adipose tissue in the treatment of obesity-associated diabetes. Nat Rev Drug Discov. 2016;15:639–660. doi: 10.1038/nrd.2016.75. - DOI - PubMed
    1. Brown M.S., Goldstein J.L. Selective versus total insulin resistance: a pathogenic paradox. Cell Metabol. 2008;7:95–96. doi: 10.1016/j.cmet.2007.12.009. - DOI - PubMed

Publication types