. 2023 Jul 26;43(30):5574-5587.
doi: 10.1523/JNEUROSCI.1470-22.2023. Epub 2023 Jul 10.

A Cellular Ground Truth to Develop MRI Signatures in Glioma Models by Correlative Light Sheet Microscopy and Atlas-Based Coregistration

Affiliations

A Cellular Ground Truth to Develop MRI Signatures in Glioma Models by Correlative Light Sheet Microscopy and Atlas-Based Coregistration

Katharina Schregel et al. J Neurosci. .

Abstract

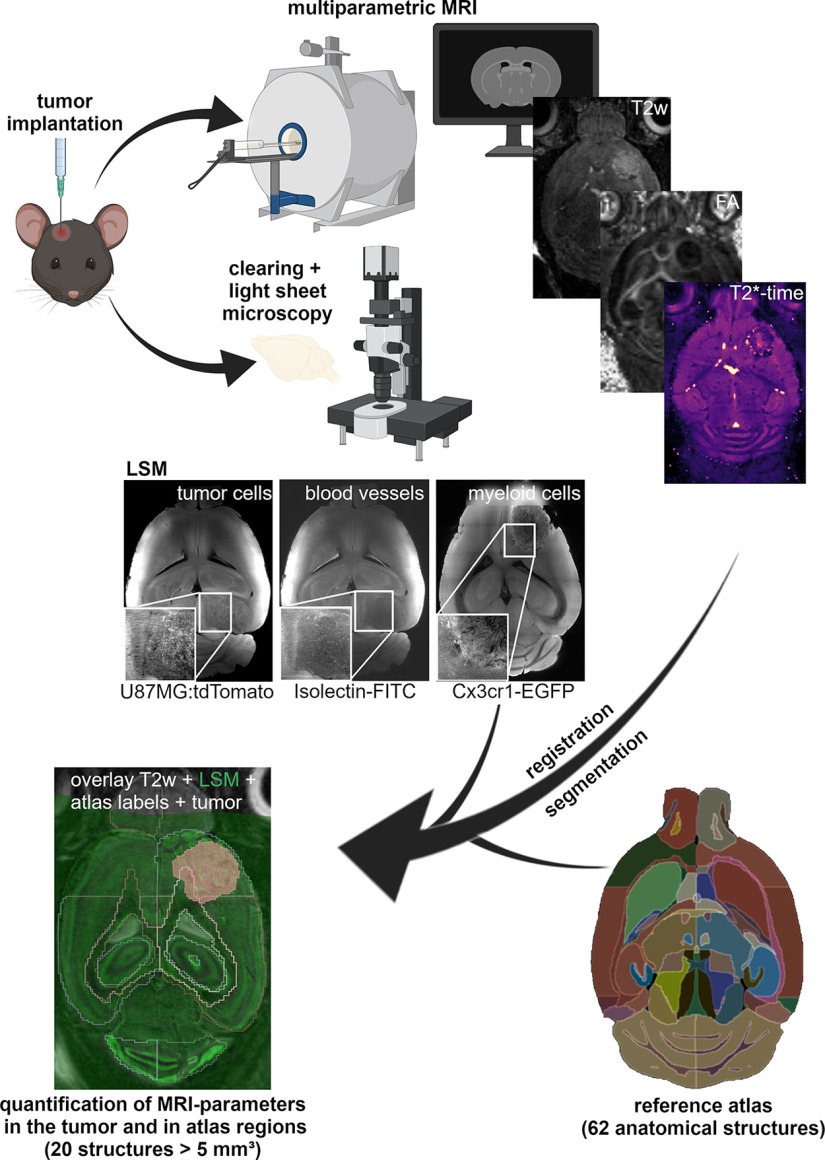
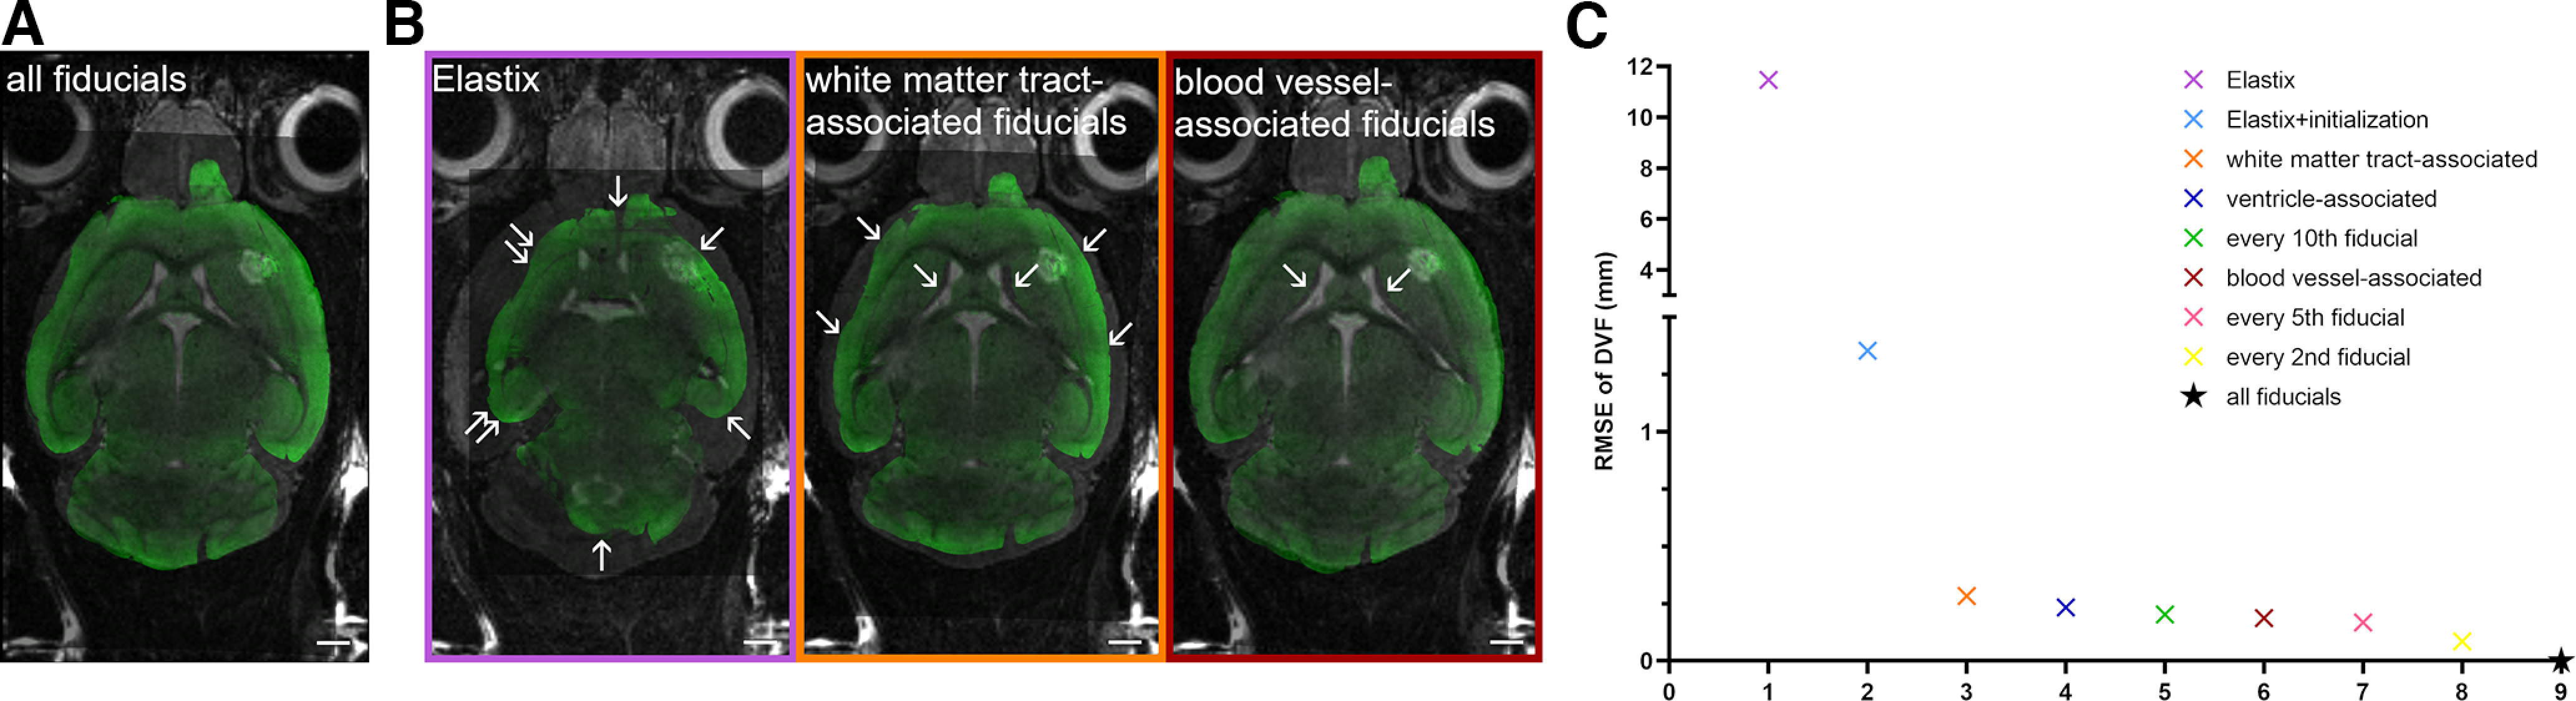
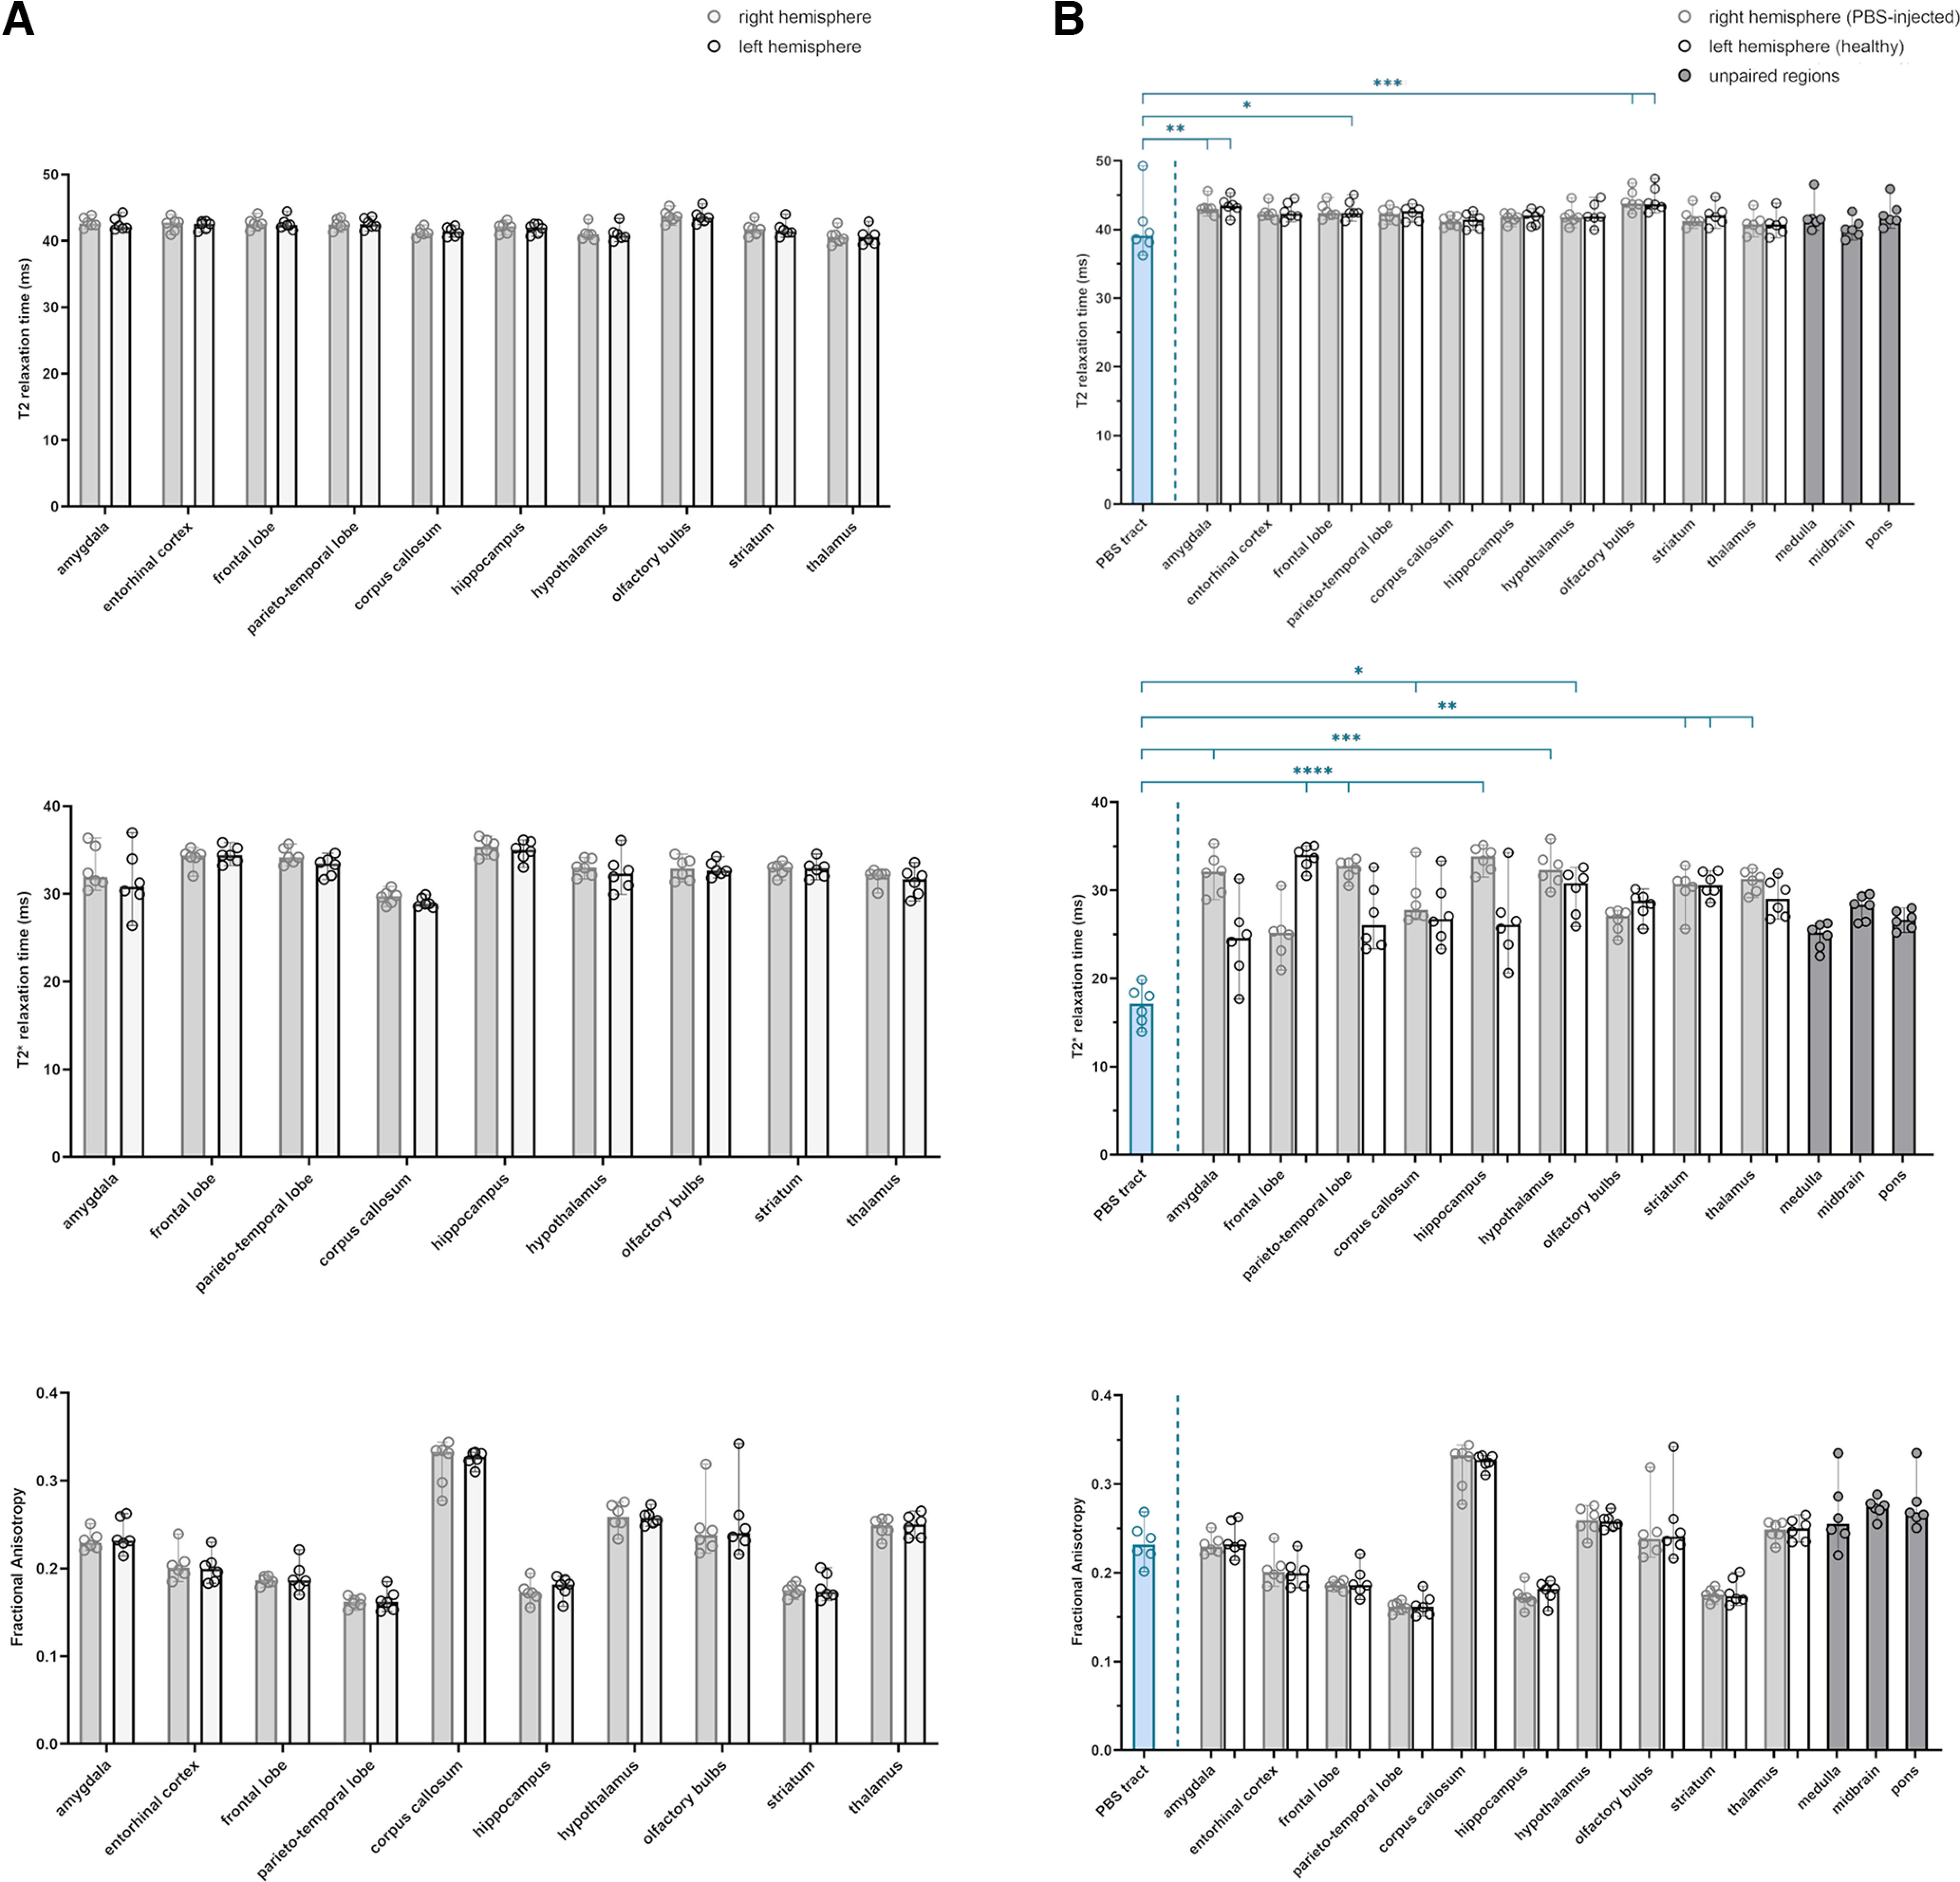
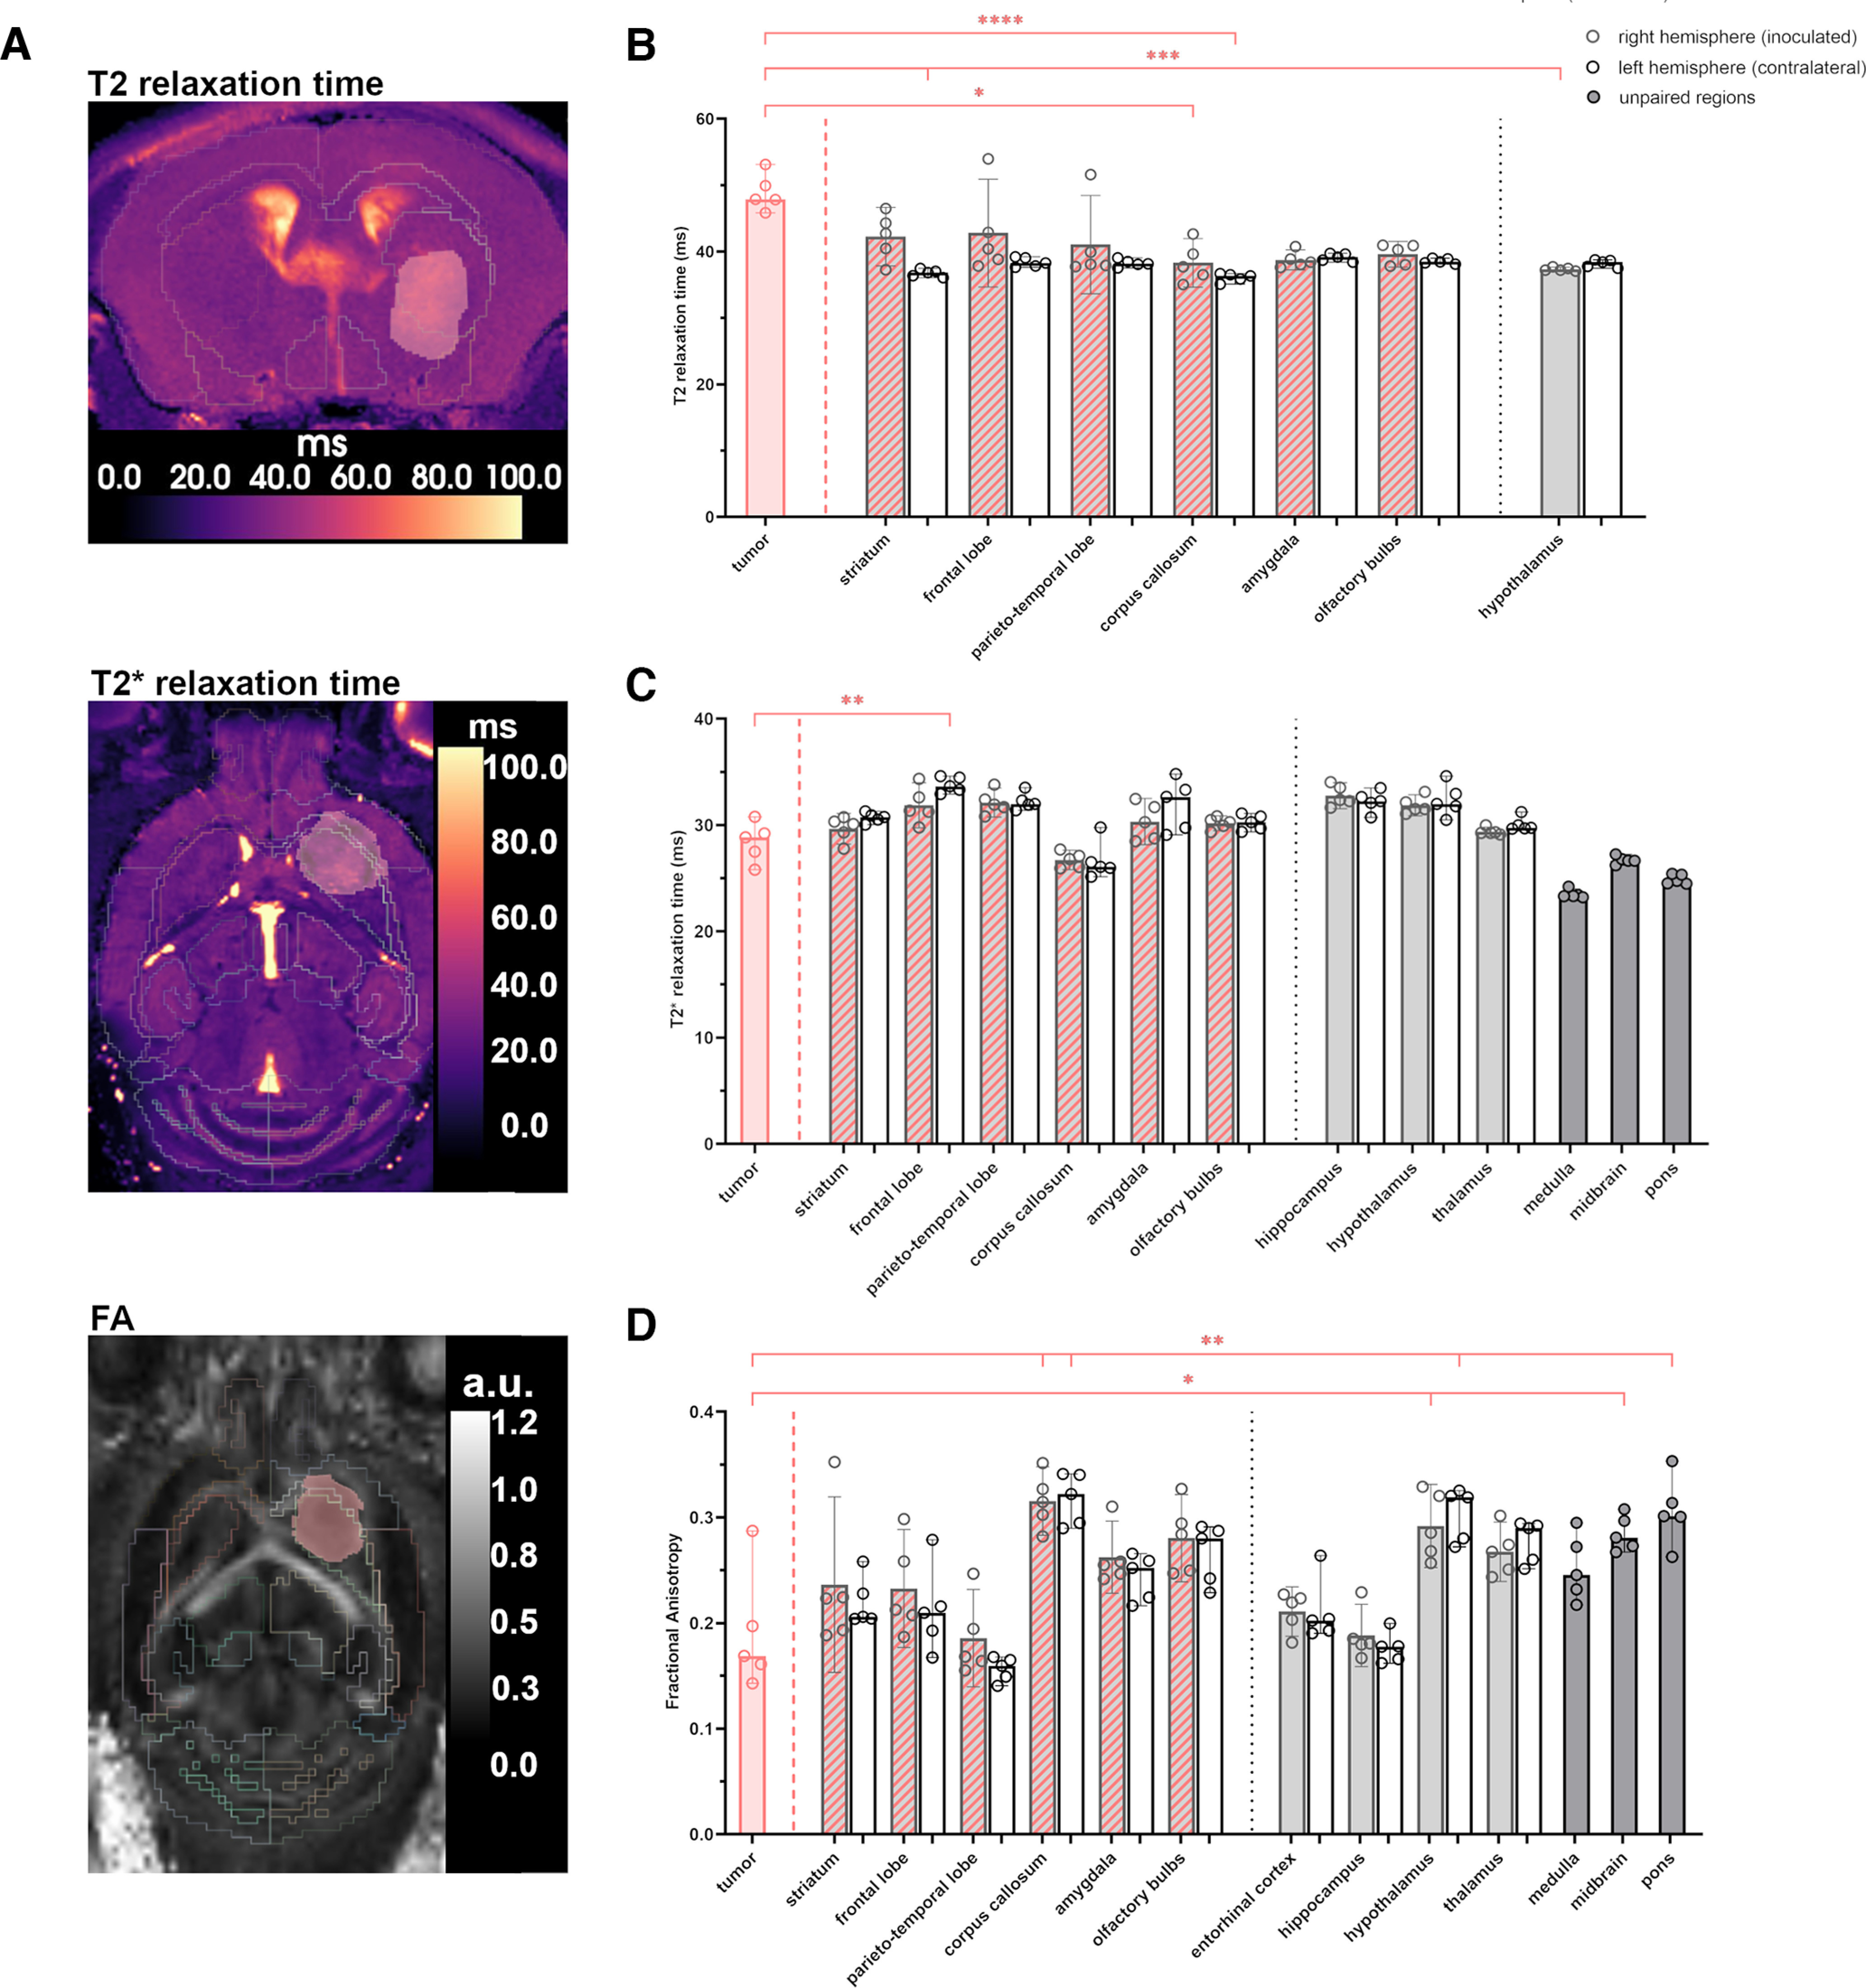
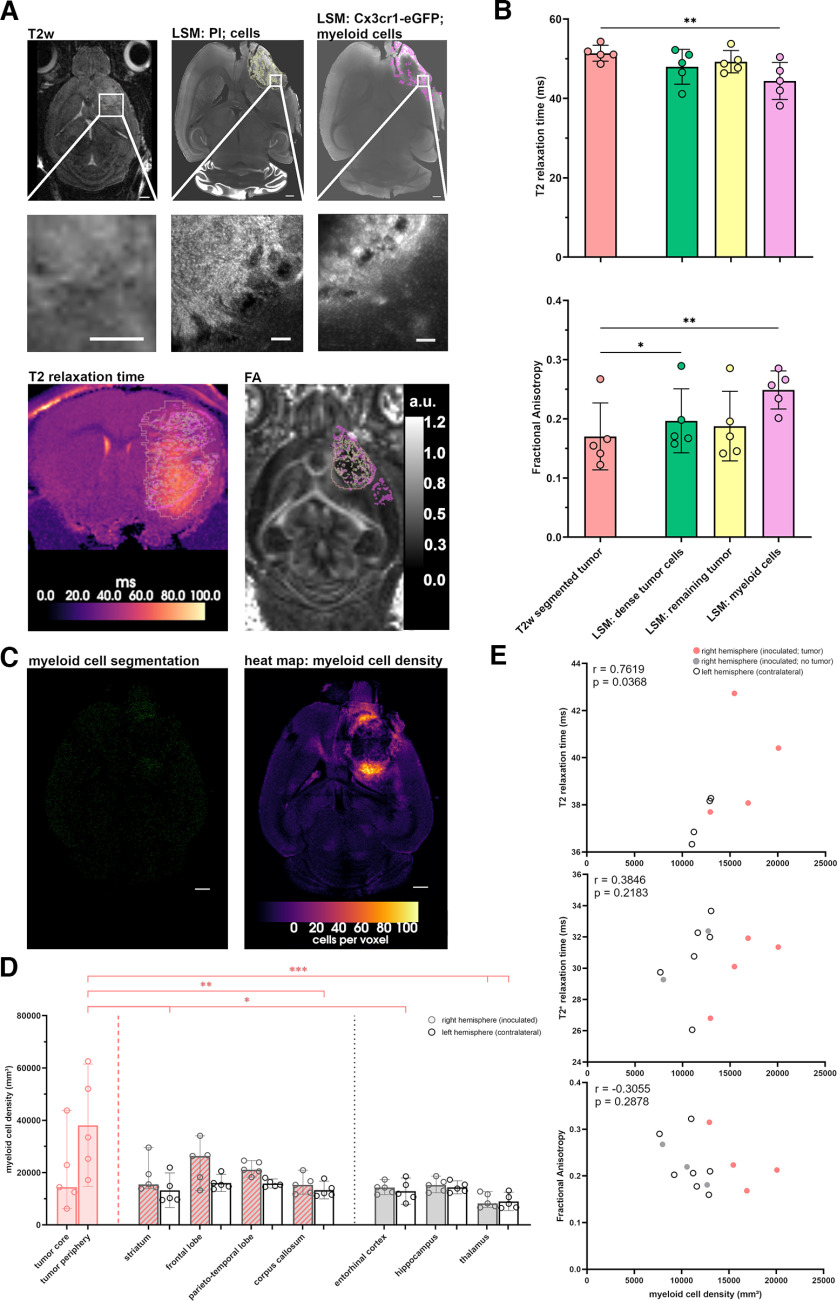
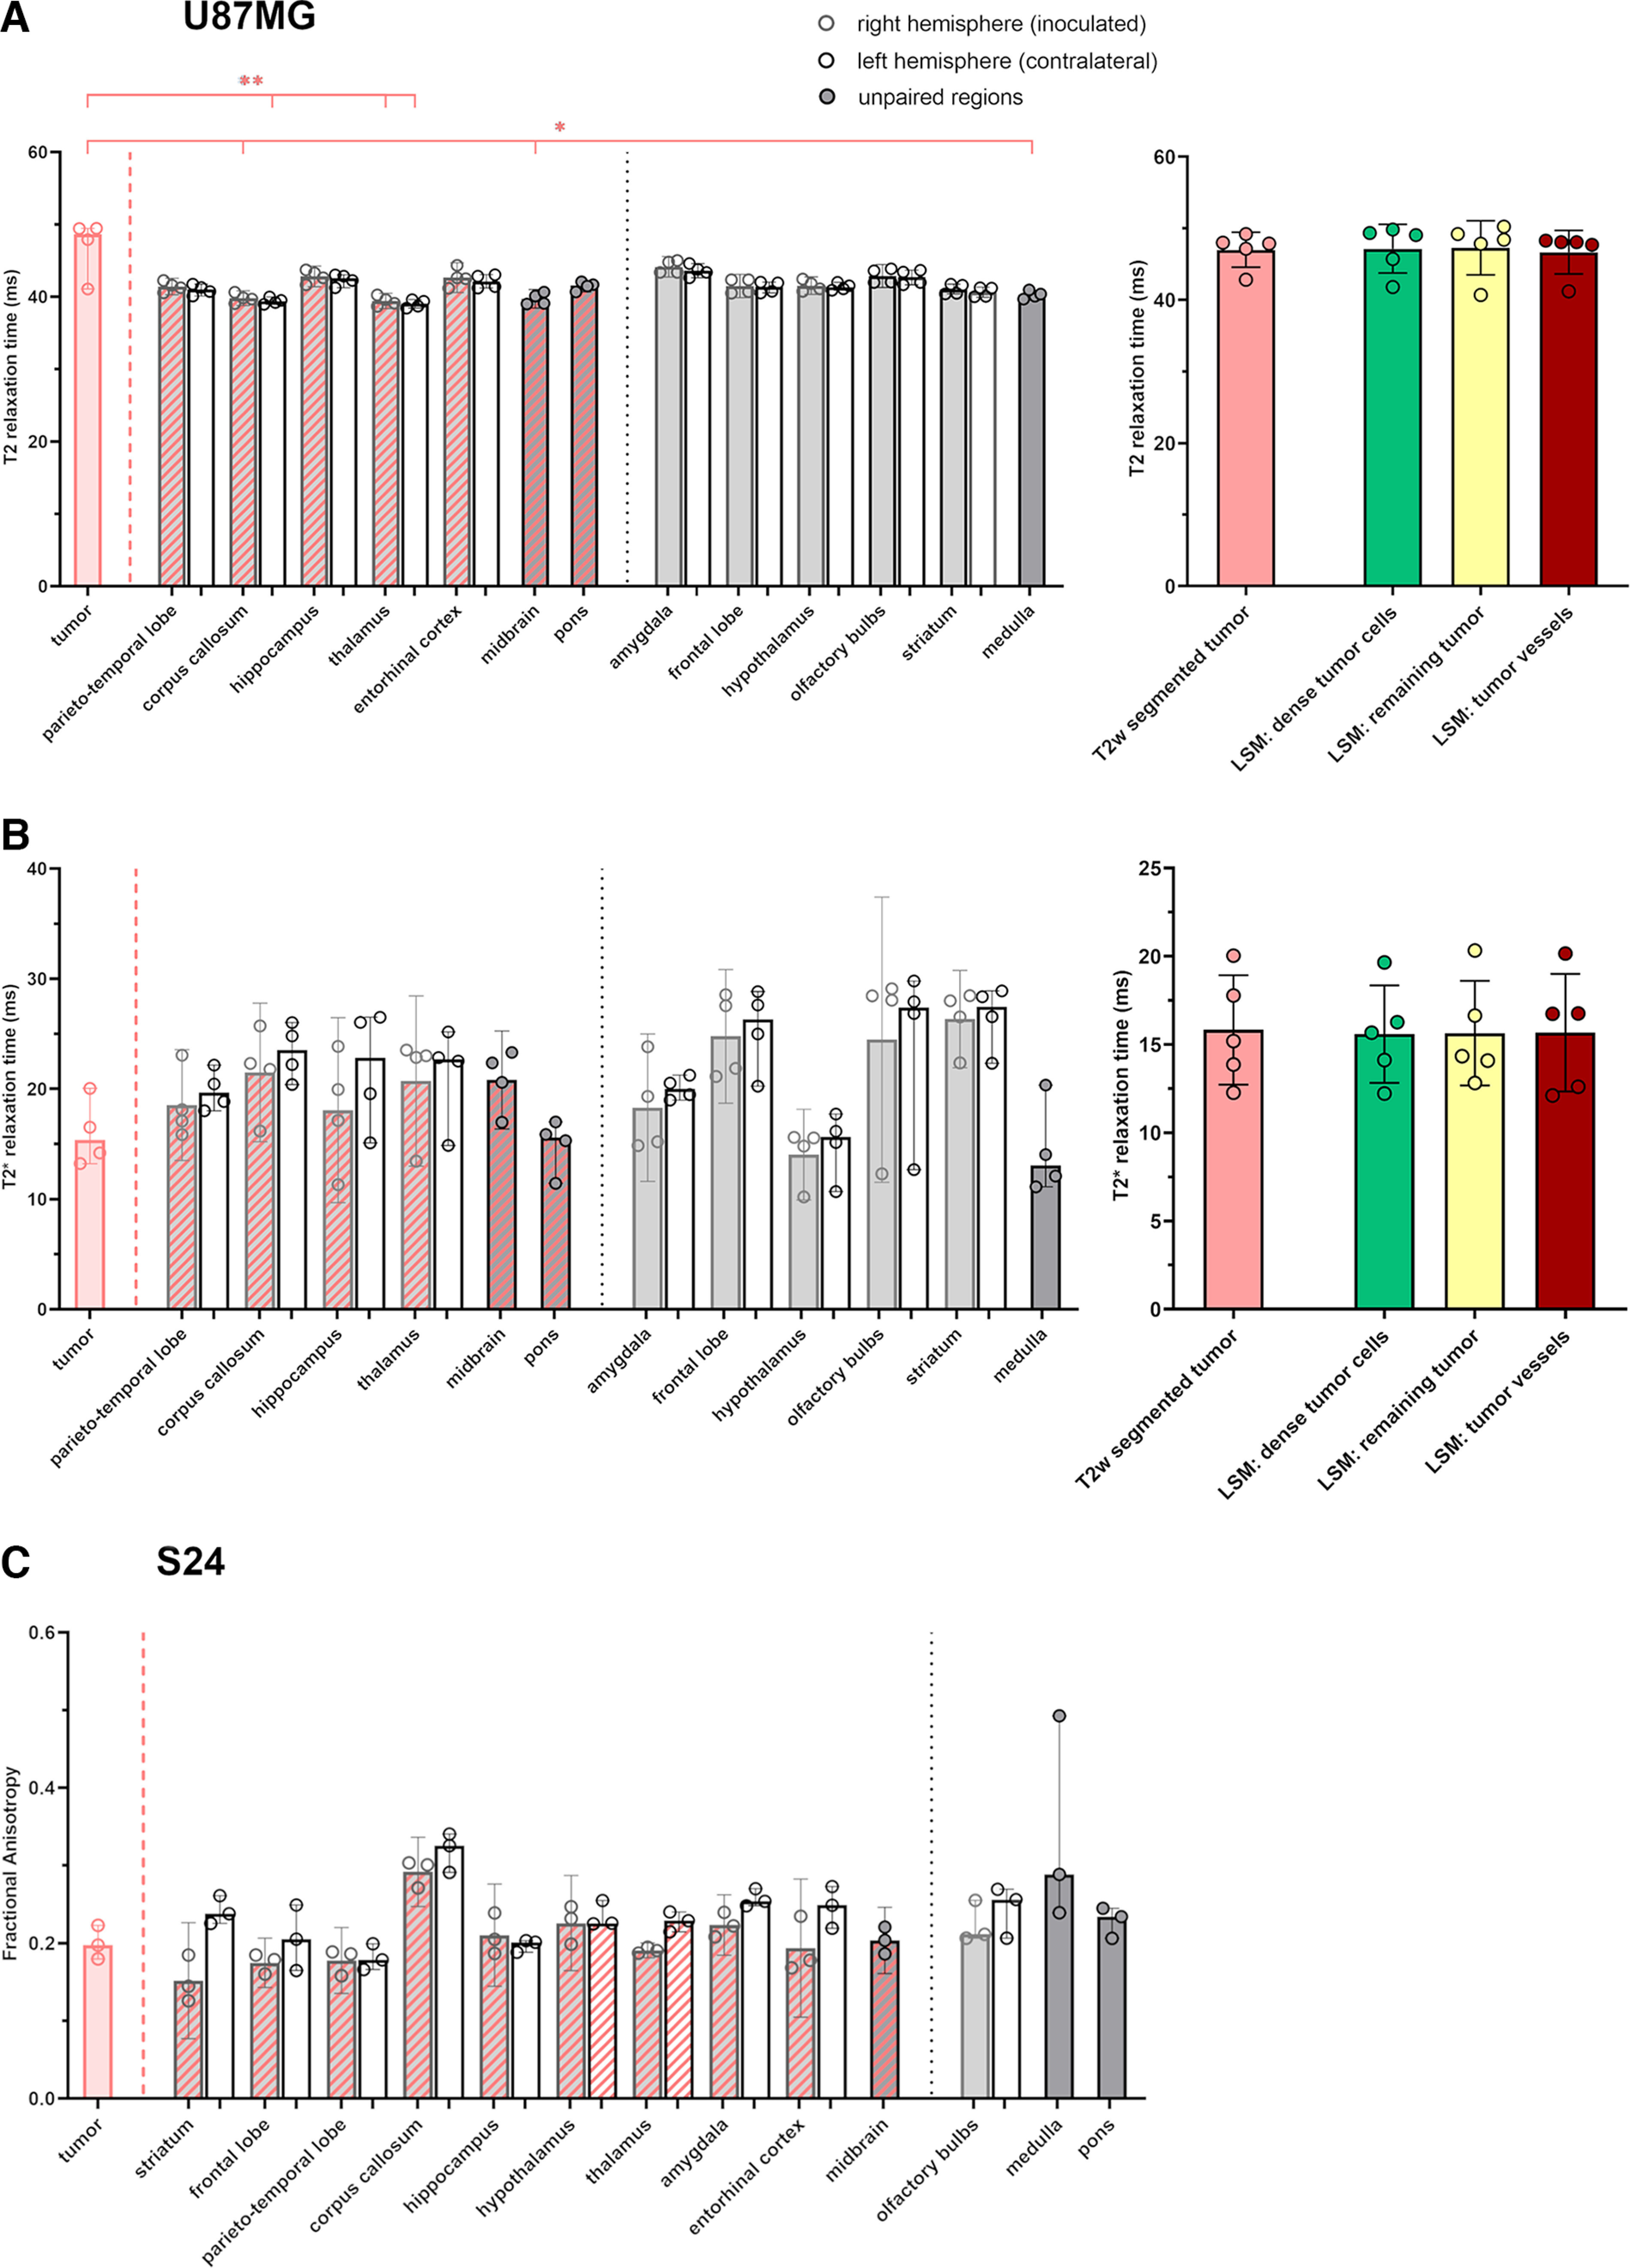
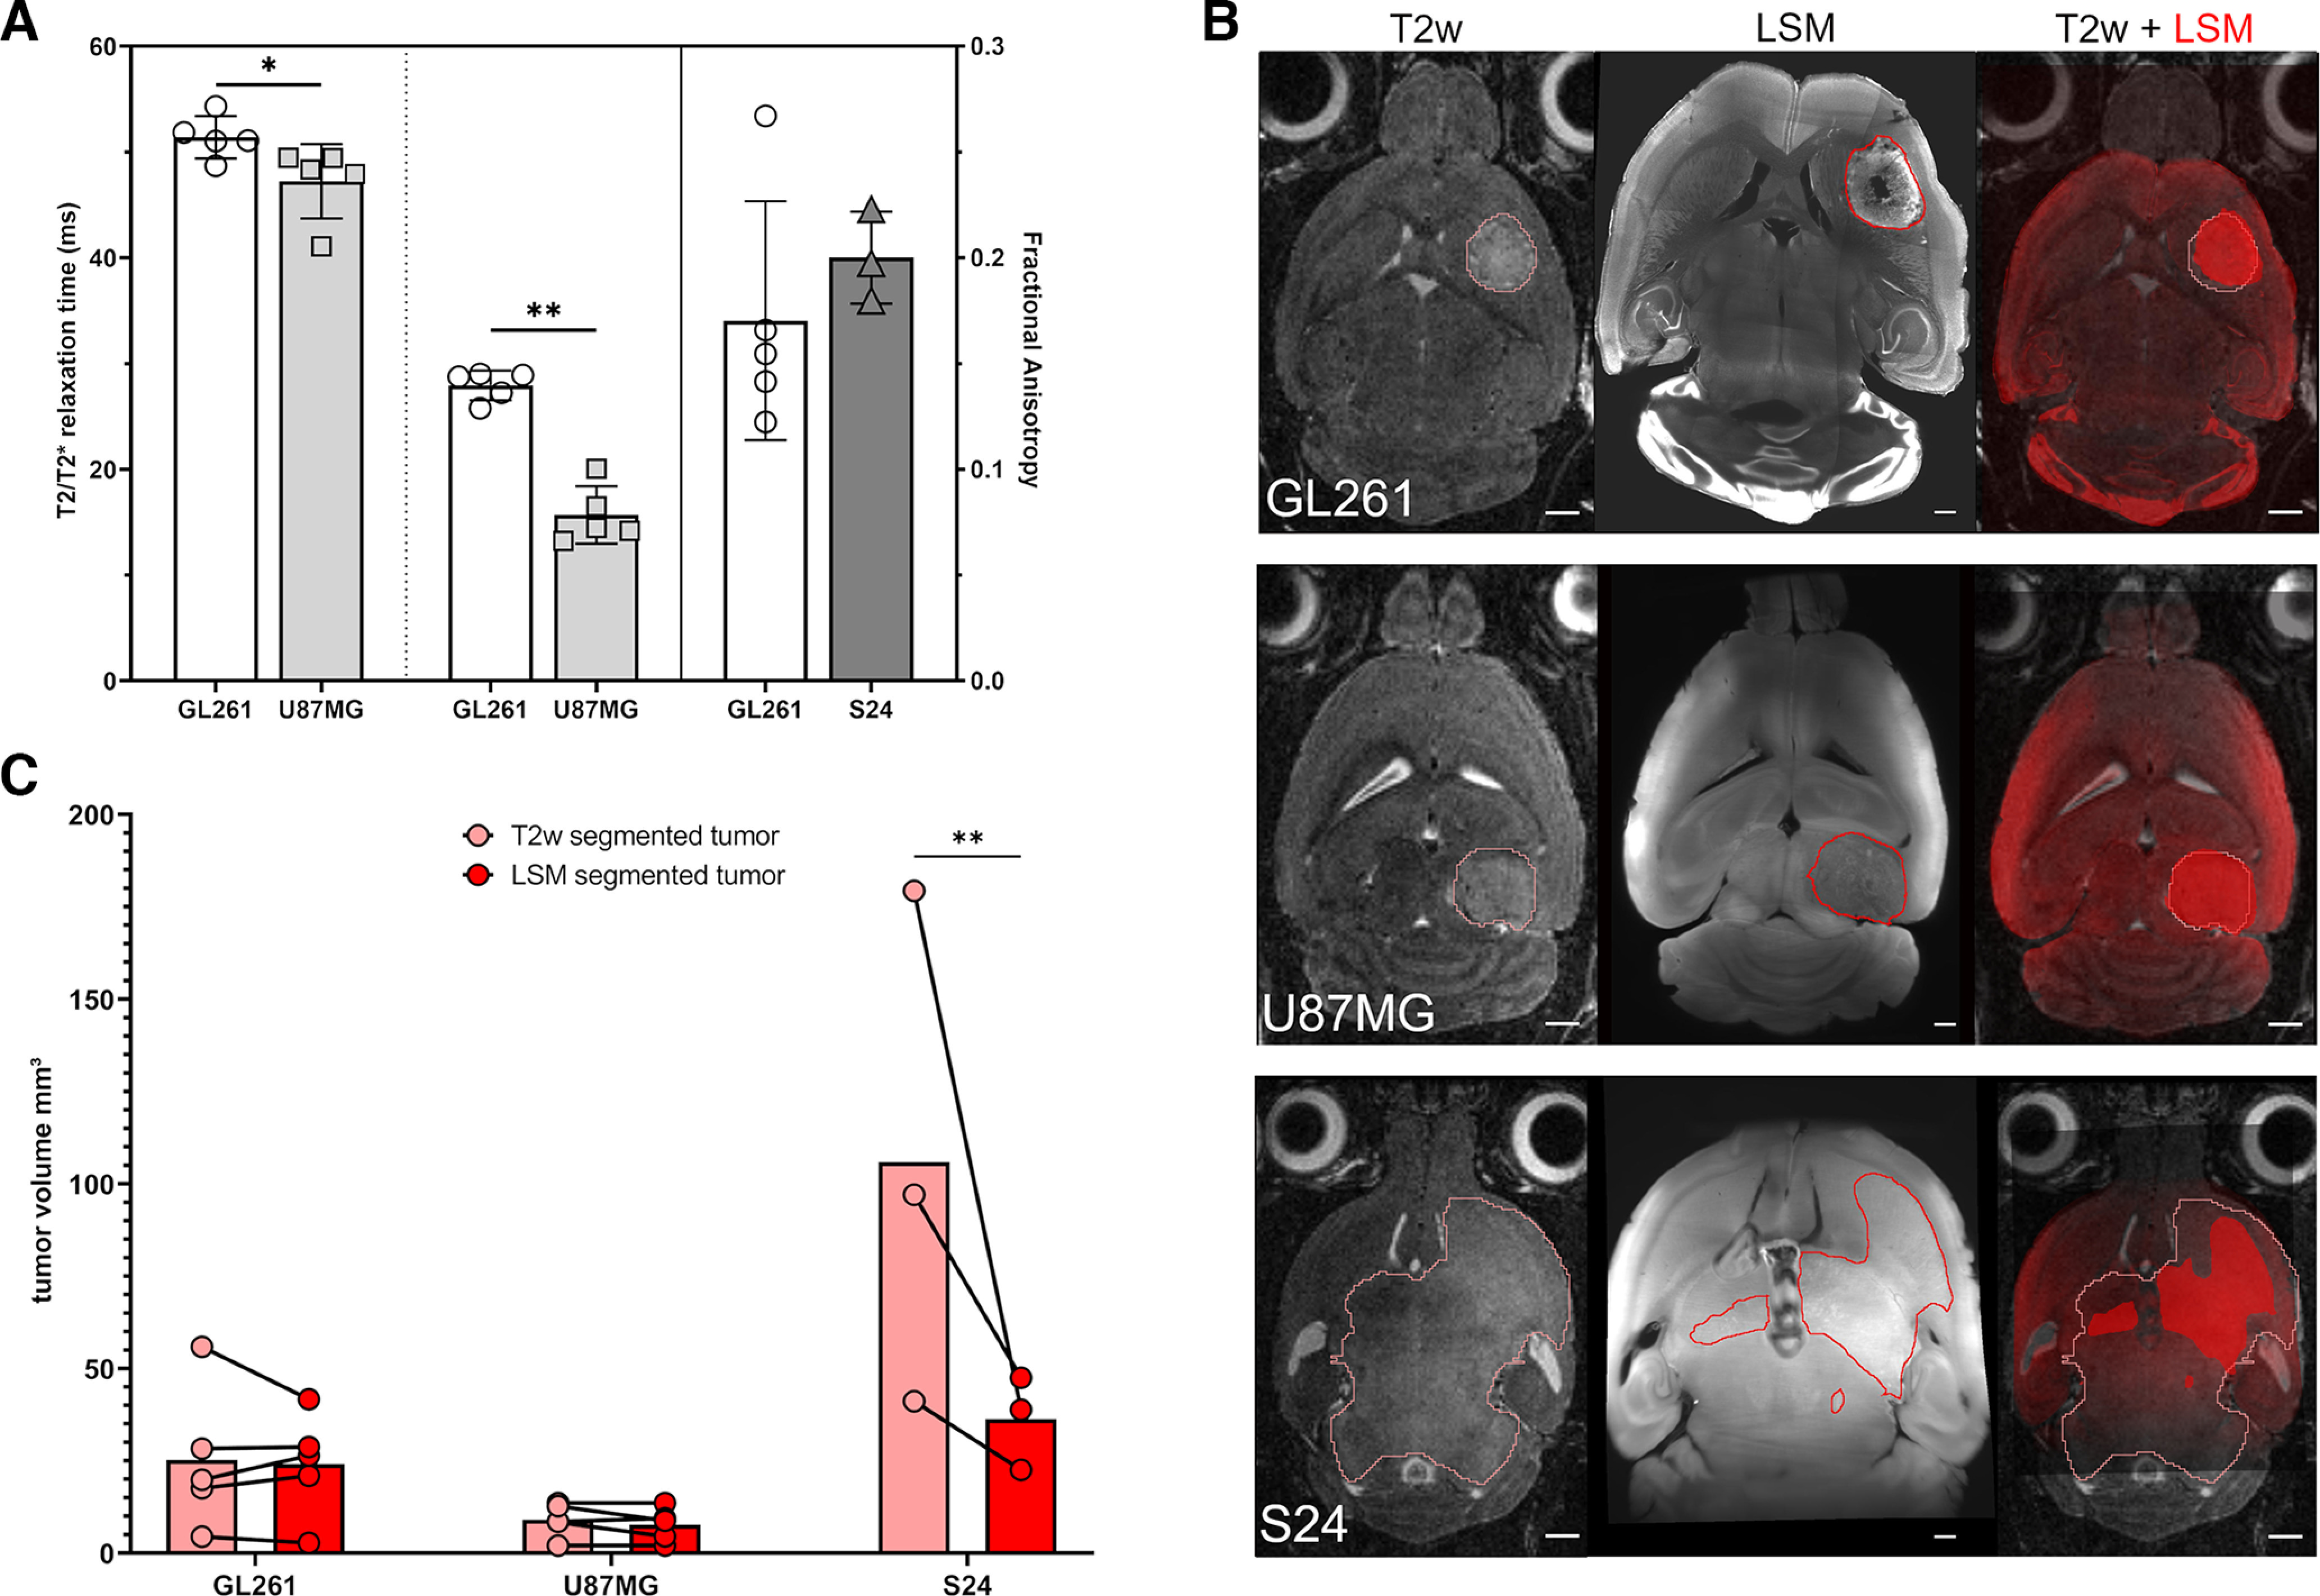
Glioblastoma is the most common malignant primary brain tumor with poor overall survival. Magnetic resonance imaging (MRI) is the main imaging modality for glioblastoma but has inherent shortcomings. The molecular and cellular basis of MR signals is incompletely understood. We established a ground truth-based image analysis platform to coregister MRI and light sheet microscopy (LSM) data to each other and to an anatomic reference atlas for quantification of 20 predefined anatomic subregions. Our pipeline also includes a segmentation and quantification approach for single myeloid cells in entire LSM datasets. This method was applied to three preclinical glioma models in male and female mice (GL261, U87MG, and S24), which exhibit different key features of the human glioma. Multiparametric MR data including T2-weighted sequences, diffusion tensor imaging, T2 and T2* relaxometry were acquired. Following tissue clearing, LSM focused on the analysis of tumor cell density, microvasculature, and innate immune cell infiltration. Correlated analysis revealed differences in quantitative MRI metrics between the tumor-bearing and the contralateral hemisphere. LSM identified tumor subregions that differed in their MRI characteristics, indicating tumor heterogeneity. Interestingly, MRI signatures, defined as unique combinations of different MRI parameters, differed greatly between the models. The direct correlation of MRI and LSM allows an in-depth characterization of preclinical glioma and can be used to decipher the structural, cellular, and, likely, molecular basis of tumoral MRI biomarkers. Our approach may be applied in other preclinical brain tumor or neurologic disease models, and the derived MRI signatures could ultimately inform image interpretation in a clinical setting.SIGNIFICANCE STATEMENT We established a histologic ground truth-based approach for MR image analyses and tested this method in three preclinical glioma models exhibiting different features of glioblastoma. Coregistration of light sheet microscopy to MRI allowed for an evaluation of quantitative MRI data in histologically distinct tumor subregions. Coregistration to a mouse brain atlas enabled a regional comparison of MRI parameters with a histologically informed interpretation of the results. Our approach is transferable to other preclinical models of brain tumors and further neurologic disorders. The method can be used to decipher the structural, cellular, and molecular basis of MRI signal characteristics. Ultimately, information derived from such analyses could strengthen the neuroradiological evaluation of glioblastoma as they enhance the interpretation of MRI data.

Keywords: diffusion tensor imaging; glioma; light sheet microscopy; magnetic resonance imaging; relaxometry; tissue clearing.


Figures

Figure 1.
Figure 1.
Overview of the workflow. GL261, U87MG, and S24 glioma cells were orthotopically implanted. Multiparametric MRI data including T1-weighted and T2-weighted sequences, DTI, and T2 and T2* relaxometry were acquired. After scanning, brains were harvested, optically cleared, and imaged with LSM focusing on tumor cells, blood vessels, and myeloid cells. MRI and LSM datasets were coregistered to each other and to a reference mouse brain atlas, which differentiates 62 anatomic structures. Tumors and tumor subregions were segmented on T2-weighted and LSM images, respectively. Mean T2 and T2* relaxation times as well as FA were quantified, in the glioma, in histologically determined tumor subregions and in atlas-defined brain regions. To avoid partial volume effects, only atlas structures with a volume of at least 5 mm3 were included. This led to the inclusion of 20 of the 62 available anatomic atlas regions in the final analysis. Parts of the figure were created with Biorender.com.
Figure 2.
Figure 2.
Robustness of the coregistration. An anatomic landmark-based approach was used to coregister 3D T2w and corresponding LSM data of each animal. Fiducials were placed on anatomic structures, such as blood vessels, white matter tracts, and ventricles, that were unequivocally identifiable on both datasets. A, This rendered optically satisfying results with good overlap of MRI (in gray scale) and LSM data (in green scale). To evaluate this approach, coregistration was tested with transforms generated with subsets of the initial fiducial set. B, Overlays of T2w (in gray) and LSM data (in green) that were transformed with such subsets of fiducials. B, The transform generated with the Slicer Elastix module (left with purple frame) rendered the lowest accuracy of coregistration. The use of only white matter tract-associated fiducials led to discrepancies along the cortical and midline regions of the brain (middle with orange frame; the arrows mark areas lacking overlap). B, Application of only blood vessel-associated fiducials performed better along the cortical surface but did not align ventricles well (right with red frame; the arrows indicate suboptimal alignment of the ventricles). C, To further test the robustness of this approach, the rmse of the DVFs of transforms that were created with subsets of fiducials and the entire set of fiducials as ground truth were compared. The subsets of fiducials used are color coded, and the ground truth transform based on fiducials placed on all structures is marked with a star. C, Automatic coregistration using the Slicer Elastix module, without and with a manual initialization transform that approximately aligned both datasets, rendered the worst results not only qualitatively, but also in terms of the rmse (purple and light blue). B, C, Although the rmse of DVFs generated with subsets of fiducials placed on blood vessels (C, red), and white matter tract-associated (C, orange) or ventricle-associated structures (C, dark blue) were rather small, qualitative comparison showed suboptimal overlap (B).
Figure 3.
Figure 3.
Atlas-based analysis of healthy brain and of the effects of PBS sham injection. A, Comparison of T2 and T2* relaxation times as well as FA between brain regions in the left and right hemisphere of healthy C57BL/6 mice. As expected, none of the parameters differ significantly between the hemispheres. FA of white matter tracts such as the corpus callosum is higher than in gray matter structures. B, We investigated the effects of PBS sham injection on regional MRI parameters. The injection site could be identified as a hypointense tract on T2w images and was surrounded by a narrow T2w hyperintense rim. B, This qualitative impression is reflected by significantly shorter T2* and T2 relaxation times of the PBS injection tract compared with brain regions. However, the presence of the injection site had no impact on global regional MRI features, as the MRI parameters of the right PBS-injected hemisphere and the left healthy hemisphere remained comparable. PBS injection had no effect on local or regional FA. The asterisks indicate the level of significance of multiplicity adjusted p-values (α = 0.5).
Figure 4.
Figure 4.
Atlas-based analysis of the GL261 cohort. A, Exemplary images from an animal with a GL261 glioma. Of note, MR images are not displayed in radiologic convention to match the LSM data (i.e., the right hemisphere is on the right side of the image). T2, T2*, and FA maps with an overlay of atlas labels displaying the anatomic regions analyzed (outlined in different colors) and the segmented tumor (pink area) are presented from top to bottom. The striatum (light green) and the frontal cortex (light blue) contained the largest tumor burden. B–D, T2 relaxation time (B) and T2* relaxation time (C) as well as FA (D) were quantified in atlas-defined anatomic regions and in GL261 tumors segmented on LSM datasets (red bar and dots). The hemisphere in which the tumor was implanted is displayed in gray (bars and dots) and the contralateral hemisphere is shown in white (bars and dots). Unpaired brain regions are displayed in dark gray (bars and dots). Regions with LSM-confirmed presence of tumor cells are marked by red stripes. Median values in the LSM-confirmed tumor region were compared with all atlas-defined structures. Then, median values of the quantitative MRI parameters of the inoculated hemisphere were compared with the contralateral side. Unpaired brain regions (medulla, midbrain, and pons) were not included in this analysis. B, T2 relaxation time of GL261 glioma was longer than in several brain regions. C, D, Moreover, T2* relaxation time (C) and FA (D) of the tumor differed from anatomically defined regions. T2 relaxation time and FA distinguished best between glioma and brain tissue. The asterisks indicate the level of significance of multiplicity adjusted p-values. The α value was set to 0.5.
Figure 5.
Figure 5.
Comparison of GL261 subregions. A, Coregistered MRI and LSM data of an animal with a GL261 glioma. A, The tumor was segmented on T2w images (A, top left, light red). Scale bar, 1 mm. The inlet shows a magnification of the tumor, which grows bulky and is mainly T2w hyperintense compared with the surrounding tissue. Scale bar, 1 mm. LSM datasets were used to define subregions of a GL261 glioma: areas with densely packed tumor cells (A, top middle; green; scale bar, 500 µm) were differentiated from the remaining tumor (A, top middle, yellow; scale bar, 500 µm) and from areas with accumulated Cx3cr1-EGFP-positive myeloid cells (microglia, monocytes, dendritic cells, and NK cells; A, top right, pink; scale bar, 500 µm). A, Magnification of the T2w image (left inlet) reveals a rather homogeneously T2w-hyperintense tumor center with a T2w-hypointense rim. Scale bar, 1 mm. A, Magnification of the LSM images reveals that tumor cells are not evenly distributed, but rather exhibit a radial formation with interspersed areas of lesser cell density (middle inlet). Scale bar, 100 µm. A, Myeloid cells accumulate along the tumor borders, but can also be found in the adjacent tissue (right inlet). Scale bar, 100 µm. Overlays of these regions on maps of T2 relaxation time and FA are shown below. The areas of T2w-suspected (light red) and LSM-confirmed tumor (yellow/green) overlap, while myeloid cell accumulation (pink) extends beyond the main tumor bulk. B, When comparing quantitative MRI parameters between these regions, significant differences were observable between mean values of the T2w-segmented tumor and LSM-defined subregions. C, The density of Cx3cr1-EGFP-positive myeloid cells was automatically quantified. On the left, an exemplary segmentation output is shown (white, Cx3cr1-EGFP-positive myeloid cells; downsampled voxel size, 7.3 × 7.3 × 30 µm). Scale bar, 500 µm. Millions of myeloid cells, in this case 2,096,833 cells, were automatically segmented, which showcases the power of our segmentation approach. By this, cell quantities in the tumor and in anatomic brain regions were made accessible for further analyses. On the right, a heat map displaying the number of myeloid cells per voxel of a downsampled LSM dataset is shown (voxel size, 255.5 × 255.5 × 1050 µm). Scale bar, 500 µm. The highest number of myeloid cells per voxel was observable in the tumor periphery. D, Myeloid cell density per mm³ was calculated and compared between brain regions. The tumor periphery displayed the highest myeloid cell density, significantly exceeding most non-tumor-bearing regions. D, Myeloid cell density was lowest in the thalamus. E, We additionally correlated regional myeloid cell density to T2 and T2* relaxation time as well as FA and observed a significant positive correlation between myeloid cell density and T2 relaxation time. Asterisks indicate the level of significance of multiplicity-adjusted p-values.
Figure 6.
Figure 6.
Atlas-based and subregional analyses of the U87MG and S24 cohorts. A–C, Analysis of T2 relaxation time (A, left) and T2* relaxation time (B, left) as well as FA (C) in atlas-defined anatomic regions and in U87MG tumors (A, B) and S24 tumors (C) segmented on LSM datasets (red bars and dots). The hemisphere in which the tumor was implanted is displayed in gray (bars and dots), and the contralateral hemisphere is shown in white (bars and dots), while unpaired regions are shown in dark gray (bars and dots). Regions with an LSM-confirmed presence of tumor cells are marked by red stripes. Quantitative MRI parameters of the LSM-segmented tumor were compared with all atlas regions. Additionally, regions of the inoculated hemisphere were compared with the contralateral side. A, B, Additionally, mean T2 relaxation time (A, right) and T2* relaxation time (B, right) of subregions defined on LSM datasets (green, densely packed tumor cells; red, tumor vessels; yellow, remaining tumor) were compared with each other and to the entire tumor, but T2 and T2* relaxation times were similar in these regions. The asterisks indicate the level of significance of multiplicity adjusted p-values (α = 0.5).
Figure 7.
Figure 7.
Comparison of MRI-characteristics and tumor volume of the three glioma models. A, GL261 gliomas (white bars and dots) and U87MG gliomas (light gray bars and squares) present with significantly different T2 and T2* relaxation times (left and middle). FA values of GL261 and S24 gliomas (dark gray bar and triangles) were similar. B, T2w images with segmented tumors and coregistered slices from LSM data displaying the confirmed tumor region are depicted for each glioma type. Scale bars, 500 µm. Additionally, overlays of coregistered T2w and LSM images (in red for better visibility) are shown. Tumor volumes derived from T2w-based (pink bars and dots) and LSM-based (red bars and dots) segmentation were compared. B, C, The volumes of T2w-segmented and LSM-segmented tumors overlap in bulky growing gliomas such as GL261 and U87MG (B, top and middle row, C). In these tumor types, T2w suspect areas can be used as a surrogate for tumor presence. In contrast, the T2w-suspicious and LSM-confirmed tumor areas do not completely overlap in invasively growing S24 glioma, leading to a significant difference between the volumes derived from T2w and LSM segmentation (B, bottom row, C). Thus, T2w segmentation of S24 glioma does not necessarily only reflect tumor-bearing parenchyma, but may also contain edema, for example.

Similar articles

Cited by

References

    1. Akbari H, Macyszyn L, Da X, Bilello M, Wolf RL, Martinez-Lage M, Biros G, Alonso-Basanta M, O'Rourke DM, Davatzikos C (2016) Imaging surrogates of infiltration obtained via multiparametric imaging pattern analysis predict subsequent location of recurrence of glioblastoma. Neurosurgery 78:572–580. 10.1227/NEU.0000000000001202 - DOI - PMC - PubMed
    1. Almagro J, Messal HA, Zaw Thin M, van Rheenen J, Behrens A (2021) Tissue clearing to examine tumour complexity in three dimensions. Nat Rev Cancer 21:718–730. 10.1038/s41568-021-00382-w - DOI - PubMed
    1. Berg S, Kutra D, Kroeger T, Straehle CN, Kausler BX, Haubold C, Schiegg M, Ales J, Beier T, Rudy M, Eren K, Cervantes JI, Xu B, Beuttenmueller F, Wolny A, Zhang C, Koethe U, Hamprecht FA, Kreshuk A (2019) ilastik: interactive machine learning for (bio)image analysis. Nat Methods 16:1226–1232. 10.1038/s41592-019-0582-9 - DOI - PubMed
    1. Bhargava A, Monteagudo B, Kushwaha P, Senarathna J, Ren Y, Riddle RC, Aggarwal M, Pathak AP (2022) VascuViz: a multimodality and multiscale imaging and visualization pipeline for vascular systems biology. Nat Methods 19:242–254. 10.1038/s41592-021-01363-5 - DOI - PMC - PubMed
    1. Bobholz SA, Lowman AK, Barrington A, Brehler M, McGarry S, Cochran EJ, Connelly J, Mueller WM, Agarwal M, O'Neill D, Nencka AS, Banerjee A, LaViolette PS (2020) Radiomic features of multiparametric MRI present stable associations with analogous histological features in patients with brain cancer. Tomography 6:160–169. 10.18383/j.tom.2019.00029 - DOI - PMC - PubMed

Publication types