. 2023 Jul 10;14(1):4088.
doi: 10.1038/s41467-023-39465-7.

QBO deepens MJO convection

Affiliations

QBO deepens MJO convection

Daeho Jin et al. Nat Commun. .

Abstract

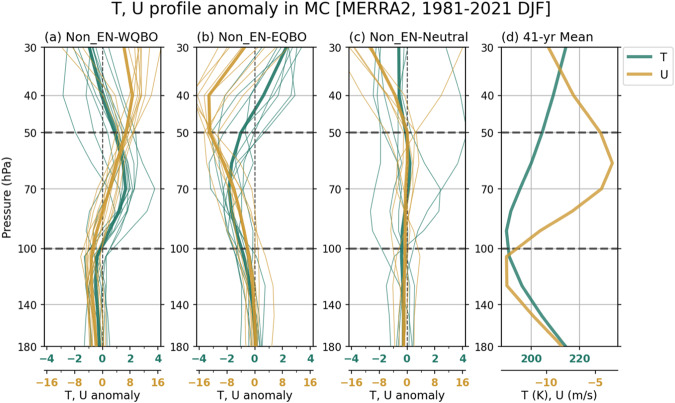
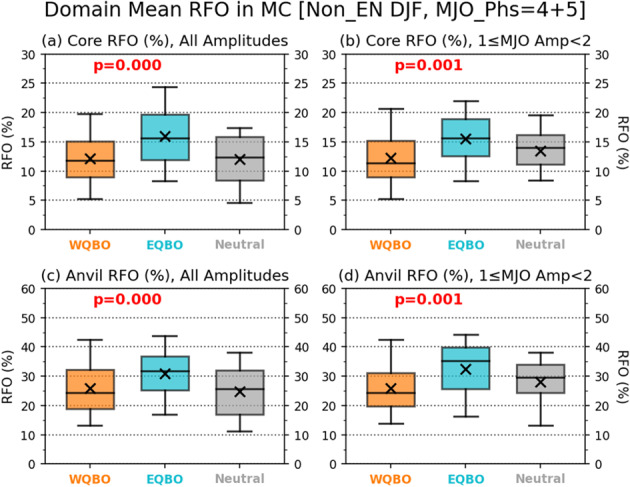
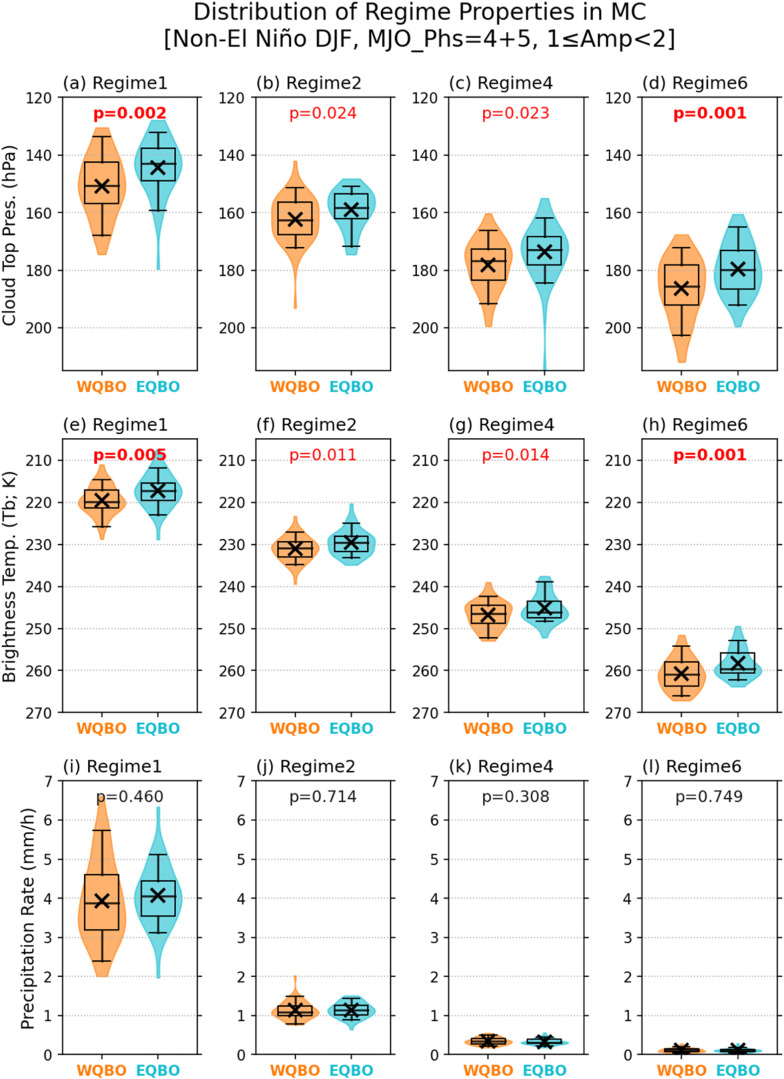
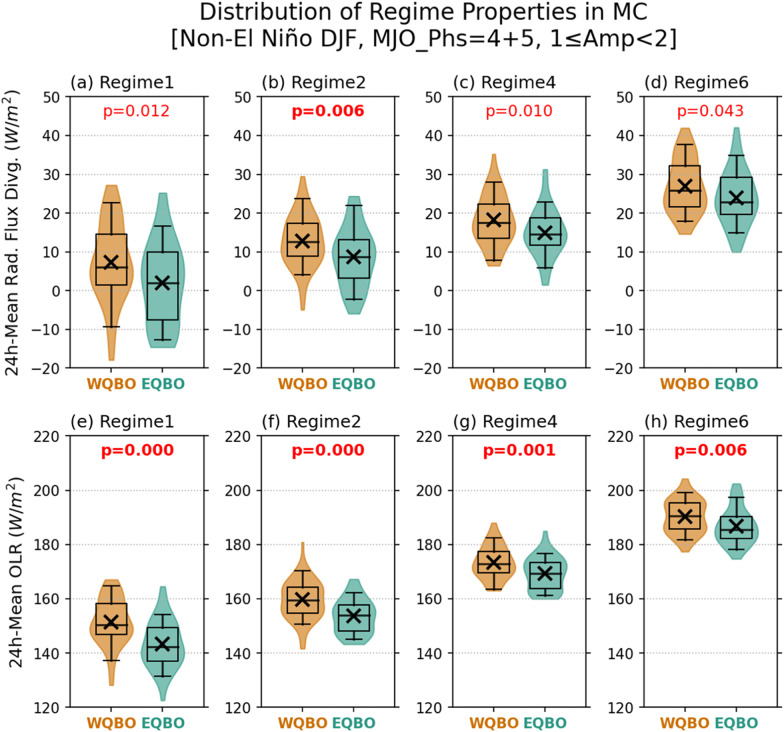
The underlying mechanism that couples the Quasi-Biennial Oscillation (QBO) and the Madden-Julian oscillation (MJO) has remained elusive, challenging our understanding of both phenomena. A popular hypothesis about the QBO-MJO connection is that the vertical extent of MJO convection is strongly modulated by the QBO. However, this hypothesis has not been verified observationally. Here we show that the cloud-top pressure and brightness temperature of deep convection and anvil clouds are systematically lower in the easterly QBO (EQBO) winters than in the westerly QBO (WQBO) winters, indicating that the vertical growth of deep convective systems within MJO envelopes is facilitated by the EQBO mean state. Moreover, the deeper clouds during EQBO winters are more effective at reducing longwave radiation escaping to space and thereby enhancing longwave cloud-radiative feedback within MJO envelopes. Our results provide robust observational evidence of the enhanced MJO activity during EQBO winters by mean state changes induced by the QBO.


Conflict of interest statement

The authors declare no competing interests.

Figures

Fig. 1
Fig. 1. Selecting the westerly Quasi-Biennial Oscillation (WQBO) and easterly QBO (EQBO) years.
Domain mean temperature in the Maritime Continent (MC; 100°E−150°E, 15°S−5°N) for layers between 50 and 100 hPa (T50-100) is aligned with (a) zonal mean zonal wind at 50-hPa (U50), and (b) Niño 3.4. Panel (c) shows a scatter plot of U50 vs. Niño3.4, and the level of T50-100 is presented in colors. All values are wintertime mean anomalies for December to February (DJF), and the correlation coefficient between variables of x and y axes is shown above each panel. The number next to each circle symbol indicates the last two digits of the year to which the particular January belongs to. In panel (c), the darker gray color areas indicate the WQBO and EQBO winters used in this study.
Fig. 2
Fig. 2. Quasi-Biennial Oscillation (QBO)-associated temperature and wind perturbations in the upper troposphere and lower stratosphere.
December to February (DJF) mean seasonal anomalies of air temperature (T; green) and zonal wind (U; brown) averaged over Maritime Continent (MC; 100°E−150°E, 15°S−5°N) composited for (a) westerly QBO (WQBO), (b) easterly QBO (EQBO), and (c) QBO-neutral states during Non-El Niño winters. Panel (d) shows the 41-year climatological DJF mean of T and U profiles (1981–2021). The think lines indicate the averages of the selected years (listed in Table 1).
Fig. 3
Fig. 3. Madden-Julian Oscillation (MJO) propagation characteristics.
Temporal evolutions of meridional (15°S−5°N) mean density of convective core (red contour) and anvil regimes (orange shading), subjected to 15-degree longitude and 5-day running mean filtering, for (ae) the westerly Quasi-Biennial Oscillation (WQBO), (fi) the easterly QBO (EQBO), and (jk) QBO-neutral states during Non-El Niño winters. Contour interval is 10% in mean relative frequency of occurrence (RFO), and the diagonal gray lines indicate 5 m s−1 propagation speed. The vertical color bar next to each panel indicates the MJO phase for each day.
Fig. 4
Fig. 4. Enhanced convective activity over the Maritime Continent (MC) during easterly Quasi-Biennial Oscillation (EQBO) winters.
Relative frequency of occurrence (RFO) distributions of (a, b) Core regimes (regimes 1 and 2) and (c, d) Anvil regimes (regimes 4 and 6) displayed as box-whisker plots, separated for all Madden-Julian Oscillation (MJO) amplitudes (left column) and MJO amplitudes between 1 and 2 (right column), in the MC domain (100°E−150°E, 15°S−5°N) and for days of MJO phases 4 or 5 during Non-El Niño winters (December–February). The vertical widths of boxes represent interquartile range, whiskers extend from 5% to 95%, and horizontal lines and x symbols indicate median and mean values, respectively. The p-values from t-test of westerly QBO (WQBO) and EQBO composite differences are shown in each panel. Sample sizes are 128 (WQBO) and 82 days (EQBO) for the all-amplitudes case, and 59 and 44 days for the case of MJO amplitude between 1 and 2.
Fig. 5
Fig. 5. Comparison of cloud top pressure, brightness temperature, and precipitation in deep convective systems within Madden-Julian oscillation (MJO) envelops between easterly Quasi-Biennial Oscillation (EQBO) and westerly QBO (WQBO) winters.
Distributions of Maritime Continent (100°E−150°E, 15°S−5°N) domain mean cloud top pressure (top row) and brightness temperature (middle row), and precipitation rate (bottom row) of grid cells identified as regimes (a, e, i) regime 1, (b, f, j) regime 2, (c, g, k) regime 4, and (d, h, l) regime 6, for westerly Quasi-Biennial Oscillation (WQBO; orange) and EQBO (blue) composite days, in violin-style box-whisker plot (same convention as in Fig. 4). The conditions for compositing are simultaneous occurrence of MJO phases 4 or 5, and MJO amplitude in the 1–2 range during Non-El Niño winters. Total sample sizes for WQBO and EQBO years satisfying these conditions are 59 and 44 days, respectively. The significance of mean difference between WQBO and EQBO composites are obtained via a t-test, with the corresponding p-value shown at the top of each panel.
Fig. 6
Fig. 6. Impacts of Quasi-Biennial Oscillation (QBO)-associated temperature anomalies in the upper troposphere and lower stratosphere on the neutral buoyancy level (NBL) of non-entraining plumes.
Distributions of NBLs in the Maritime Continent (MC; 100°E−150°E, 15°S−5°N) domain for (a) westerly QBO (WQBO; orange) and (b) easterly QBO (EQBO; light blue) composite days. The Madden-Julian Oscillation (MJO) and El Niño-Southern Oscillation (ENSO) conditions for compositing are same to those in Fig. 5. The gray lines labeled T Modified show the distribution of NBL when the mean temperature difference of upper atmosphere (above 100 hPa) between EQBO and WQBO is either added to WQBO profiles (panel a) or subtracted from EQBO profiles (panel b). The small insert in each panel shows the percentage of NBL ≤100-hPa. The percentage values on the y-axis indicate the relative population to the total number of grid cells in the MC domain during the WQBO and EQBO composite days.
Fig. 7
Fig. 7. Comparison of column radiative flux convergence and outgoing longwave radiation (OLR) in deep convective systems within Madden-Julian oscillation (MJO) envelops between easterly Quasi-Biennial Oscillation (EQBO) and westerly QBO (WQBO) winters.
As Fig. 5, but for (ad) 24-h mean total (shortwave+longwave) radiative flux divergence and (eh) OLR. Positive values indicate a loss of energy from atmospheric column.
Fig. 8
Fig. 8. Seasonal variability of Quasi-Biennial Oscillation (QBO)-associated temperature anomalies in the upper troposphere and lower stratosphere.
Meridional (15°S−5°N) mean upper temperature differences between the Non-El Niño easterly QBO (EQBO) and westerly QBO (WQBO) conditions for the four seasons: (a) June–August, (b) September–November, (c) December–February, and (d) March–May. 50 and 100 hPa levels are highlighted with horizontal dash lines, while vertical dashed lines indicate the longitudinal boundaries of the Maritime Continent (MC) domain (100°E-150°E). The smaller panels on the right side show zonal mean temperature profile in the MC domain, WQBO (gray) and EQBO (black).
Fig. 9
Fig. 9. Seasonal variability of the population and height of deep convective systems.
Seasonal climatology of Core regimes in the case of Non-El Niño condition: (a, d, g, j) combined relative frequency of occurrence (RFO) of regimes 1 and 2, (b, e, h, k) mean cloud top pressure (CTP) of regime 1, and (c, f, i, l) mean CTP of regime 2, for (first row) June–August, (second row) September–November, (third row) December–February, and (bottom row) March–May. The black dashed line box delineates the Maritime Continent domain (100°E−150°E, 15°S−5°N).

References

    1. Madden RA, Julian PR. Detection of a 40–50 day oscillation in the zonal wind in the tropical Pacific. J. Atmos. Sci. 1971;28:702–708. doi: 10.1175/1520-0469(1971)028<0702:DOADOI>2.0.CO;2. - DOI
    1. Madden RA, Julian PR. Description of global-scale circulation cells in the tropics with a 40–50 day period. J. Atmos. Sci. 1972;29:1109–1123. doi: 10.1175/1520-0469(1972)029<1109:DOGSCC>2.0.CO;2. - DOI
    1. Maloney ED, Hartmann DL. Modulation of hurricane activity in the Gulf of Mexico by the Madden-Julian Oscillation. Science. 2000;287:2002–2004. doi: 10.1126/science.287.5460.2002. - DOI - PubMed
    1. Klotzbach PJ. The Madden–Julian Oscillation’s impacts on worldwide tropical cyclone activity. J. Clim. 2014;27:2317–2330. doi: 10.1175/JCLI-D-13-00483.1. - DOI
    1. Wheeler, M. C. & McBride, J. L. Australian-Indonesian monsoon. in Intraseasonal Variability in the Atmosphere-Ocean Climate System 125–173 10.1007/3-540-27250-X_5 (Springer Berlin Heidelberg, 2005).