. 2023 Jul 10;14(1):4062.
doi: 10.1038/s41467-023-39845-z.

Lysine methylation promotes NFAT5 activation and determines temozolomide efficacy in glioblastoma

Affiliations

Lysine methylation promotes NFAT5 activation and determines temozolomide efficacy in glioblastoma

Yatian Li et al. Nat Commun. .

Abstract

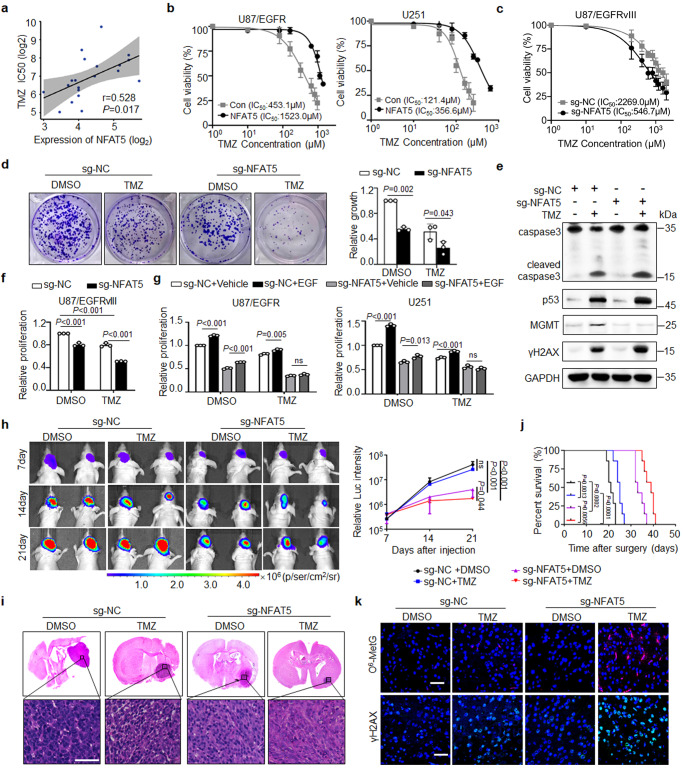
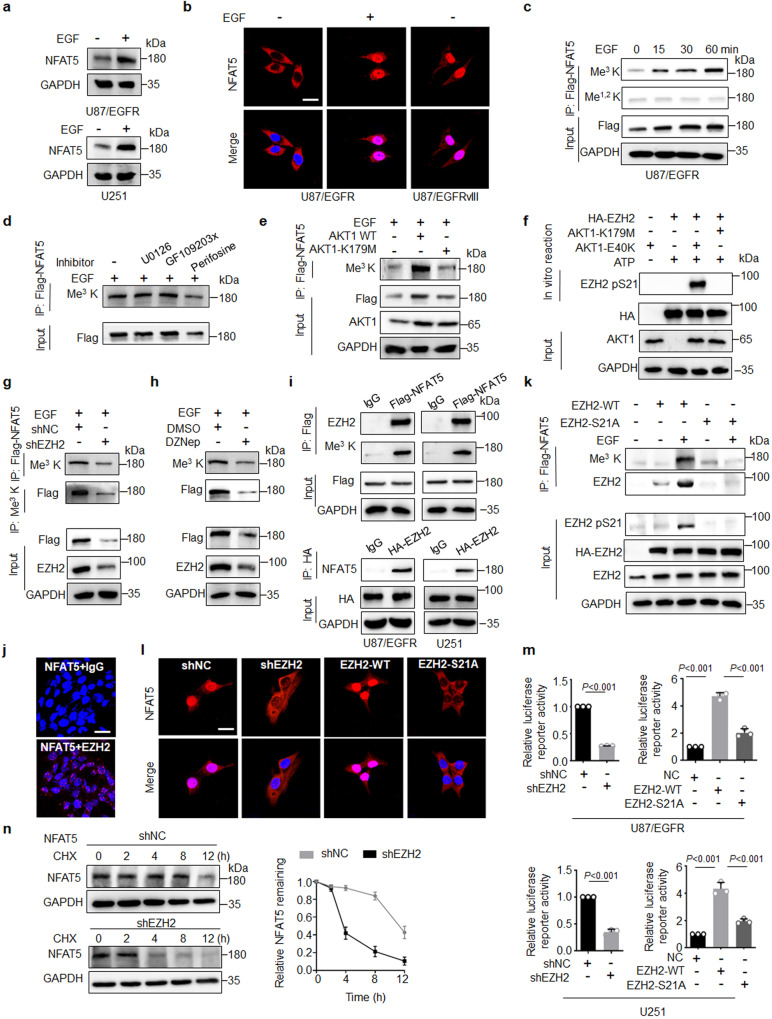
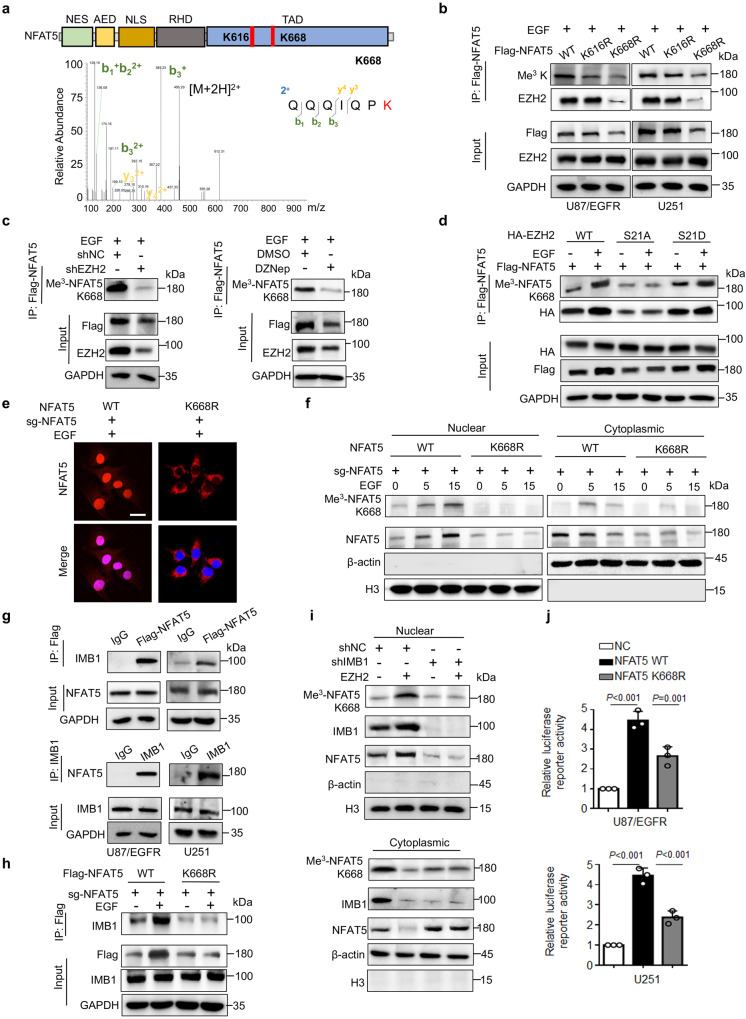
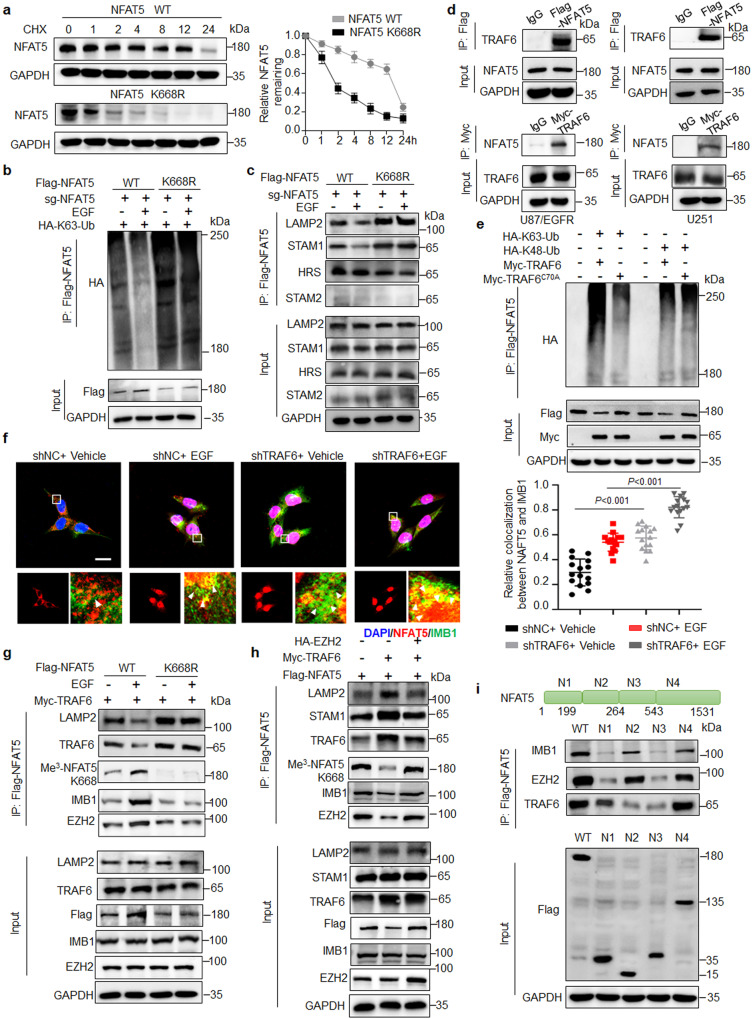
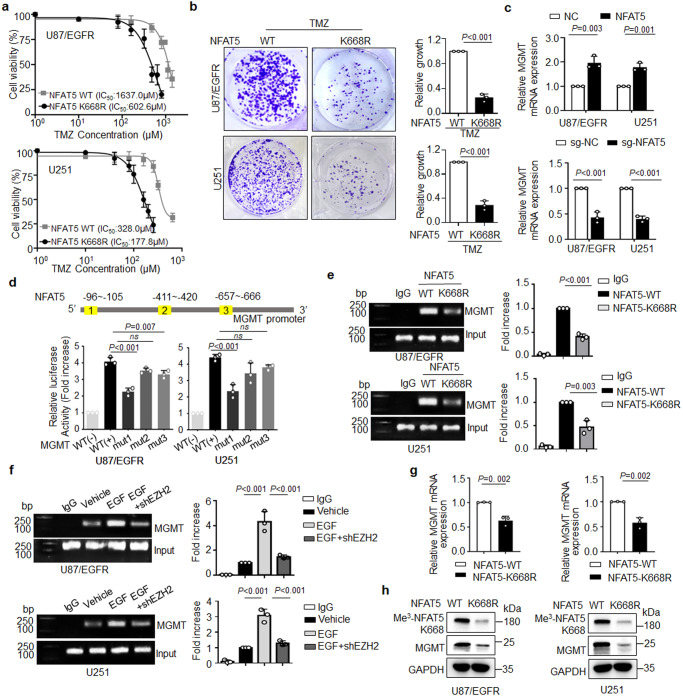
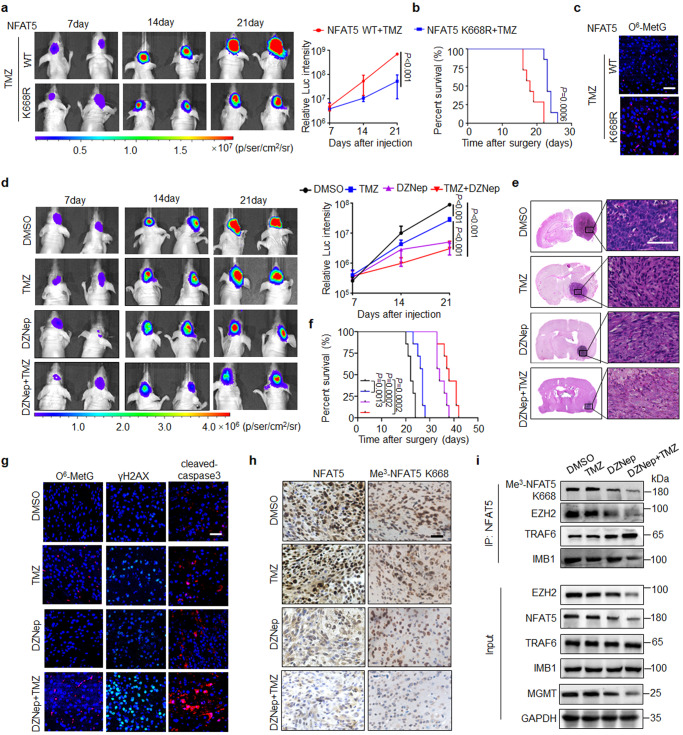
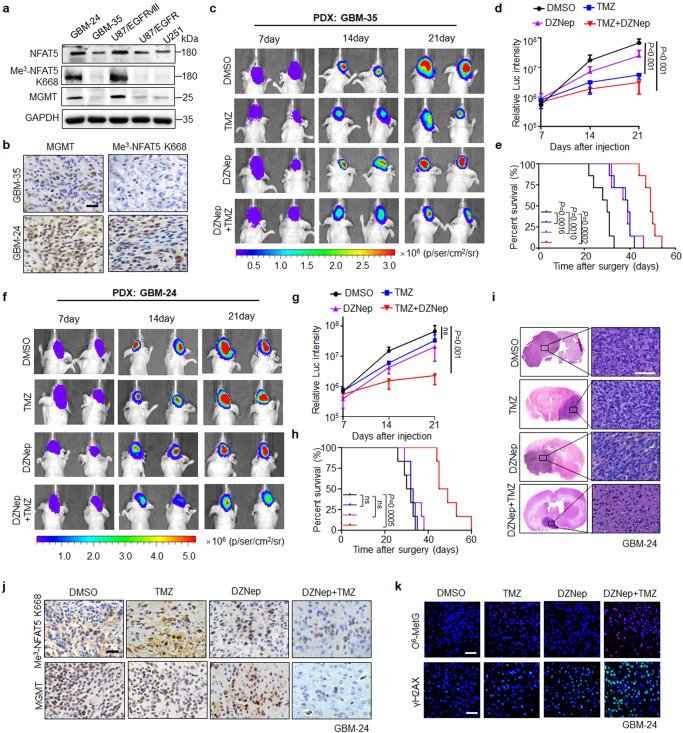
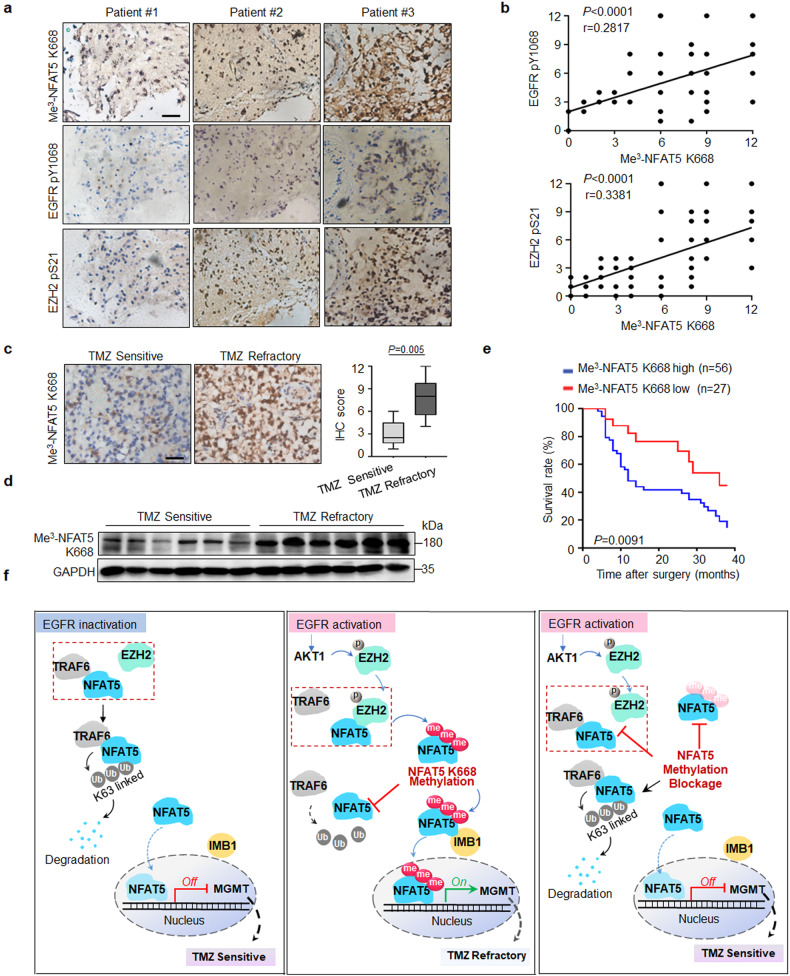
Temozolomide (TMZ) therapy offers minimal clinical benefits in patients with glioblastoma multiforme (GBM) with high EGFR activity, underscoring the need for effective combination therapy. Here, we show that tonicity-responsive enhancer binding protein (NFAT5) lysine methylation, is a determinant of TMZ response. Mechanistically, EGFR activation induces phosphorylated EZH2 (Ser21) binding and triggers NFAT5 methylation at K668. Methylation prevents NFAT5 cytoplasm interaction with E3 ligase TRAF6, thus blocks NFAT5 lysosomal degradation and cytosol localization restriction, which was mediated by TRAF6 induced K63-linked ubiquitination, resulting in NFAT5 protein stabilization, nuclear accumulation and activation. Methylated NFAT5 leads to the upregulation of MGMT, a transcriptional target of NFAT5, which is responsible for unfavorable TMZ response. Inhibition of NFAT5 K668 methylation improved TMZ efficacy in orthotopic xenografts and patient-derived xenografts (PDX) models. Notably, NFAT5 K668 methylation levels are elevated in TMZ-refractory specimens and confer poor prognosis. Our findings suggest targeting NFAT5 methylation is a promising therapeutic strategy to improve TMZ response in tumors with EGFR activation.


Conflict of interest statement

The authors declare no competing interests.

Figures

Fig. 1
Fig. 1. NFAT5 expression is upregulated in TMZ-resistant GBM specimens and positively correlates with p-EGFR expression.
a Representative immunohistochemical (IHC) staining of NFAT5 in tumorous and adjacent non-tumorous brain (NB) tissues of patients with glioma (NB: 8 cases; WHO 1/2: 12 cases; WHO 3: 16 cases; WHO 4: 55 cases). Scale bar: 100μm. IHC analysis of NFAT5 expression at different tumor stages (right). NB (Min = 1, Q1 = 1.25, Med = 2.5, Q3 = 3, Max = 4); WHO 1/2 (Min = 2, Q1 = 2.25, Med = 3.5, Q3 = 5.5, Max = 8); WHO 3 (Min = 3, Q1 = 4.5, Med = 6, Q3 = 8, Max = 9); WHO 4 (Min = 4, Q1 = 6, Med = 8, Q3 = 9, Max = 12). b Kaplan–Meier survival analysis of patients with glioma. c Survival analysis of patients with IDH wild-type GBM based on NFAT5 expression. d Upper, NFAT5 and EGFR pY1068 expression in glioma tissues (n = 83 samples) determine by IHC staining. Scale bar: 100μm. Bottom, The association between NFAT5 and EGFR pY1068 levels in glioma tissue. L, low; M, medium; H, high. e The NFAT5 and EGFR pY1068 levels in clinical GBM samples and paired adjacent non-tumorous tissue. N, normal; T, tumor. f Representative IHC staining of NFAT5 in TMZ sensitive and resistant GBM tissues (n = 12 samples). Scale bar: 100μm. TMZ sensitive (Min = 1, Q1 = 1.75, Med = 3, Q3 = 4.5, Max = 6); TMZ resistant (Min = 3, Q1 = 3.75, Q2 = 7, Q3 = 8.25, Max = 9). TMZ, Temozolomide. g The protein levels of NFAT5 and EGFR pY1068 in the TMZ sensitive and refractory GBM specimen. (e, g) n = 3 independent experiments. Significance was calculated (a) by one-way ANOVA with LSD-t; (d) by chi-square test; (f) by unpaired two-sided Student’s t test. Data were presented as mean ± standard deviation. Marker unit for Western blots is kDa. Source data are provided as a Source Data file.
Fig. 2
Fig. 2. NFAT5 drives EGFR-induced tumor growth and the failure of TMZ therapy.
a The association between NFAT5 expression and TMZ response from 20 GBM cell lines from the Genomics of Drug Sensitivity in Cancer (GDSC) database. b, c The effect of NFAT5 on TMZ efficacy at the indicated concentrations determined by CCK-8 assay. d Colony formation assay in U87/EGFRvIII cells expressing sg-NC or sg-NFAT5 with or without TMZ treatment (200 μM). DMSO, Dimethylsulfoxide. e The effect of NFAT5 on MGMT and cleaved caspase3 expression in U87/EGFR cells incubated with or without TMZ. f Knockout of NFAT5 reduced cell proliferation and enhanced TMZ efficacy (200 μM, 72 h) in U87/EGFRvIII cells. g Loss of NFAT5 attenuated EGFR activation-induced cell proliferation and TMZ refractory (200 μM, 72 h) in U87/EGFR and U251 cells. h The representative bioluminescence images of Balb/c nude mice with tumors derived from U87/EGFRvIII cells transfected with sg-NC or sg-NFAT5 treated with TMZ every week (n = 4 mice per group). i H&E-stained coronal brain sections of representative tumor xenograft (n = 7 mice/group). Scale bar: 100μm. j Survival of mice bearing U87/EGFRvIII tumors (n = 7 mice/group). k IF staining of O6-MetG and γH2AX in tumors derived from U87/EGFRvIII cells transfected with sg-NC or sg-NFAT5 treated with TMZ. n = 7 randomly captured field of view. Scale bar: 50 µm. (bk) n = 3 independent experiments. Significance was calculated by (a) Pearson test; (d, g) by unpaired student’s t test; (f) by one-way ANOVA with LSD-t; (h) by ANOVA of repeated measurement data; (j) by Log-rank (Mantel–Cox) test. Data were presented as mean ± standard deviation. Marker unit for Western blots is kDa. Source data are provided as a Source Data file.
Fig. 3
Fig. 3. EGF induces NFAT5 lysine methylation and activation dependent on EZH2.
a NFAT5 protein levels in U87/EGFR and U251 cells upon EGF stimulation. b IF staining the subcellular location of NFAT5 in U87/EGFRvIII cells and U87/EGFR cells with or without EGF treatment. Scale bar: 20 μm. One representative field of n = 30 independent cells was captured. c The effect of different incubation time of EGF treatment on the expression and lysine methylation levels of NFAT5 in U87/EGFR cells. d Levels of NFAT5 lysine methylation in U87/EGFR cells treated with 10 μM PKCα (GF109203X), 10 μM MEK1 (U0126), or 10 μM AKT1 (perifosine) inhibitors for 24 h followed by EGF (100 ng/mL) for 15 min. e AKT1 kinase activity was required for EGF induced NFAT5 tri-lysine methylation. U251 cells transduced with lentiviral vectors harboring Flag-tagged kinase-dead mutant AKT-K179M or AKT-WT sequences. f In vitro kinase assay revealed that AKT1-mediated EZH2 phosphorylation at Ser21 in U251 cells. g Knockdown of EZH2 by shRNA or a small molecule inhibitor (DZNep) treatment (h) reduced EGF-induced NFAT5 lysine methylation in U87/EGFR cells. DZNep, 3-Deazaneplanocin A. i Co-immunoprecipitation assay was performed to examine EZH2 as an interactor of NFAT5 in U87/EGFR and U251 cells. j The results of the in situ proximity ligation assay revealed the direct interaction between NFAT5 and EZH2 in U251 cells. Scale bar: 20μm. One representative field of n = 30 independent cells was captured. k EZH2 phosphorylation at Ser21 was critical for EZH2/NFAT5 interaction and NFAT5 methylation upon EGF stimulation. l IF staining of the subcellular location of NFAT5 transfected with shNC, shEZH2, EZH2-WT and EZH2-S21A in U251 cells treated with EGF. Scale bar: 20μm. One representative field of n = 30 independent cells was captured. m NFAT5 TAD reporter luciferase activity was measured in cells transfection with shNC, shEZH2 or NC, EZH2-WT and EZH2-S21A cells upon EGF treatment. n Degradation of NFAT5 was assessed by CHX treatment transfected with shNC or shEZH2 in U251 cell. Right, quantification of the NFAT5 intensity. an n = 3 independent experiments. Significance was calculated by (m) by one-way ANOVA with LSD-t. Data were presented as mean ± standard deviation. Marker unit for Western blots is kDa. Source data are provided as a Source Data file.
Fig. 4
Fig. 4. Methylation at K668 determines NFAT5 nuclear localization and activation.
a Identification of lysine methylation site of NFAT5 by LC-MS/MS, corresponding to one of two methylation sites, K668. b K668 (but not K616) mitigated EGF-induced NFAT5 tri-methylation and EZH2/NFAT5 interaction. c Knockdown of EZH2 by shRNA or DZNep mitigated EGF-induced NFAT5 K668 methylation in U87/EGFR cells. d Expression of Me3-NFAT5 K668 and the association between NFAT5 and EZH2 was analyzed in HA-tagged EZH2 WT, S21A, S21D expressing U251 cells. e IF staining the subcellular location of NFAT5 in U251 cells stably expressing NFAT5 WT or K668R mutant. Scale bar: 20μm. One representative field of n = 30 independent cells was captured. f The nuclear and cytosolic fractions of U87/EGFR cells expressing NFAT5 WT or K668R mutant treated with EGF at different time were subjected to immunoblotting analysis. g Co-IP assay was performed to examine IMB1 as an interactor of NFAT5 in the U87/EGFR and U251 cells. h The association of NFAT5 and IMB1 was examined in NFAT5 WT or K668R U87/EGFR cells in the presence of EGF or not. i The nuclear and cytosolic expression of NFAT5 and Me3-NFAT5 K668 was detected in EZH2 overexpressing cells transfected with shNC or shIMB1. j NFAT5 TAD reporter luciferase activity was measured in cells transfected with NFAT5 WT or K668R. (bj) n = 3 independent experiments. Significance was calculated by (j) one-way ANOVA with LSD-t. Data were presented as mean ± standard deviation. Marker unit for Western blots is kDa. Source data are provided as a Source Data file.
Fig. 5
Fig. 5. Methylation protects NFAT5 from ubiquitin-mediated lysosome degradation and cytosol restriction by attenuating its binding to E3 ligase TRAF6.
a Degradation of NFAT5 was assessed by CHX treatment in NFAT5 WT or K668R mutant expressing U87/EGFR cells. Right, quantification of the NFAT5 intensity. CHX, cycloheximide. b NFAT5 K63-linked ubiquitination and the association between NFAT5 and ESCRT-0 complex (c) were examined in U251 expressing NFAT5 WT and K668R mutant cells. d Co-IP analysis of the interaction between TRAF6 and NFAT5 in U87/EGFR and U251 cells. e TRAF6 activation was required for NFAT5 K63 but not K48-linked ubiquitination. f IF staining of NFAT5 subcellular distribution and co-localization between NFAT5 and IMB1 in shNC or shTRAF6 transfected U251 cells in the presence of EGF or not. Scale bar: 20μm. Quantitative results from 15 cells per group are reported. g The interaction between NFAT5 and TRAF6, EZH2, LAMP2 as well as IMB1 was examined in TRAF6 overexpressing cells in the absence or presence of EGF stimulation. h The association of NFAT5 with TRAF6, EZH2, LAMP2, STAM1 as well as IMB1 was examined in TRAF6 overexpressing cells in the absence or presence EZH2 transfection. i Identification of the essential domains required for interactions of NFAT5 with TRAF6, EZH2 and IMB1. Diagrammatic representation of NFAT5 and its truncated forms. ai n = 3 independent experiments. Marker unit for Western blots is kDa. Source data are provided as a Source Data file.
Fig. 6
Fig. 6. K668 methylation is required for NFAT5 induced limited TMZ efficacy by enhanced MGMT transcription.
a CCK-8 assay analysis revealed the effect of NFAT5 K668 methylation on TMZ efficacy at the indicated concentrations for 72 h. b Colony formation assay in cells expressing NFAT5 WT or K668R with TMZ treatment. c The effect of NFAT5 on MGMT mRNA levels in U87/EGFR and U251 cells. d The results of the dual-luciferase reporter assay revealed that MGMT was a direct transcriptional target of NFAT5. e ChIP assay demonstrated that NFAT5 K668R mutation reduced NFAT5 binding affinity to MGMT promoter, compare to the NFAT5 WT cells. f CHIP assay revealed that EZH2 knockdown by shRNA decreased the binding affinity of NFAT5 to the promoter of MGMT. g The mRNA and protein levels (h) of MGMT in U87/EGFR and U251 cells expressing NFAT5 WT or K668R mutation. ah n = 3 independent experiments. Significance was calculated by (b, c, g) unpaired Student’s t test; (d, e, f) by one-way ANOVA with LSD-t. Data were presented as mean ± standard deviation. Marker unit for Western blots is kDa. Marker size for CHIP is bp. Source data are provided as a Source Data file.
Fig. 7
Fig. 7. Inhibition of NFAT5 K668 methylation improves TMZ efficacy in vivo.
a The representative bioluminescent images of Balb/c nude mice harboring tumors derived from NFAT5 WT or K668R mutant-transfected U87/EGFRvIII cells treated with TMZ therapy every week (n = 4 mice per group). b Kaplan–Meier survival curves of mice shown in (a), n = 7 mice/group. c Representative images of IF staining of O6-MetG in tumors derived from NFAT5 WT or K668R mutant-transfected U87/EGFRvIII cells treated with TMZ therapy. n = 5 randomly captured field of view. Scale bar: 50 µm. d The representative bioluminescence images of mice bearing tumors from U87/EGFRvIII cells treated with TMZ, DZNep, alone or in combination (n = 4 mice per group). e Representative H&E-stained coronal brain sections of mice from experiment shown in (d). Scale bar: 100μm. f Survival of mice injected with TMZ, DZNep alone or in combination, n = 7 mice/group. g IF staining of O6-MetG, γH2AX and cleaved-caspase3 in tumors derived from U87/EGFRvIII cells treated with TMZ, DZNep, alone or in combination. n = 5 randomly captured field of view. Scale bar: 50 µm. h IHC staining of NFAT5 and Me3-NFAT5 K668 expression in the tumors from experiment shown in (d). Scale bar: 100μm. i Combination of TMZ and DZNep impaired the interaction between NFAT5 and EZH2 as well as IMB1. ai n = 2 independent experiments; Significance was calculated by (a, d) ANOVA of repeated measurement data; (b, f) by Log-rank (Mantel–Cox) test; Data were presented as mean ± standard deviation. Marker unit for Western blots is kDa. Source data are provided as a Source Data file.
Fig. 8
Fig. 8. NFAT5 K668 methylation status predicts TMZ efficacy in PDX models.
a The protein expression of NFAT5, Me3-NFAT5-K668 and MGMT in two PDX GBM cells lines, GBM-24 and GBM-35. b IHC staining of Me3-NFAT5-K668 and MGMT in tumors from mice orthotopically xenografted with GBM-35 and GBM-24 cells. Scale bar: 100μm. c Representative bioluminescent images of nude mice harboring GBM-35 tumors (n = 4 mice per group). d Tumor burden examined by bioluminescence imaging. e Kaplan–Meier survival curves of mice shown in (c), n = 7 mice/group. f Effects of TMZ, DZNep, alone or in combination on tumor growth in mice harboring GBM-24 derived tumors. g Tumor burden examined by bioluminescence imaging (n = 4 mice per group). h Kaplan–Meier survival curves of mice shown in (f), n = 6 mice/group. i, H&E-stained coronal brain sections of mice from experiment shown in (f). Scale bar: 100μm. j IHC staining of Me3-NFAT5 K668 and MGMT expression in the GBM-24 tumors from each group. Scale bar: 100μm. k IF staining of O6-MetG and γH2AX in tumors derived from GBM-24 cells treated with TMZ, DZNep, alone or in combination. Scale bar: 50 µm. a n = 3 independent experiments; (ac, e, f, hk) n = 2 independent experiments; Significance was calculated by (d, g) ANOVA of repeated measurement data; (e, h) by Log-rank (Mantel–Cox) test; Data were presented as mean ± standard deviation. Marker unit for Western blots is kDa. Source data are provided as a Source Data file.
Fig. 9
Fig. 9. NFAT5 K668 methylation is positively correlated with EGFR pY1068 and EZH2 pS21 expression, TMZ refractory and poor prognosis in patients with GBM.
a IHC staining of Me3-NFAT5 K668, EZH2 pS21 and EGFR pY1068 expression in glioma specimens (n = 83 samples). Scale bar: 100μm. b IHC stains were scored and the correlation was carried out by Pearson correlation test. c Representative IHC-staining of Me3-NFAT5 K668 in TMZ-sensitive and resistant GBM tissues (n = 12 samples). Scale bar: 100μm. TMZ sensitive (Min = 1, Q1 = 1.75; Med = 2.5; Q3 = 4.5 Max = 6); TMZ resistant (Min = 4, Q1 = 5.5, Med = 8, Q3 = 9.75, Max = 12). d Protein expression of Me3-NFAT5 K668 in TMZ sensitive and resistant clinical GBM samples. e Kaplan–Meier survival analysis of patients. Overall survival of patients with high Me3-NFAT5 K668 expression was shorter. f A proposed model illustrating lysine methylation of NFAT5 drives tumor progression and TMZ refractoriness in GBM. NFAT5 undergoes K668 methylation by EZH2 upon EGF stimulation, resulting in NFAT5 nuclear translocation and activation. Methylation disrupts NFAT5 binding to E3 ligase TRAF6, which is crucial for NFAT5 K63-linked ubiquitination mediated lysosomal degradation and cytosol localization restriction, leading to NFAT5 stabilization, nuclear accumulation and activation. Nuclear NFAT5 increased the induction of MGMT, a transcriptional target of NFAT5, which is required for unfavorable TMZ response. This suggests the development of strategies involving NFAT5 K668 methylation blockage for enhancing TMZ response in GBM. (d) n = 3 independent experiments; Significance was calculated by (b) Pearson test, two-sided; (c) by unpaired two-sided Student’s t test. Data were presented as mean ± standard deviation. Marker unit for Western blots is kDa. Source data are provided as a Source Data file.

References

    1. Stupp R, et al. Effects of radiotherapy with concomitant and adjuvant temozolomide versus radiotherapy alone on survival in glioblastoma in a randomised phase III study: 5-year analysis of the EORTC-NCIC trial. Lancet Oncol. 2009;10:459–466. doi: 10.1016/S1470-2045(09)70025-7. - DOI - PubMed
    1. Alifieris C, Trafalis DT. Glioblastoma multiforme: pathogenesis and treatment. Pharmacol. Ther. 2015;152:63–82. doi: 10.1016/j.pharmthera.2015.05.005. - DOI - PubMed
    1. Rimkus TK, et al. NEDD4 degrades TUSC2 to promote glioblastoma progression. Cancer Lett. 2022;531:124–135. doi: 10.1016/j.canlet.2022.01.029. - DOI - PMC - PubMed
    1. Wang C, Yu M, Zhang W. Neoantigen discovery and applications in glioblastoma: an immunotherapy perspective. Cancer Lett. 2022;550:215945. doi: 10.1016/j.canlet.2022.215945. - DOI - PubMed
    1. He ZC, et al. HOXA5 is amplified in glioblastoma stem cells and promotes tumor progression by transcriptionally activating PTPRZ1. Cancer Lett. 2022;533:215605. doi: 10.1016/j.canlet.2022.215605. - DOI - PubMed

Publication types