. 2023 Jul 10;14(1):4066.
doi: 10.1038/s41467-023-39920-5.

ARIH1 activates STING-mediated T-cell activation and sensitizes tumors to immune checkpoint blockade

Affiliations

ARIH1 activates STING-mediated T-cell activation and sensitizes tumors to immune checkpoint blockade

Xiaolan Liu et al. Nat Commun. .

Abstract

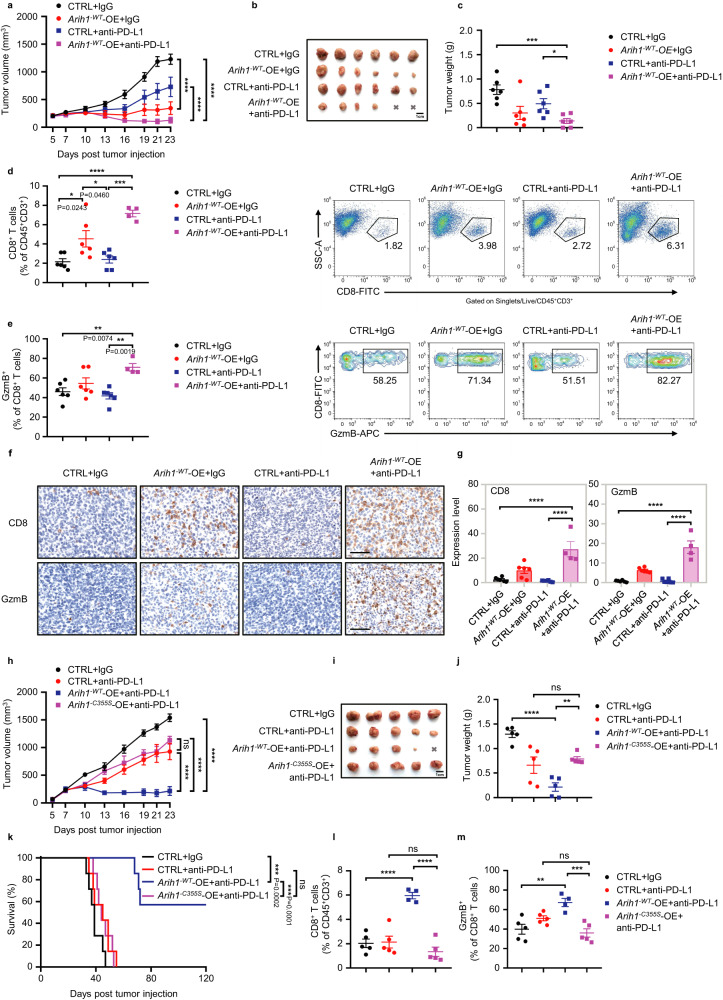
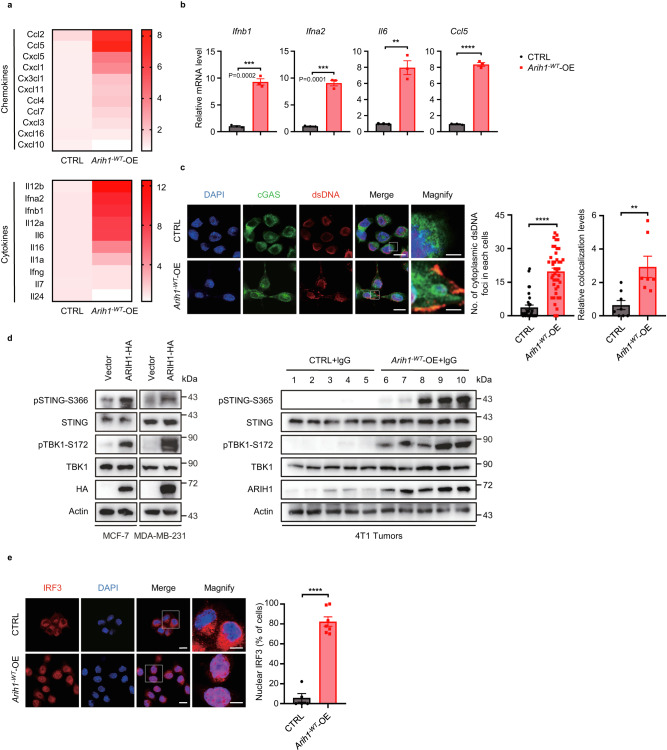
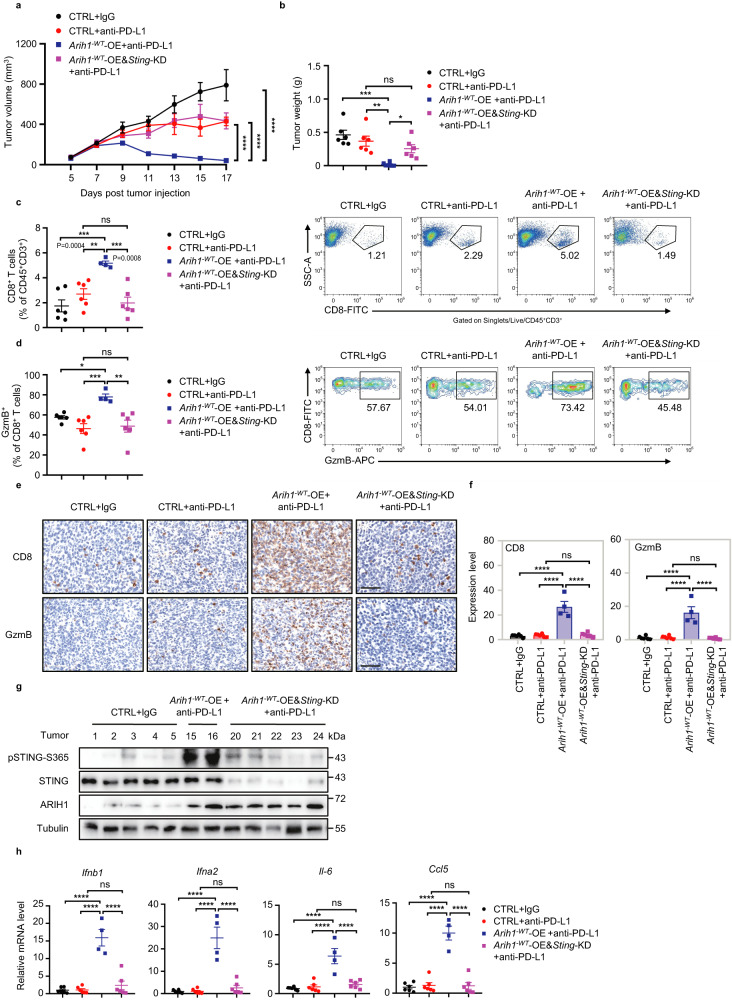
Despite advances in cancer treatment, immune checkpoint blockade (ICB) only achieves complete response in some patients, illustrating the need to identify resistance mechanisms. Using an ICB-insensitive tumor model, here we discover cisplatin enhances the anti-tumor effect of PD-L1 blockade and upregulates the expression of Ariadne RBR E3 ubiquitin-protein ligase 1 (ARIH1) in tumors. Arih1 overexpression promotes cytotoxic T cell infiltration, inhibits tumor growth, and potentiates PD-L1 blockade. ARIH1 mediates ubiquitination and degradation of DNA-PKcs to trigger activation of the STING pathway, which is blocked by the phospho-mimetic mutant T68E/S213D of cGAS protein. Using a high-throughput drug screen, we further identify that ACY738, less cytotoxic than cisplatin, effectively upregulates ARIH1 and activates STING signaling, sensitizing tumors to PD-L1 blockade. Our findings delineate a mechanism that tumors mediate ICB resistance through the loss of ARIH1 and ARIH1-DNA-PKcs-STING signaling and indicate that activating ARIH1 is an effective strategy to improve the efficacy of cancer immunotherapy.


Conflict of interest statement

The authors declare no competing interests.

Figures

Fig. 1
Fig. 1. ARIH1 accumulates after treatment of 4T1 tumor models with a combination of cisplatin and anti-PD-L1 antibody.
a, b Tumor growth curves and tumor weights upon subcutaneous injection of 5 × 105 4T1 cells into female BALB/c mice (6–8 week old) treated with vehicle, cisplatin alone, anti-PD-L1 alone and cisplatin+anti-PD-L1. n = 6 mice/group. Data represent means ± SEM. a **P < 0.01 (P = 0.0052), ****P < 0.0001. b **P < 0.01 (P = 0.0014), ***P < 0.001 (P = 0.0007), ****P < 0.0001. c The survival curves of tumor bearing mice with indicated treatments. n = 7 mice/group. Log-rank test, *P < 0.05 (P = 0.0351), **P < 0.01 (P = 0.0023). d, e. Representative images of tumor CD8 and GzmB IHC staining of the mice as in (a). The percent of each expression pattern was quantified (e). Scale bar, 60 μm. n = 6 mice/group. Data represent means ± SEM, ***P < 0.001 (P = 0.0002), ****P < 0.0001. f Representative ARIH1 IHC staining for tumors of the mice as in (a). The percent of expression pattern was quantified. Scale bar, 60 μm. n = 6 mice/group. Data represent means ± SEM, *P < 0.05 (P = 0.0233). g Immunoblots analysis of the ARIH1 protein levels in the indicated tumor lysates of mice as in (a). h–j Tumor growth, final tumor image and tumor weights of Ctrl-KD and Arih1-KD 4T1 cells in female BALB/c mice (n = 7 per group, 6–8 week old) with indicated treatments. Data represent means ± SEM. h **P < 0.01, ****P < 0.0001. j *P < 0.05, ****P < 0.0001, ns, not significant. Data shown in a and h are representative of three independent experiments. For a, h data, Two-way ANOVA test. For b, e, j data, One-way ANOVA test. For f data, Two-tailed t-test. Source data are provided as a Source Data file.
Fig. 2
Fig. 2. ARIH1 enhances anti-PD-L1 antibody-induced anti-tumor immunity in 4T1 tumor models.
a Tumor growth curves in female BALB/c mice (6–8 week old) with control (CTRL) and Arih1-overexpressing (Arih1-WT-OE) tumors treated with PD-L1 or isotype mAbs intraperitoneally (i.p.) starting on day 7 and then every three days after subcutaneous inoculation of 5 × 105 4T1 cells. n = 6 mice/group. Data represent means ± SEM, ****P < 0.0001. b, c Representative image of tumors and tumor weights of tumor bearing mice at Day25 with the indicated treatments. n = 6 mice/group. Data represent means ± SEM, *P < 0.05 (P = 0.0134), ***P < 0.001 (P = 0.0002). d, e Representative figures and quantification of tumor infiltrating CD8+ T cells and CD8+GzmB+ T cells of the mice as in a. n = 6, 6, 6, 4 mice/group. Data represent means ± SEM. d *P < 0.05, ***P < 0.001 (P = 0.0001), ****P < 0.0001. e **P < 0.01. f, g Representative images of tumor CD8 and GzmB IHC staining of mice as in a. The percent of each expression pattern was quantified (g). Scale bar, 60 μm. n = 6, 6, 6, 4 mice/group. Data represent means ± SEM, ****P < 0.0001. h–j Representative tumor growth, image of tumors, and tumor weights in female BALB/c mice (6–8 week old) bearing CTRL, Arih1-WT-OE, and Arih1-C355S-OE 4T1 tumors with the indicated treatments. n = 5 mice/group. Data represent means ± SEM. h ****P < 0.0001, ns, not significant. j **P < 0.01 (P = 0.0059), ****P < 0.0001, ns, not significant. k. The survival curves for mice (n = 7 per group) with the indicated treatments. Log-rank test, ***P < 0.001, ns, not significant. l, m Quantification of FACS data for tumor infiltrating CD8+ T cells and CD8+GzmB+ T cells of mice as in h. n = 5, 5, 4, 5 mice/group. Data represent means ± SEM, **P < 0.01 (P = 0.0020), ***P < 0.001 (P = 0.0006), ****P < 0.0001, ns, not significant. Data shown in a and h are representative of three independent experiments. For a, h data, Two-way ANOVA test. For d, e, g, j, l, m data, One-way ANOVA test. For c data, Two-tailed t-test. Source data are provided as a Source Data file.
Fig. 3
Fig. 3. ARIH1 promotes the STING pathway activation.
a Heatmap for the qRT-PCR expression data of genes for 10 cytokines and 11 chemokines in CTRL and Arih1-WT-OE 4T1 tumors (n = 3 per group). b qRT-PCR analysis for the gene expression of Ifnb1, Ifna2, Il-6, and Ccl5 as in a. n = 3 per group. Data represent means ± SEM, **P < 0.01 (P = 0.0013), ***P < 0.001, ****P < 0.0001. c Immunofluorescence analysis of dsDNAs and cGAS in CTRL and Arih1-WT-OE 4T1 cells. The nuclei were stained with DAPI. Representative confocal images and quantitative data are shown. CTRL group (n = 31 cells), Arih1-WT-OE group (n = 43 cells). Scale bar, 10 μm; insets: Scale bar, 2 μm. Data represent means ± SEM, **P < 0.01 (P = 0.0042), ****P < 0.0001. d Immunoblots of markers in the STING pathway including total and phospho STING (S366 sites for human; S365 sites for mouse), total and phospho TBK1(S172) in lysates collected from breast cell lines (MCF-7 and MDA-MB-231) and 4T1 tumors (from Fig. 2a) with indicated treatments. e Immunofluorescent staining of IRF3 in CTRL and Arih1-WT-OE 4T1 cells and their quantifications. The nuclei were stained with DAPI. Scale bar, 10 μm; insets: Scale bar, 5 μm. Data represent means ± SEM, ****P < 0.0001. Each dot in the graph represents the percentage of counted nucleus IRF3 cells in each sample, and the total number of counted cells in each group is as follows: CTRL group (n = 135 cells), Arih1-WT-OE group (n = 147 cells). For b, c, e data, Two-tailed t-test. Data shown in c–e are representative of three independent experiments. Source data are provided as a Source Data file.
Fig. 4
Fig. 4. Knockdown of STING reverses the anti-tumor effect of ARIH1- enhanced PD-L1 blockade therapy.
a, b Representative tumor growth curves and final tumor weights of tumors (including CTRL, Arih1-WT-OE, and Arih1-WT-OE&Sting-KD) in female BALB/c mice (6–8 week old) with the indicated treatments after subcutaneous injection of 5 × 105 4T1 cells. n = 6 mice/group. Data represent means ± SEM. a ****P < 0.0001. b *P < 0.05 (P = 0.0492), **P < 0.01 (P = 0.0027), ***P < 0.001 (P = 0.0002), ns, not significant. c, d Representative figures and summary of frequency of tumor infiltrating CD8+ T cells and GzmB+CD8+ T cells of the mice as in a. n = 6, 6, 4, 6 mice/group. Data represent means ± SEM. c **P < 0.01 (P = 0.0083), ***P < 0.001, ns, not significant. d *P < 0.05 (P = 0.0341), **P < 0.01 (P = 0.0022), ***P < 0.001 (P = 0.0010), ns, not significant. e, f CD8 and GzmB IHC staining were performed in tumors of the mice as in a. The percent of each expression pattern was quantified f. Scale bar, 60 μm. n = 6, 6, 4, 6 mice/group. Data represent means ± SEM, ****P < 0.0001, ns, not significant. g Immunoblot analysis of pSTING-S365, STING, and ARIH1 in indicated tumor lysates for the experiment described in a. h qRT-PCR measurement of ISGs for the tumors of the mice as in a. n = 6, 6, 4, 6 mice/group. Data represent means ± SEM, ****P < 0.0001, ns, not significant. For a data, Two-way ANOVA test. For b–d, f, and h data, One-way ANOVA test. Source data are provided as a Source Data file.
Fig. 5
Fig. 5. ARIH1-mediated degradation of DNA-PKcs promotes STING pathway activation.
a HEK293T cells were transfected with ARIH1-WT-HA or ARIH1-C357S-HA for 36 h. Proteins that co-immunoprecipitated (Co-IP) with ARIH1 were analyzed by mass spectrometry. DNA repair-related proteins are shown in heatmap. b Co-IP of ARIH1 with DNA-PKcs in HEK293T cells. Endogenous DNA-PKcs was immunoprecipitated using anti-DNA-PKcs, and the immunoprecipitates were analyzed with anti-ARIH1. lgG, immunoglobulin G. c Immunoblot (IB) analysis for ubiquitination of DNA-PKcs from HEK293T cells co-transfected with the indicated constructs. d In vitro ubiquitination assay of purified DNA-PKcs. The reactions were performed with purified His-ubiquitin, GST-UBA1 (E1), His-UBCH7 (E2), and GST-ARIH1-WT or its ligase-dead mutant (GST-ARIH1-C357S) or in the absence of UBA1, UBCH7, ubiquitin, ARIH1 or DNA-PKcs. e, f. IB analysis of DNA-PKcs levels in U2OS cells. The cells were incubated with small interfering RNAs (siRNAs) against ARIH1 (f), or transfected with ARIH1-HA (e). g IB analysis of DNA-PKcs in U2OS cells transfected with the indicated constructs. Cells were treated by MG132, Bafilomycin or NH4Cl+Leup for 6 h. h Immunofluorescent staining of DNA-PKcs and Lamp2 in CTRL and Arih1-WT-OE 4T1 cells and their quantifications. The nuclei were stained with DAPI. Scale bar, 10 μm; insets: Scale bar, 2 μm. Data represent means ± SEM, ****P < 0.0001. Each dot in the graph represents the percentage of counted cells with co-localization in each sample, and the total number of counted cells in each group is as follows: CTRL group (n = 381 cells), Arih1-WT-OE group (n = 321 cells). i IB analysis of pSTING-S366, pTBK1-S172 and DNA-PKcs in HEK293T-STING cells co-transfected the indicated constructs. j cGAS-KD MCF-7 cells were transfected with cGAS WT or the phosphorylation-mimic mutants and ARIH1-HA. WCLs were analyzed by immunoblotting. k qRT-PCR measurement of ISGs expression in cGAS-KD HeLa cells transfecting with cGAS WT or the phosphorylation-mimic mutants and ARIH1-HA. IFNB1 (n = 3/group), IFNA2 (n = 3/group), IL6 (n = 4/group). Data represent means ± SEM, ***P < 0.001 (P = 0.0002), ****P < 0.0001. In e–g, the numbers under the blots represent the gray scale quantification (DNA-PKcs/Actin). For k data, One-way ANOVA test. For h data, Two-tailed t-test. Data shown in b, c, e–h, and j, k are representative of two independent experiments. Data shown in a, d and i are representative of three independent experiments. Source data are provided as a Source Data file.
Fig. 6
Fig. 6. The small molecule ACY738 increases ARIH1 protein levels and enhances PD-L1 blockade therapy in 4T1 tumor models.
a High-throughput screening of 8207 drug or drug candidates was performed to screen for ARIH1 enhancers that increase ARIH1 levels. After treatment with the drugs at 5 μM for 24 h, luciferase as a reporter to detect ARIH1 protein levels following exposing to the substrate (10 μM) in 384-well plates. Hit compounds are shown as red dots. b Immunoblots (IB) analysis for the ARIH1 levels in MDA-MB-231 and 4T1 cells treated with 1 µM ACY738 at the indicated time points. The numbers under the blots represent the gray scale quantification (ARIH1/Actin and ARIH1/Tubulin). c Tumor growth curves from subcutaneous injection of 5 × 105 4T1 cells in the female BALB/c mice (6–8 week old) treated with vehicle, anti-PD-L1 alone, ACY738 alone, and ACY738+anti-PD-L1. n = 6 mice/group. Data represent means ± SEM, **P < 0.01 (P = 0.0012), ***P < 0.001 (P = 0.0005), ****P < 0.0001. d–f. Representative image, final tumor weights, and survival curves of tumor bearing mice with the indicated treatments. n = 6 mice/group. Data represent means ± SEM, e *P < 0.05 (P = 0.0151), ***P < 0.001 (P = 0.0010). Log-rank test (f), *P < 0.05 (P = 0.0200), **P < 0.01. g, h Representative images and quantification of spontaneous lung metastases and lung weights of BALB/c mice (6–8 week old) at day 16 with the indicated treatments after intravenous injection of 1 × 105 4T1 cells. Scale bar, 400 μm. n = 5 mice/group. Data represent means ± SEM, **P < 0.01, ***P < 0.001 (P = 0.0008), ****P < 0.0001. i Quantification of tumor-infiltrating CD8+ T cells of the mice as in c. n = 6 mice/group. Data represent means ± SEM, **P < 0.01 (P = 0.0018), ***P < 0.001. j, k The CD8 and GzmB IHC staining (j) was performed in tumors of the mice as in c. The percent of each expression pattern was quantified (k). Scale bar, 60 μm. n = 6 mice/group. Data represent means ± SEM, ***P < 0.001, ****P < 0.0001. l IB analysis of total and phospho STING (S365), total and phospho TBK1(S172), and ARIH1 in tumor lysates of the mice as in c. For c data, Two-way ANOVA test. For e, h-i, and k data, One-way ANOVA test. Data shown in a, b and i are representative of three independent experiments. Source data are provided as a Source Data file.

References

    1. Morad G, Helmink BA, Sharma P, Wargo JA. Hallmarks of response, resistance, and toxicity to immune checkpoint blockade. Cell. 2021;184:5309–5337. doi: 10.1016/j.cell.2021.09.020. - DOI - PMC - PubMed
    1. Swann JB, Smyth MJ. Immune surveillance of tumors. J. Clin. Invest. 2007;117:1137–1146. doi: 10.1172/JCI31405. - DOI - PMC - PubMed
    1. Ribas A, Wolchok JD. Cancer immunotherapy using checkpoint blockade. Science. 2018;359:1350–1355. doi: 10.1126/science.aar4060. - DOI - PMC - PubMed
    1. Kitichotkul K, et al. Expression of PD-L1 is HPV/P16-independent in oral squamous cell carcinoma. Heliyon. 2022;8:e10667. doi: 10.1016/j.heliyon.2022.e10667. - DOI - PMC - PubMed
    1. Yap TA, et al. Efficacy and safety of pembrolizumab in patients with advanced mesothelioma in the open-label, single-arm, phase 2 KEYNOTE-158 study. Lancet Respir. Med. 2021;9:613–621. doi: 10.1016/S2213-2600(20)30515-4. - DOI - PubMed

Publication types