. 2023 Jul 10;14(1):4059.
doi: 10.1038/s41467-023-39748-z.

nnSVG for the scalable identification of spatially variable genes using nearest-neighbor Gaussian processes

Affiliations

nnSVG for the scalable identification of spatially variable genes using nearest-neighbor Gaussian processes

Lukas M Weber et al. Nat Commun. .

Abstract

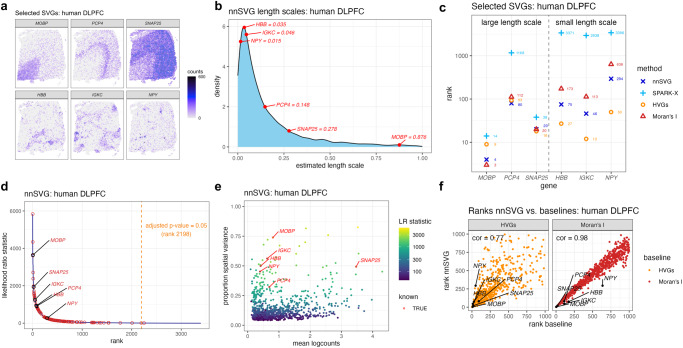
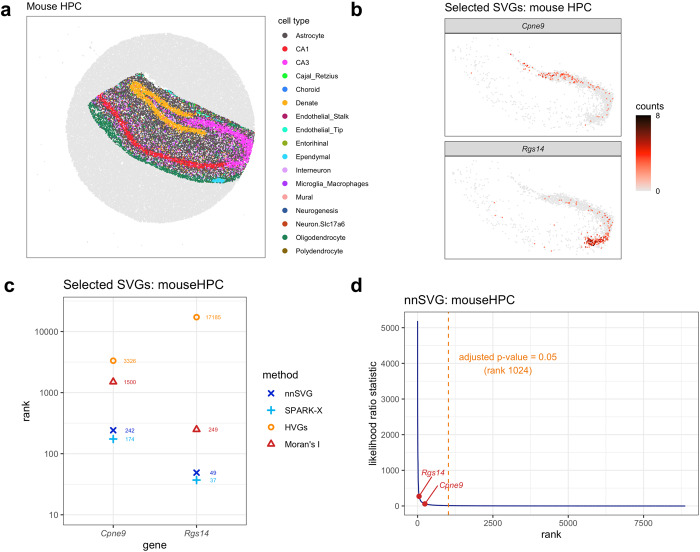
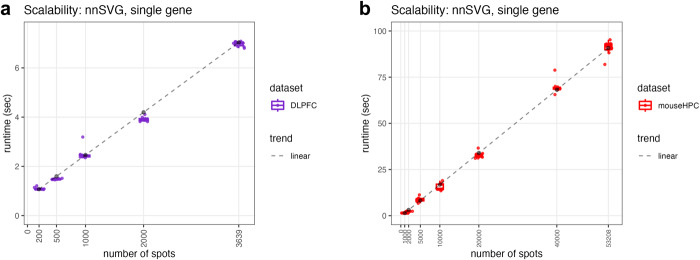
Feature selection to identify spatially variable genes or other biologically informative genes is a key step during analyses of spatially-resolved transcriptomics data. Here, we propose nnSVG, a scalable approach to identify spatially variable genes based on nearest-neighbor Gaussian processes. Our method (i) identifies genes that vary in expression continuously across the entire tissue or within a priori defined spatial domains, (ii) uses gene-specific estimates of length scale parameters within the Gaussian process models, and (iii) scales linearly with the number of spatial locations. We demonstrate the performance of our method using experimental data from several technological platforms and simulations. A software implementation is available at https://bioconductor.org/packages/nnSVG .


Conflict of interest statement

The authors declare no competing interests.

Figures

Fig. 1
Fig. 1. nnSVG recovers biologically informative SVGs with gene-specific length scale parameters.
Using the Visium human DLPFC dataset, nnSVG, SPARK-X, HVGs, and Moran’s I were applied to identify SVGs. a Spatial expression plots of 6 known biologically informative SVGs, including cortical layer-associated SVGs (top row) and blood- and immune-associated SVGs (bottom row). b Distribution of estimated gene-specific length scale parameters from nnSVG, with the 6 SVGs from (a) labeled in red. The blood- and immune-associated SVGs have smaller estimated length scale parameters than the cortical layer-associated SVGs. c Rank order of the 6 SVGs from (a) within the lists of top SVGs. Dashed vertical line divides the genes into the 3 cortical layer-associated SVGs with large length scales (left) and the 3 blood- and immune-associated SVGs with small length scales (right). d Estimated likelihood ratio (LR) statistic from nnSVG (y-axis) compared to the rank per gene (x-axis), with the 6 SVGs from (a) labeled, and 134 additional known layer-specific marker genes (from manually guided analyses by Maynard et al.) highlighted (red circles). Orange dashed vertical line indicates rank cutoff for statistically significant SVGs at a multiple-testing-adjusted p-value of 0.05 using LR test with 2 degrees of freedom. e Estimated effect size (proportion of spatial variance) along y-axis compared to the mean log-transformed normalized counts (logcounts) along x-axis for top 1000 SVGs from nnSVG, with the 6 SVGs from (a) labeled, and estimated LR statistic per gene indicated with color scale. f Ranks of top 1000 SVGs from nnSVG (y-axis) compared to ranks from baseline methods (x-axis) using HVGs (nonspatial baseline method, left) and Moran’s I (spatially-aware baseline method, right), with SVGs from (a) highlighted (black circles), and Spearman correlation (text labels).
Fig. 2
Fig. 2. nnSVG recovers biologically informative SVGs within spatial domains.
Using the Slide-seqV2 mouse hippocampus (HPC) dataset, nnSVG, SPARK-X, HVGs, and Moran’s I were applied to identify SVGs within an a priori defined spatial domain. a Computationally labeled cell types per spot (bead) with labels from ref. . b Spatial expression plots of 2 known biologically informative SVGs identified by Cable et al. showing spatial gradients of expression within the spatial domain defined by CA3 cell type labels (pink points in (a)). c Rank order of the 2 SVGs from (b) within the lists of top SVGs. d Estimated likelihood ratio (LR) statistic from nnSVG (y-axis) compared to the rank per gene (x-axis), with the 2 SVGs from (b) highlighted. Orange dashed vertical line indicates rank cutoff for statistically significant SVGs at a multiple-testing-adjusted p-value of 0.05 using LR test with 2 degrees of freedom.
Fig. 3
Fig. 3. nnSVG scales linearly with the number of spatial locations.
The runtime in seconds (y-axis) of nnSVG on a single gene (run n = 10 times on a single processor core) using downsampled numbers of spots (x-axis) with two transcriptome-wide datasets, a Visium human DLPFC and b Slide-seqV2 mouse HPC, without quality control or filtering of spots. The dashed lines represent linear trends in scalability for each dataset. Boxplots show medians, first and third quartiles, and whiskers extending to the furthest values no more than 1.5 times the interquartile range from each quartile.

References

    1. Ståhl PL, et al. Visualization and analysis of gene expression in tissue sections by spatial transcriptomics. Science. 2016;353:78–82. doi: 10.1126/science.aaf2403. - DOI - PubMed
    1. 10x Genomics. 10x Genomics Visium Spatial Gene Expression Solution (2022).
    1. Rodriques SG, et al. Slide-seq: a scalable technology for measuring genome-wide expression at high spatial resolution. Science. 2019;363:1463–1467. doi: 10.1126/science.aaw1219. - DOI - PMC - PubMed
    1. Stickels RR, et al. Highly sensitive spatial transcriptomics at near-cellular resolution with Slide-seqV2. Nat. Biotechnol. 2020;39:313–319. doi: 10.1038/s41587-020-0739-1. - DOI - PMC - PubMed
    1. Eng C-HL, et al. Transcriptome-scale super-resolved imaging in tissues by RNA seqFISH+ Nature. 2019;568:235–239. doi: 10.1038/s41586-019-1049-y. - DOI - PMC - PubMed

Publication types