. 2023 Jul 10;13(1):11134.
doi: 10.1038/s41598-023-37824-4.

Performance investigation of state-of-the-art metaheuristic techniques for parameter extraction of solar cells/module

Affiliations

Performance investigation of state-of-the-art metaheuristic techniques for parameter extraction of solar cells/module

Abhishek Sharma et al. Sci Rep. .

Abstract

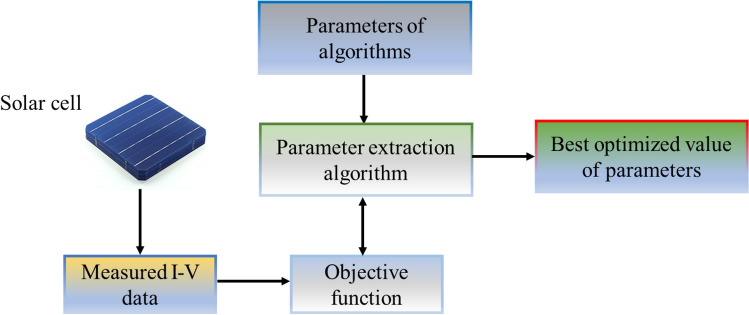
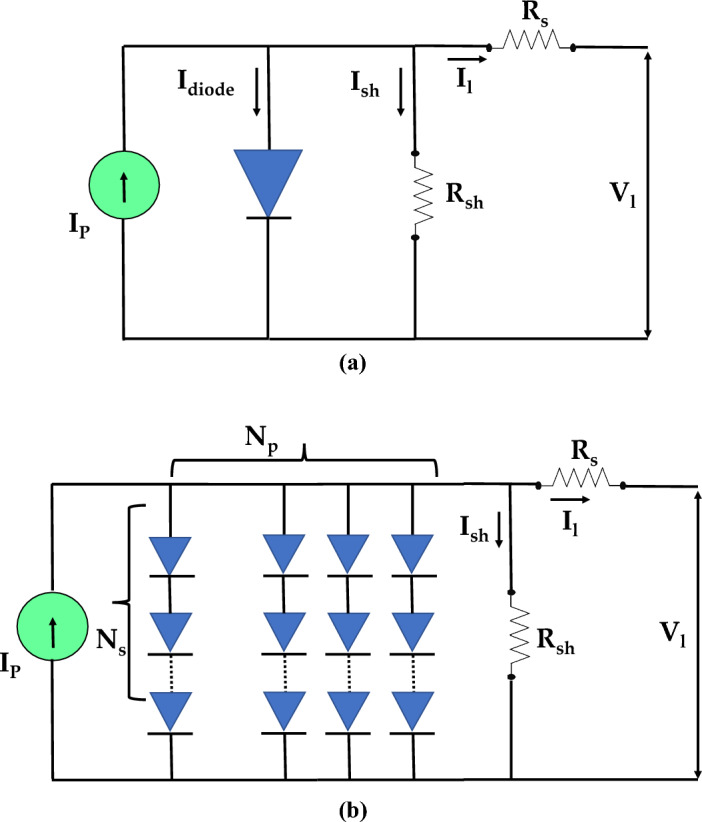
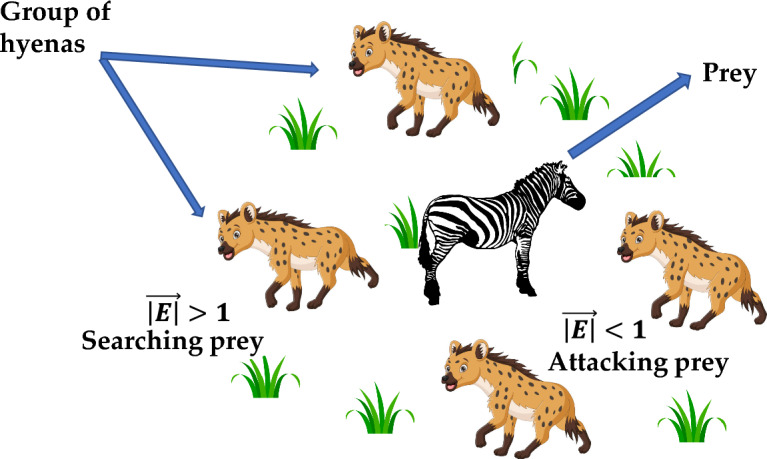
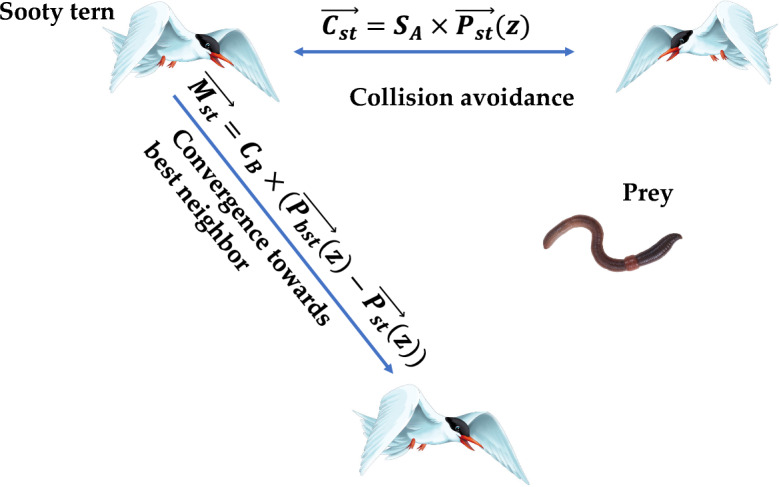
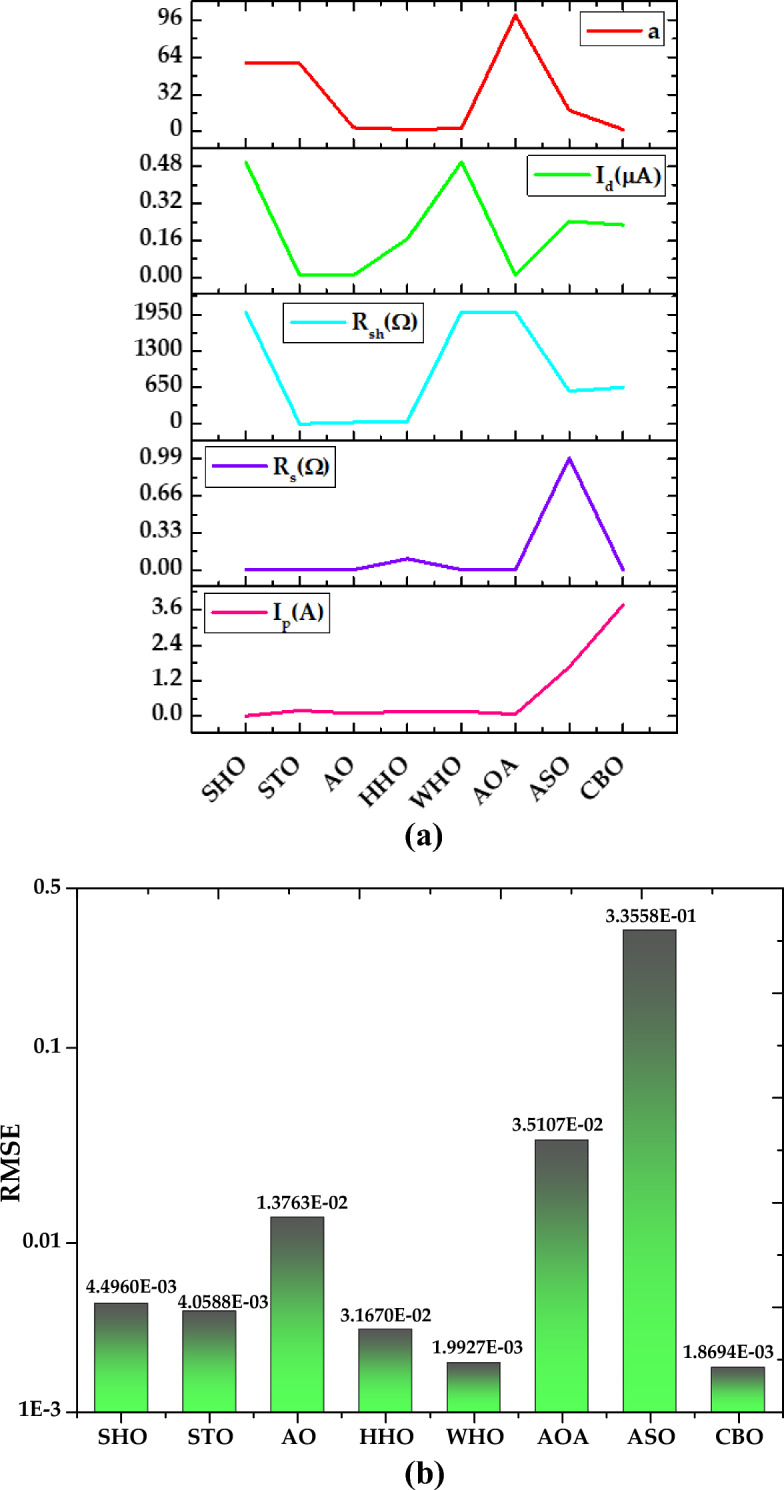
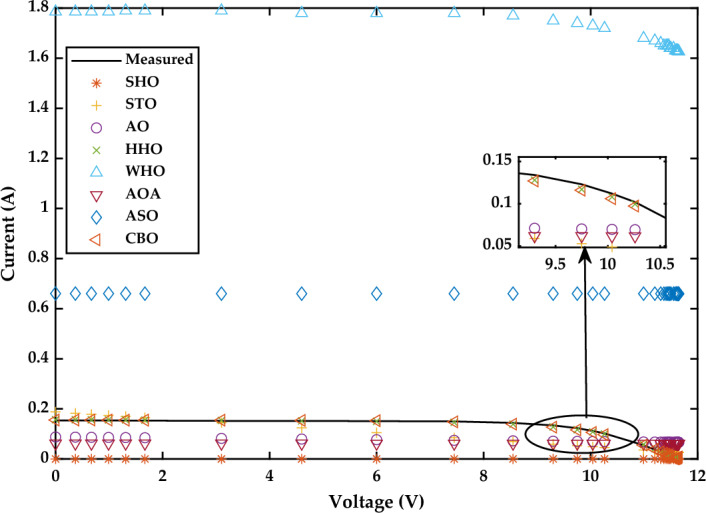
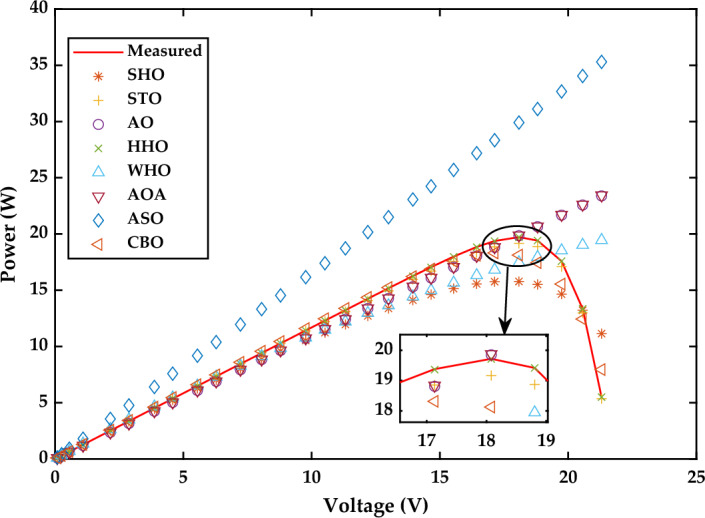
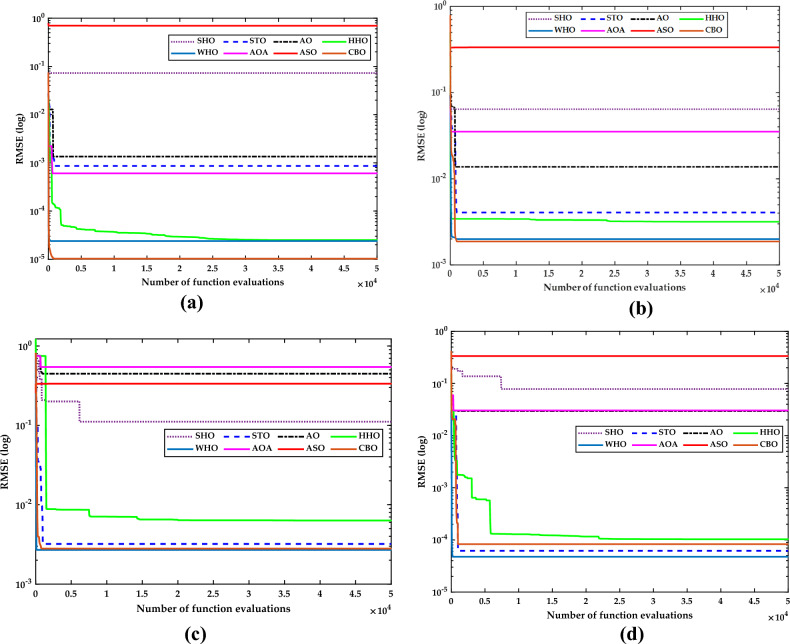
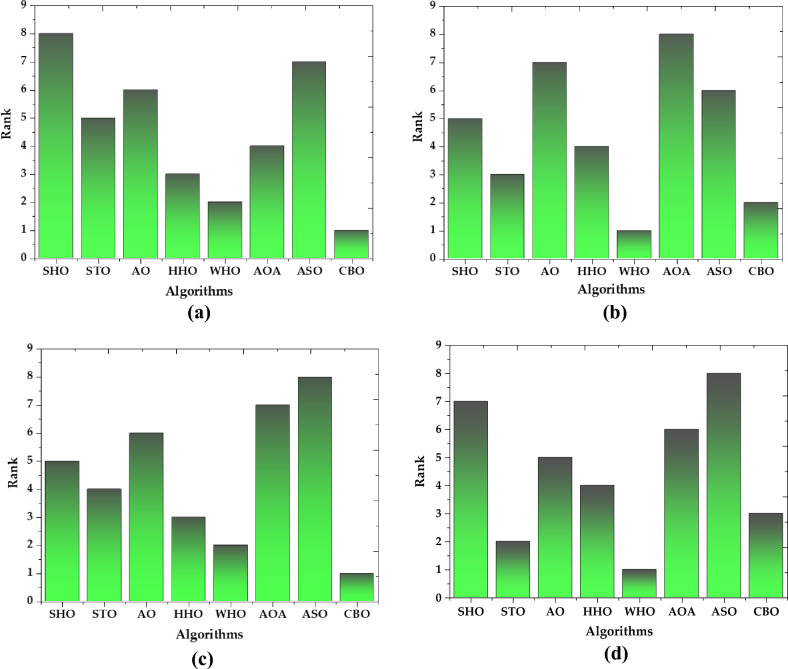
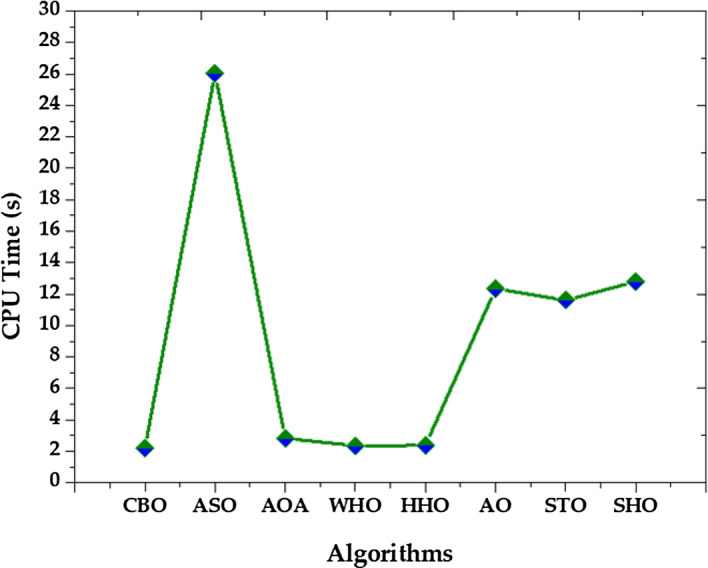
One of the greatest challenges for widespread utilization of solar energy is the low conversion efficiency, motivating the needs of developing more innovative approaches to improve the design of solar energy conversion equipment. Solar cell is the fundamental component of a photovoltaic (PV) system. Solar cell's precise modelling and estimation of its parameters are of paramount importance for the simulation, design, and control of PV system to achieve optimal performances. It is nontrivial to estimate the unknown parameters of solar cell due to the nonlinearity and multimodality of search space. Conventional optimization methods tend to suffer from numerous drawbacks such as a tendency to be trapped in some local optima when solving this challenging problem. This paper aims to investigate the performance of eight state-of-the-art metaheuristic algorithms (MAs) to solve the solar cell parameter estimation problem on four case studies constituting of four different types of PV systems: R.T.C. France solar cell, LSM20 PV module, Solarex MSX-60 PV module, and SS2018P PV module. These four cell/modules are built using different technologies. The simulation results clearly indicate that the Coot-Bird Optimization technique obtains the minimum RMSE values of 1.0264E-05 and 1.8694E-03 for the R.T.C. France solar cell and the LSM20 PV module, respectively, while the wild horse optimizer outperforms in the case of the Solarex MSX-60 and SS2018 PV modules and gives the lowest value of RMSE as 2.6961E-03 and 4.7571E-05, respectively. Furthermore, the performances of all eight selected MAs are assessed by employing two non-parametric tests known as Friedman ranking and Wilcoxon rank-sum test. A full description is also provided, enabling the readers to understand the capability of each selected MA in improving the solar cell modelling that can enhance its energy conversion efficiency. Referring to the results obtained, some thoughts and suggestions for further improvements are provided in the conclusion section.


Conflict of interest statement

The authors declare no competing interests.

Figures

Figure 1
Figure 1
Process flow diagram of parameter estimation of solar cell.
Figure 2
Figure 2
Equivalent circuit of SDM used to represent (a) solar cell (b) PV panel.
Figure 3
Figure 3
Searching and attacking behaviour of Spotted hyena.
Figure 4
Figure 4
Process flow diagram of SHO algorithm.
Figure 5
Figure 5
Searching behavior of sooty tern optimization algorithm.
Figure 6
Figure 6
Process flow diagram of STO algorithm.
Figure 7
Figure 7
Searching behaviour of aquila optimization algorithm.
Figure 8
Figure 8
Process flow diagram of AO algorithm.
Figure 9
Figure 9
Searching behaviour of Harris Hawk optimizer.
Figure 10
Figure 10
Process flow diagram of HHO algorithm.
Figure 11
Figure 11
Process flow diagram of WHO algorithm.
Figure 12
Figure 12
Searching mechanism of Arithmetic Optimization.
Figure 13
Figure 13
Process flow diagram of AOA algorithm.
Figure 14
Figure 14
Process flow diagram of ASO algorithm.
Figure 15
Figure 15
Searching mechanism of coot birds.
Figure 16
Figure 16
Process flow diagram of CBO algorithm.
Figure 17
Figure 17
Simulation results for R.T.C. France solar cell (a) optimized value of all parameters (b) RMSE value.
Figure 18
Figure 18
I–V Characteristics curve of simulated and experimental values by different optimization techniques for single diode model of R.T.C. France solar cell.
Figure 19
Figure 19
P–V Characteristics curve of simulated and experimental values by different optimization techniques for single diode model of R.T.C. France solar cell.
Figure 20
Figure 20
Simulation results for Solarex MSX-60 PV module (1000 W/m2, 25 °C) (a) optimized value of all parameters (b) RMSE value.
Figure 21
Figure 21
I–V Characteristics curve of simulated and experimental values by different optimization techniques for single diode model of Solarex MSX-60 PV module at STC.
Figure 22
Figure 22
P–V Characteristics curve of simulated and experimental values by different optimization techniques for single diode model of Solarex MSX-60 PV module at STC.
Figure 23
Figure 23
Simulation results for Leibold PV module (LSM 20) (360 W/m2, 24 °C) (a) optimized value of all parameters (b) RMSE value.
Figure 24
Figure 24
I–V Characteristics curve of simulated and experimental values by different optimization techniques for single diode model of Leibold solar module (LSM 20).
Figure 25
Figure 25
Simulation results for SS2018 PV module (a) optimized value of all parameters at 1000 W/m2 (b) optimized value of all parameters at 870 W/m2 (c) optimized value of all parameters at 720 W/m2.
Figure 26
Figure 26
RMSE value for SS2018 PV module at (a) 1000 W/m2 (b) 870 W/m2 (c) 720 W/m2.
Figure 27
Figure 27
I–V Characteristics curve of simulated and experimental values by different optimization techniques for single diode model of SS2018P PV module at 1000 W/m2.
Figure 28
Figure 28
P–V Characteristics curve of simulated and experimental values by different optimization techniques for single diode model of SS2018P PV module at 1000 W/m2.
Figure 29
Figure 29
Convergence plot for (a) R.T.C. France solar cell (b) LSM20 PV module (c) Solarex MSX-60 PV module (d) SS2018 PV module.
Figure 30
Figure 30
Friedman mean rank of all algorithms for (a) R.T.C. France solar cell (b) Solarex MSX-60 PV module (c) LSM20 PV module (d) SS2018 PV module.
Figure 31
Figure 31
Comparison of computation time for all algorithms.

References

    1. Lim WM. The sustainability pyramid: A hierarchical approach to greater sustainability and the United Nations sustainable development goals with implications for marketing theory, practice, and public policy. Australas. Mark. J. 2022;30(2):142–150. doi: 10.1177/18393349211069152. - DOI
    1. Beck, J. V. and Arnold, K. J. Parameter estimation in engineering and science: (James Beck, 1977).
    1. Krishan O, Suhag S. An updated review of energy storage systems: Classification and applications in distributed generation power systems incorporating renewable energy resources. Int. J. Energy Res. 2019;43(12):6171–6210. doi: 10.1002/er.4285. - DOI
    1. Naeijian M, et al. Parameter estimation of PV solar cells and modules using Whippy Harris Hawks optimization algorithm. Energy Rep. 2021;7:4047–4063. doi: 10.1016/j.egyr.2021.06.085. - DOI
    1. Ritchie, R. H. and Gregory, K. J. Emerging Leaders in Pharmacology and Translational Science Special Issue Editorial. p. 1–3 (ACS Publications, 2020). - PMC - PubMed