. 2023 Jul 10;14(1):4071.
doi: 10.1038/s41467-023-39722-9.

Combined multidimensional single-cell protein and RNA profiling dissects the cellular and functional heterogeneity of thymic epithelial cells

Affiliations

Combined multidimensional single-cell protein and RNA profiling dissects the cellular and functional heterogeneity of thymic epithelial cells

Fabian Klein et al. Nat Commun. .

Abstract

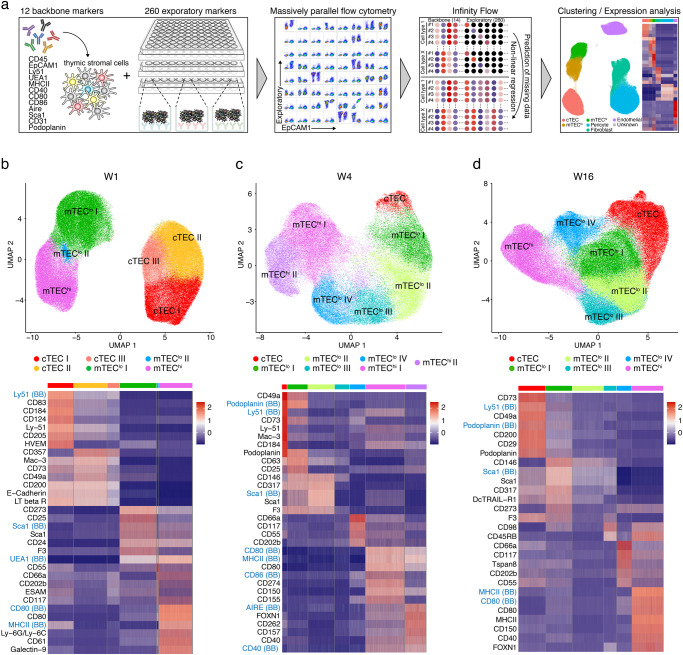
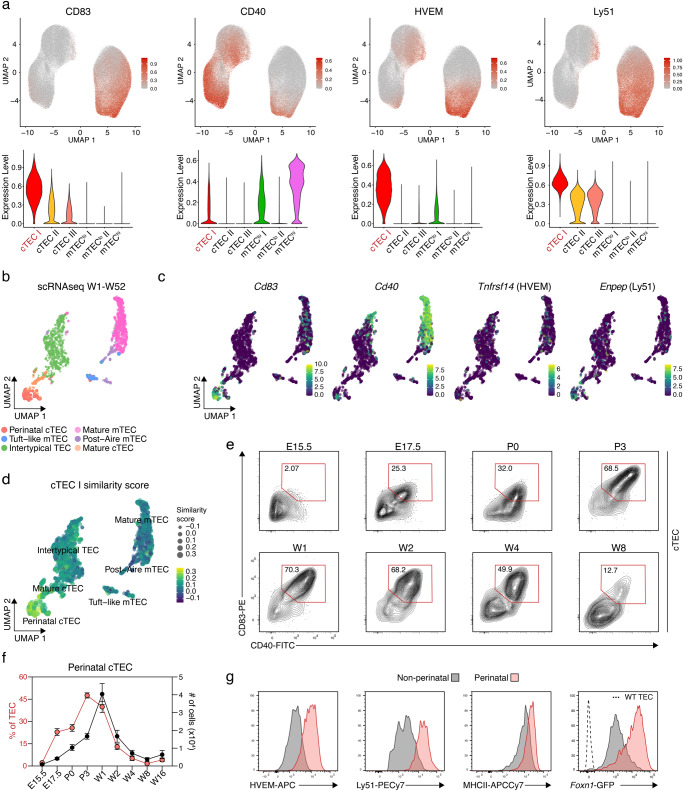
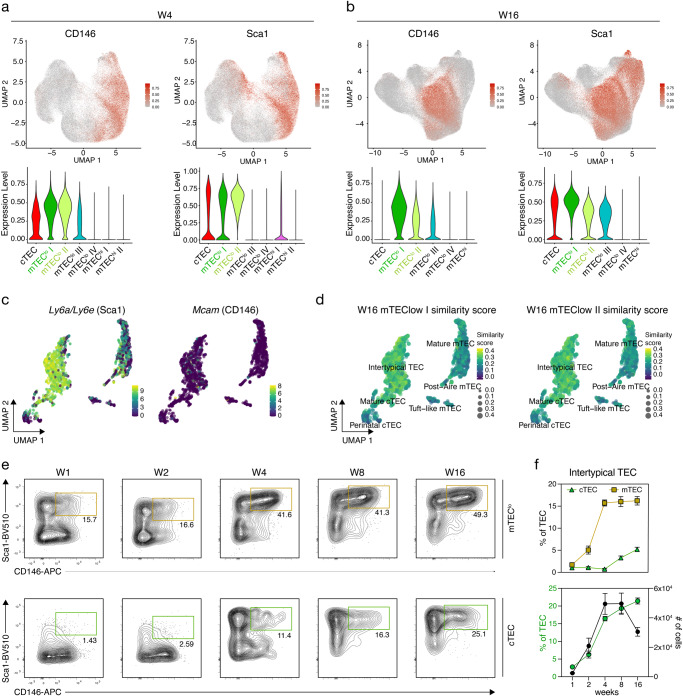
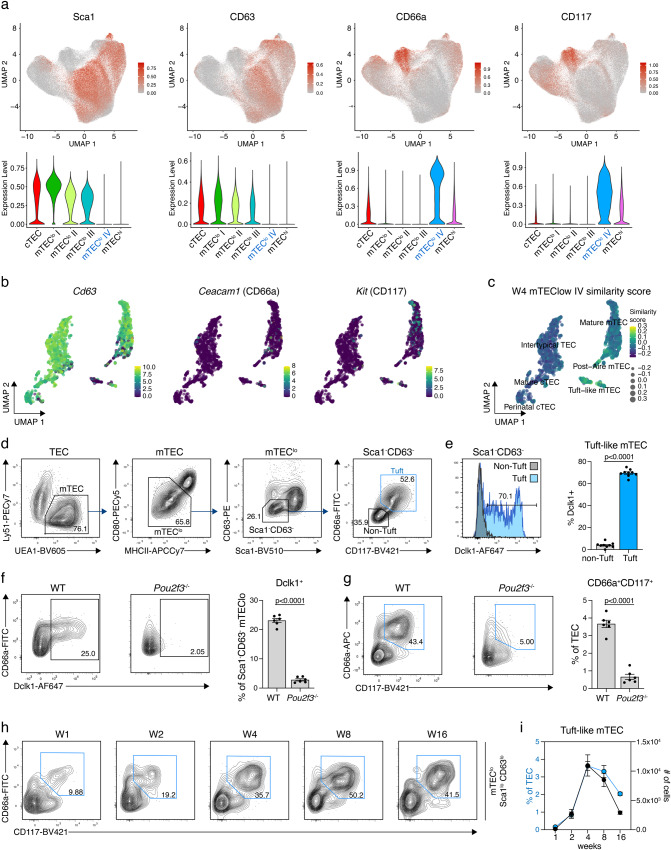
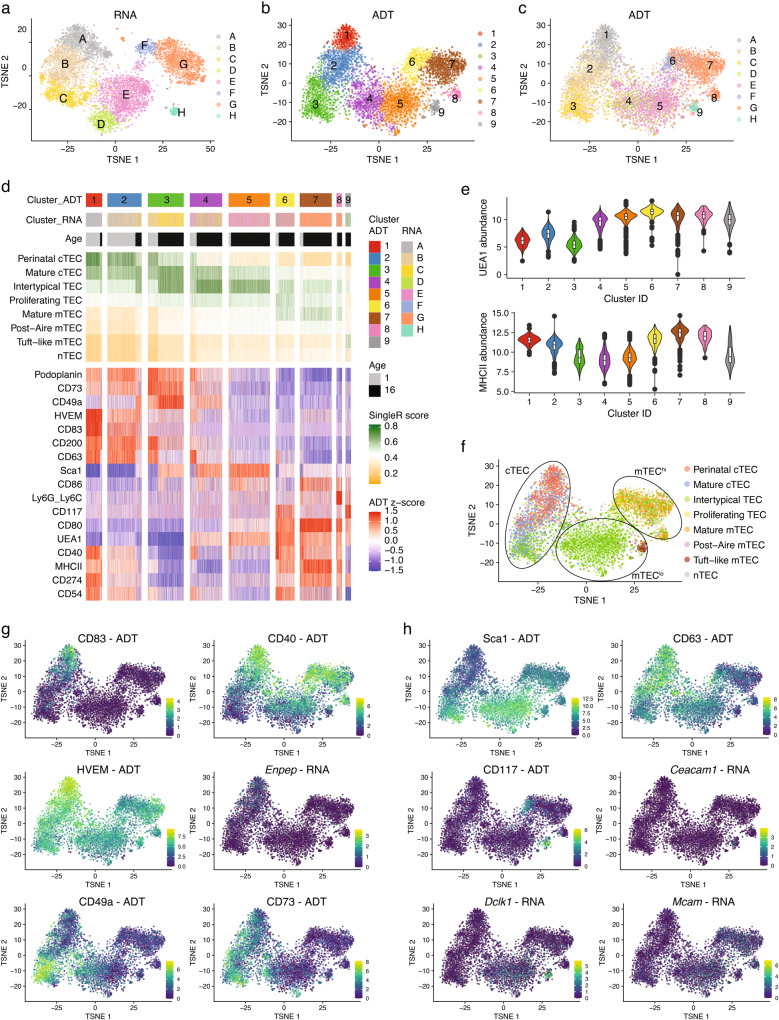
The network of thymic stromal cells provides essential niches with unique molecular cues controlling T cell development and selection. Recent single-cell RNA sequencing studies have uncovered previously unappreciated transcriptional heterogeneity among thymic epithelial cells (TEC). However, there are only very few cell markers that allow a comparable phenotypic identification of TEC. Here, using massively parallel flow cytometry and machine learning, we deconvoluted known TEC phenotypes into novel subpopulations. Using CITEseq, these phenotypes were related to corresponding TEC subtypes defined by the cells' RNA profiles. This approach allowed the phenotypic identification of perinatal cTEC and their physical localisation within the cortical stromal scaffold. In addition, we demonstrate the dynamic change in the frequency of perinatal cTEC in response to developing thymocytes and reveal their exceptional efficiency in positive selection. Collectively, our study identifies markers that allow for an unprecedented dissection of the thymus stromal complexity, as well as physical isolation of TEC populations and assignment of specific functions to individual TEC subtypes.


Conflict of interest statement

The authors declare no competing interests.

Figures

Fig. 1
Fig. 1. Infinity Flow analysis reveals TEC heterogeneity.
a Schematic illustration of the surface marker screening pipeline. bd Infinity Flow analysis was used to impute the expression of surface markers on TEC (CD45-EpCAM1+) derived from thymi of (b) 1- (n = 23), (c) 4- (n = 7), and (d) 16-week-old (n = 12) mice. Hierarchical clustering analysis was performed on (b) 182123, (c) 92402, and (d) 183124 TEC, respectively, and projected in a two-dimensional space using UMAP (top panels; 6–7 clusters were obtained per timepoint). Each colour represents a specific cluster as indicated. Heatmaps (bottom panels) display the expression of the top 7 markers upregulated in each cluster (log fold-change > 0.2). Backbone (BB) markers have a blue font.
Fig. 2
Fig. 2. Surface expression profile of perinatal cTEC.
a UMAP graphs (top panels) and violin plots (bottom panels) illustrating the expression of CD83, CD40, HVEM, and Ly51 on TEC from 1-week-old mice. Colour gradient indicates expression levels in the UMAP graphs and colours in the violin plots represent the different clusters, as defined in Fig. 1b. b Hierarchical clustering analysis was performed on scRNAseq data obtained from TEC derived from 1-, 4-, 16-, 32, and 52-week-old mice and projected in a two-dimensional space using UMAP. c UMAP graphs illustrating the scaled expression of Cd83, Cd40, Tnfrsf14 (HVEM), and Enpep (Ly51). Colour gradient indicates expression levels. d UMAP graph illustrating the similarity score of the cTEC I cluster from the 1-week Infinity Flow dataset to each cell of the scRNAseq reference dataset, based on the surface protein expression levels imputed by Infinity Flow. e, f Abundance of a CD83+CD40+Sca1 population (hereafter perinatal cTEC) within cTEC (CD45EpCAM1+UEA1) was analysed at the indicated timepoints in WT C57BL/6 mice. Shown are (e) representative FACS plots of CD83 and CD40 expression and (f) cumulative data depicting the percent of perinatal cTEC within TEC as well as their total cell numbers (E15.5 n = 13, E17.5 n = 7, P0 n = 6, P3 n = 8, W1 n = 7, W2 n = 7 (percent of TEC) or n = 6 (number of cells), W4 n = 5, W8 n = 5, W16 n = 8, from 2 to 3 independent experiments per timepoint). Data are presented as mean values +/− SEM. Source data are provided as a Source Data file. E = embryonic day; P = postnatal day; W = postnatal week. g Representative histograms showing the expression of HVEM, Ly51, MHCII, and Foxn1-GFP within perinatal (CD83+CD40+Sca1) and non-perinatal (CD83CD40) cTEC in 2-week-old C57BL/6 WT (HVEM, Ly51, MHCII, and Foxn1-GFP) and Foxn1GFP (Foxn1-GFP) mice.
Fig. 3
Fig. 3. Identification of intertypical TEC within cTEC and mTEC.
a, b UMAP graphs (top panels) and violin plots (bottom panels) illustrating the expression of CD146 and Sca1 on TEC from (a) 4- and (b) 16-week-old mice. Colour gradient indicates expression levels in the UMAP graphs and colours in the violin plots represent the different clusters, as defined in Fig. 1b. c UMAP graphs illustrating the scaled expression of Ly6a/Ly6e (Sca1) and Mcam (CD66a) in the scRNAseq dataset introduced in Fig. 2b. Colour gradient indicates expression levels. d UMAP graph illustrating the similarity score of the mTEClo I and mTEClo II clusters from the 16-week Infinity Flow dataset to each cell of the scRNAseq reference dataset, based on the surface protein expression levels imputed by Infinity Flow. e, f Abundance of a Sca1 and CD146 double positive population (hereafter intertypical TEC) within mTEClo (e; top panels) and within cTEC (e; bottom panels) was analysed at the indicated timepoints in C57BL/6 WT mice (for gating see Supplementary Fig. 4b). Shown are (e) representative FACS plots and (f) cumulative data for the percent of intertypical TEC within mTEC and cTEC (top panel) (W1 n = 4, W2 n = 6, W4 n = 8 (cTEC) or n = 4 (mTEC), W8 n = 6, W16 n = 5) and percent of intertypical TEC within TEC as well as their total cell numbers (bottom panel) (W1 n = 4, W2 n = 6 (percent of TEC) or 4 (number of cells), W4 n = 4, W8 n = 6, W16 n = 5, from 2 to 3 independent experiments per timepoint). Gating required adjustments between the different timepoints analysed due to age-dependent changes in surface expression levels of Sca1. Data are presented as mean +/− SEM. Source data are provided as a Source Data file.
Fig. 4
Fig. 4. A combination of surface markers to define tuft-like mTEC.
a UMAP graphs (top) and violin plots (bottom) illustrating the expression of Sca1, CD63, CD66a, and CD117 on TEC from 16-week-old mice. Colour gradient indicates expression levels in the UMAP graphs and colours in the violin plots represent the different clusters, as defined in Fig. 1b. b UMAP graphs illustrating the scaled expression of CD63, Ceacam (CD66a), and Kit (CD117) in the scRNAseq dataset introduced in Fig. 2b. Colour gradient indicates expression levels. c UMAP graph illustrating the similarity score of the mTEClo IV cluster from the 4-week Infinity Flow dataset to each cell of the scRNAseq reference dataset, based on the surface protein expression levels imputed by Infinity Flow. d Gating strategy to identify tuft-like mTEC within CD45EpCAM1+ cells using Sca1, CD63, CD66a, and CD117. e Intracellular staining for Dclk1 expression in 4- to 8-week-old mice. Representative histogram and cumulative data depict the percent Dclk1+ cells within tuft-like mTEC and CD66aCD117 non-tuft-like cells, as defined in (d) (n = 9, from four independent experiments). Statistical analysis was done using a two-tailed unpaired Student’s t-test. f, g Pou2f3−/− mice were analysed for their abundance of (f) Dclk1+ cells and (g) CD66a+CD117+ cells compared to C57BL/6 WT mice. Shown are representative FACS plots (left panels) and cumulative data (right panel) (n = 6, from two independent experiments). Statistical analysis was done using a two-tailed unpaired Student’s t-test. h, i Abundance of tuft-like mTEC, as defined in (d) within mTEClo was analysed at the indicated timepoints in C57BL/6 WT mice. Shown are (h) representative FACS plots and (i) cumulative data depicting the percent of tuft-like mTEC within TEC and their total cell numbers (W1 n = 4, W2 n = 10 (percent of TEC) or 8 (number of cells), W4 n = 11 (percent of TEC) or 8 (number of cells), W8 n = 9, W16 n = 11, from 2–3 independent experiments per timepoint). Data are presented as mean +/− SEM in (ei). Source data are provided as a Source Data file for panels (ei).
Fig. 5
Fig. 5. CITEseq validates new TEC markers.
CD45Ter119 thymic stromal cells isolated from 1- and 16-week-old C57BL/6 WT mice were used for scRNAseq in combination with CITEseq as described in the methods. Cells belonging to clusters assigned as epithelial cells were selected for further analysis. ac Hierarchical clustering analysis was performed on 5834 TEC either using (a) the gene expression analysis or (b) only considering the detection of ADTs. Results were projected in a 2D space using t-distributed stochastic neighbour embedding (t-SNE). Each colour represents a specific cluster. In (c) t-SNE distribution of the ADT clustering is shown using the cluster colouring of the RNA analysis. d Compiled data showing the cluster distributions, defined as in a and b, in relation to the derivation of the cells from 1- or 16-week-old mice, and to the similarity score to the reference TEC scRNAseq dataset from Bara-Gale et al. The expression of CITEseq markers is centred to the mean and scaled to the range of expression values. e Violin plots depicting the abundance of UEA1 and MHCII ADTs across ADT clusters. The box was drawn from the 25th percentile (Q1) to the 75th percentile (Q3) of the ADT abundance in cells from a specific cluster with the horizontal line denoting the median value. The difference Q3-Q1 forms the interquartile range (IQR). Whiskers are drawn up to the largest data point and down to the smallest data point falling within the range 1.5*IQR. All other observed data points outside the boundary of the whiskers are plotted individually as outliers. f Cells were annotated based on transcriptional similarity to the scRNAseq dataset from Baran-Gale et al. Each colour represents a specific TEC subset as defined in the reference dataset. g, h T-SNE plots illustrating the scaled expression of (g) perinatal cTEC markers such as CD83, CD40, HVEM, Enpep, CD49a, and CD73, and of (h) tuft-like and intertypical TEC markers such as Sca1, CD63, CD117, Ceacam1, Dclk1, and Mcam across ADT clusters.
Fig. 6
Fig. 6. Perinatal cTEC display an increased capacity for positive selection.
a, b Immunofluorescent analysis of frozen thymic tissue sections from 4-week-old C57/BL6 WT mice stained with antibodies directed against K8 (green), K14 (yellow), Ly51 (magenta), and CD69 (blue). Shown are (a) an image of a representative region (n = 7) and (b) cumulative data depicting the signal intensities detected across the subcapsular region (SubCaps), the inner cortex, the deep cortex and the medulla. Data are derived from three biological samples. Data are presented as mean values +/− SEM. Statistical analysis was done using a two-tailed unpaired Student’s t-test. Source data are provided as a Source Data file. c, d Thymic epithelial cell cultures (TECx) of non-perinatal (CD83CD40) and perinatal (CD83+CD40+Sca1) cTEC with CD69 DP thymocytes were performed. Shown are representative FACS plots illustrating the expression of (c) TCRβ and CD5 after two days of culture for DP only, non-perinatal cTEC and perinatal cTEC cultures and the number of (d) thymocytes and CD5hiTCRβhi cells acquired (n = 5, from three independent experiments). Data are presented as mean values +/− SEM. Statistical analysis was done using a two-tailed unpaired Student’s t-test. Source data are provided as a Source Data file. e, f Abundance of developmental thymocyte stages based on the expression of TCRβ and CD69 was analysed in 4- and 16-week-old C57BL/6 WT mice. Shown are (e) representative FACS plots and (f) cumulative data revealing the percent of cells of thymocyte stages 0–3 (n = 6, from two independent experiments). Data are presented as mean values +/−  SEM. Statistical analysis was done using a two-tailed unpaired Student’s t-test. Source data are provided as a Source Data file.
Fig. 7
Fig. 7. Crosstalk with thymocytes facilitates cTEC maturation.
(a) Rag2−/− mice were analysed for the abundance of perinatal cTEC at 4- and 16-weeks and compared to perinatal cTEC in 1-, 4-, and 16-week-old C57BL/6 WT mice. Shown are a representative FACS plots and cumulative data (W1 n = 7, W4 WT n = 5 and Rag2−/− n = 3, W16 WT n = 8 and Rag2−/− n = 3). Data shown are derived from one out of two independent experiments. Data are presented as mean values +/− SEM. Source data are provided as a Source Data file. b, c Rag2−/−- mice were injected with HBSS or α-CD3 antibodies (clone KT3) and analysed four weeks later for the development of double positive thymocytes. Shown are (b) representative FACS plots depicting the emergence of CD4+CD8+ cells and (c) cumulative data for the total number of cells per thymus (HBSS n = 14, α-CD3 n = 8, from two independent experiments). Data are presented as mean values +/− SEM. Source data are provided as a Source Data file. d, e The cTEC compartment was analysed for changes in the abundance of cTEC subpopulations (CD83+CD40+Sca1 perinatal, CD83CD40 non-perinatal, CD83CD40Sca1 mature, and CD83CD40Sca1+ intertypical cTEC) following α-CD3 treatment. Shown are (d) representative FACS plots and (e) cumulative data as percentage of TEC and as total cell numbers (HBSS n = 7, α-CD3 n = 8, from two impendent experiments). Data are presented as mean values +/− SEM. Statistical analysis was done using a two-tailed unpaired Student’s t-test. Source data are provided as a Source Data file.

References

    1. Anderson G, Takahama Y. Thymic epithelial cells: working class heroes for T cell development and repertoire selection. Trends Immunol. 2012;33:256–263. doi: 10.1016/j.it.2012.03.005. - DOI - PubMed
    1. James KD, Jenkinson WE, Anderson G. Non-epithelial stromal cells in thymus development and function. Front. Immunol. 2021;12:634367. doi: 10.3389/fimmu.2021.634367. - DOI - PMC - PubMed
    1. Anderson G, Jenkinson EJ, Moore NC, Owen JJ. MHC class II-positive epithelium and mesenchyme cells are both required for T-cell development in the thymus. Nature. 1993;362:70–73. doi: 10.1038/362070a0. - DOI - PubMed
    1. Handel AE, et al. Developmental dynamics of the neural crest-mesenchymal axis in creating the thymic microenvironment. Sci. Adv. 2022;8:eabm9844. doi: 10.1126/sciadv.abm9844. - DOI - PMC - PubMed
    1. Klein L, Kyewski B, Allen PM, Hogquist KA. Positive and negative selection of the T cell repertoire: what thymocytes see (and don’t see) Nat. Rev. Immunol. 2014;14:377–391. doi: 10.1038/nri3667. - DOI - PMC - PubMed

Publication types