. 2023 Aug;26(8):1365-1378.
doi: 10.1038/s41593-023-01377-6. Epub 2023 Jul 10.

Heart failure-induced cognitive dysfunction is mediated by intracellular Ca2+ leak through ryanodine receptor type 2

Affiliations

Heart failure-induced cognitive dysfunction is mediated by intracellular Ca2+ leak through ryanodine receptor type 2

Haikel Dridi et al. Nat Neurosci. 2023 Aug.

Abstract

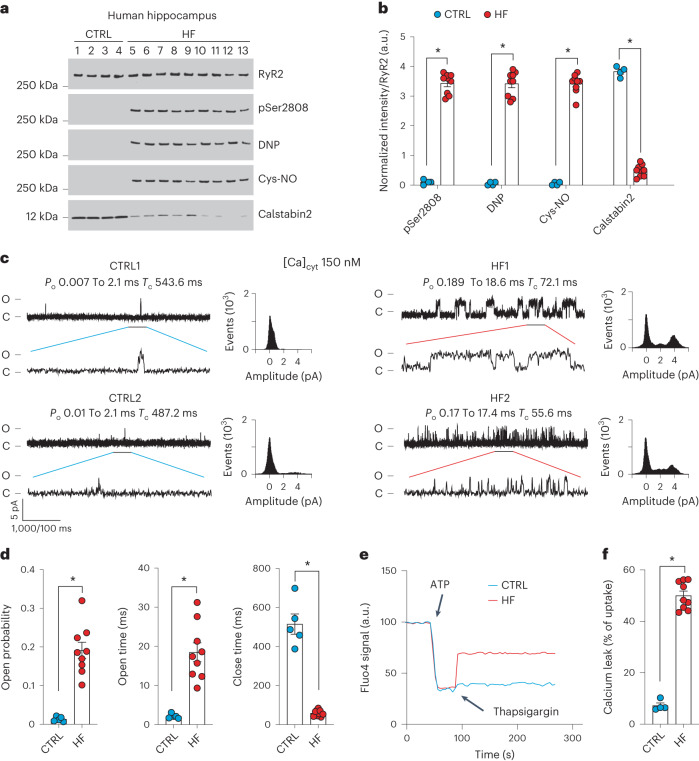
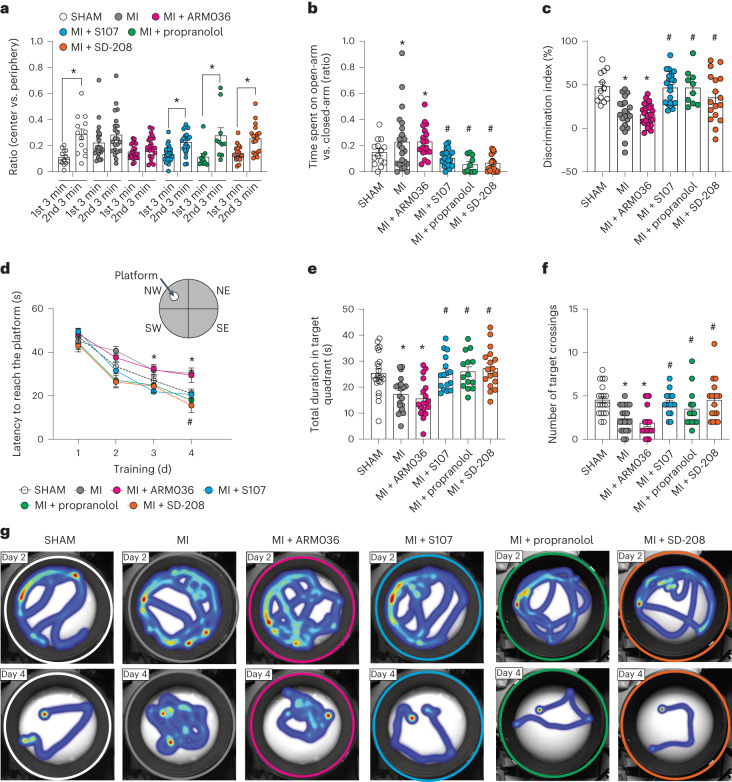
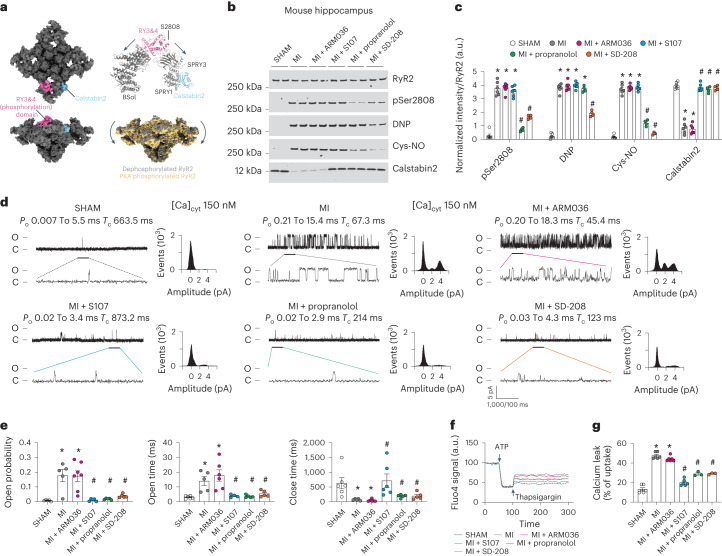
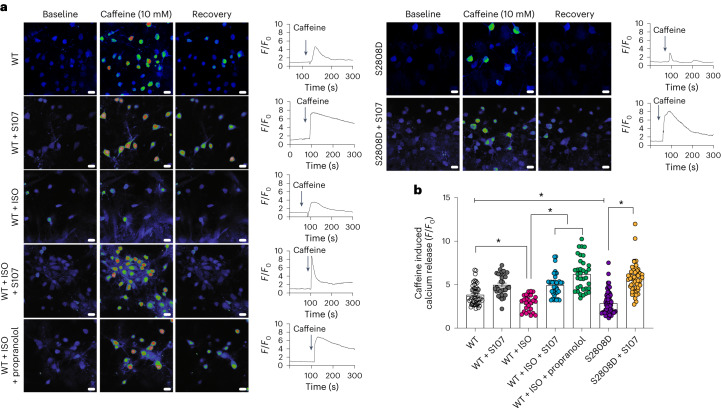
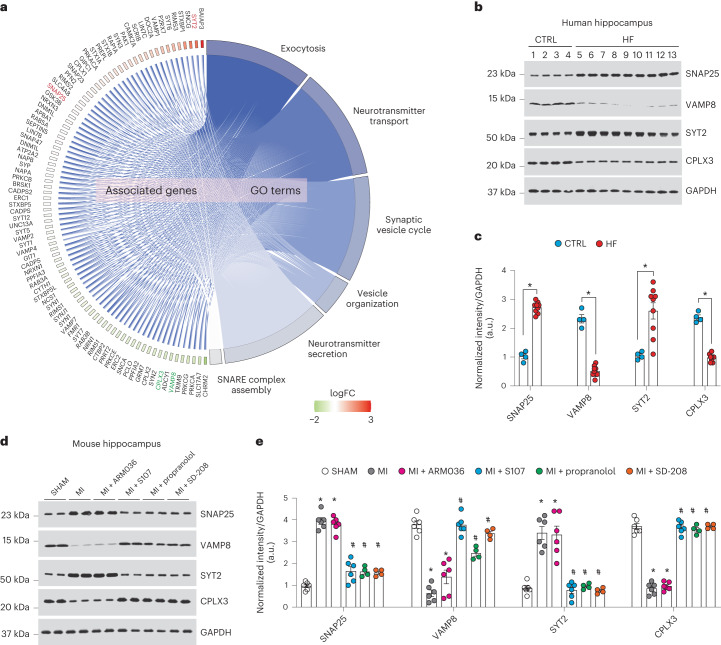
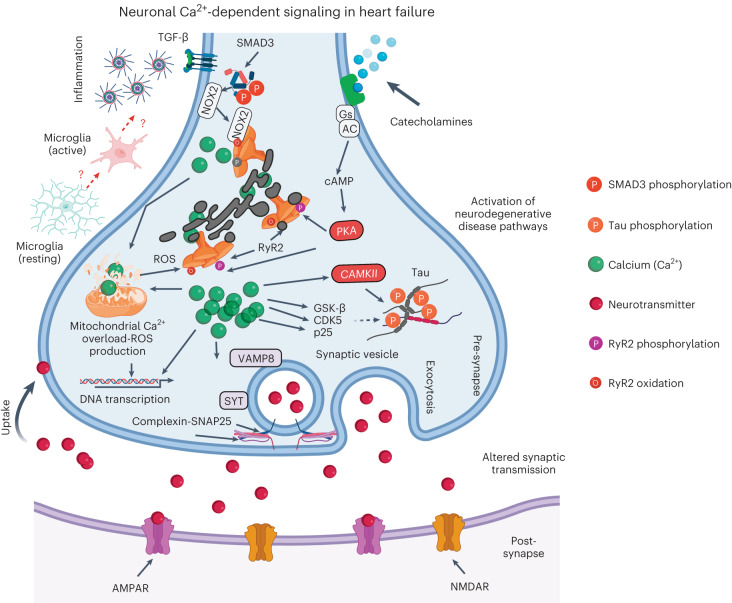
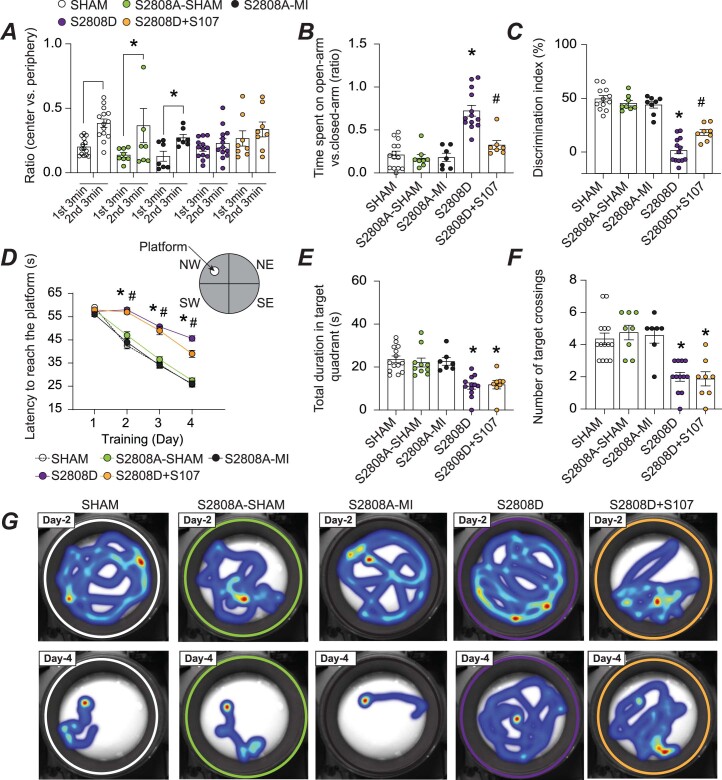
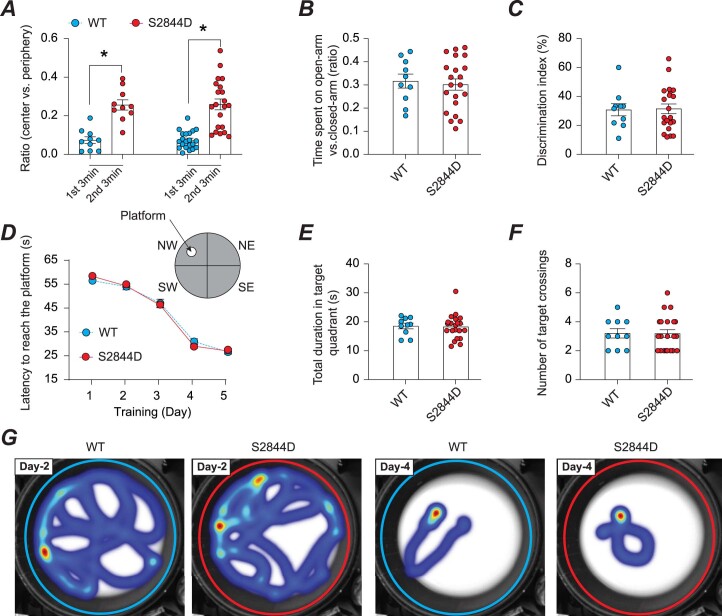
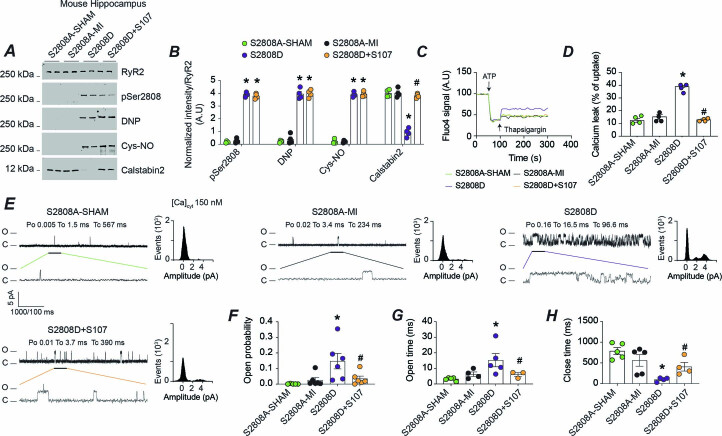
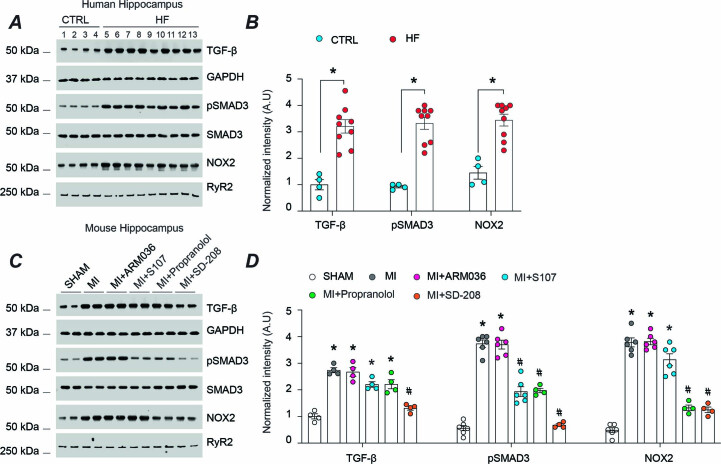
Cognitive dysfunction (CD) in heart failure (HF) adversely affects treatment compliance and quality of life. Although ryanodine receptor type 2 (RyR2) has been linked to cardiac muscle dysfunction, its role in CD in HF remains unclear. Here, we show in hippocampal neurons from individuals and mice with HF that the RyR2/intracellular Ca2+ release channels were subjected to post-translational modification (PTM) and were leaky. RyR2 PTM included protein kinase A phosphorylation, oxidation, nitrosylation and depletion of the stabilizing subunit calstabin2. RyR2 PTM was caused by hyper-adrenergic signaling and activation of the transforming growth factor-beta pathway. HF mice treated with a RyR2 stabilizer drug (S107), beta blocker (propranolol) or transforming growth factor-beta inhibitor (SD-208), or genetically engineered mice resistant to RyR2 Ca2+ leak (RyR2-p.Ser2808Ala), were protected against HF-induced CD. Taken together, we propose that HF is a systemic illness driven by intracellular Ca2+ leak that includes cardiogenic dementia.


Conflict of interest statement

Columbia University and A.R.M. own stock in ARMGO, a company developing compounds targeting RyR and have patents on Rycals. The remaining authors declare no competing interests.

Figures

Fig. 1
Fig. 1. Hippocampal RyR2 channels are remodeled and leaky in patients with heart failure.
a,b, Representative SDS–PAGE analysis and quantification of modified RyR2 and calstabin2 immunoprecipitated from hippocampi of controls and individuals with HF (IP RyR2; bands normalized to total RyR2). Control (CTRL), n = 4); HF, n = 9. c, Single-channel recordings of RyR2 incorporated in planar lipid bilayers with 150 nM Ca2+ in the cis chamber, corresponding to representative experiments performed using human hippocampal samples from controls and HF patients (two traces from two different controls and individuals with HF are shown) d, Po, To and Tc of RyR2 channels in controls (n = 5) and HF (n = 9) hippocampi. e, ER Ca2+ leak measured in microsomes from control (n = 4) and HF participant (n = 9) hippocampi. f, Bar graphs represent the quantification of microsomal Ca2+ leak as the percentage of uptake in controls (n = 5) and HF individuals (n = 9). Individual values are shown with the mean ± s.e.m. (t-test *P < 0.05, controls versus HF individuals). Data are derived from biologically independent samples. All statistical tests were two sided. a.u., arbitrary units. Source data
Fig. 2
Fig. 2. Mouse model of heart failure (myocardial infarction) is associated with cognitive dysfunction.
a, Open field test of mice operated SHAM (n = 13), MI (n = 22), MI treated with ARM036 (MI + ARM036, n = 23), MI treated with S107 (MI + S107, n = 24), MI treated with propranolol (MI + propranolol, n = 10) and MI treated with TGF-β inhibitor (MI + SD-208, n = 18). Ratios of total time spent in the center area versus periphery area within first 3 min and second 3 min are shown. b, EPM test showing the ratios of time spent in the open-arm versus closed-arm in SHAM (n = 14), MI (n = 22), MI + ARM036 (n = 18), MI + S107 (n = 23), MI + propranolol (n = 10) and MI + SD-208 (n = 18) mice. c, Novel object recognition test showing the discrimination index in SHAM (n = 12), MI (n = 21), MI + ARM036 (n = 23), MI + S107 (n = 22), MI + propranolol (n = 10) and MI + SD-208 (n = 17) mice. d, MWM test (learning curves for 4 d) in SHAM (n = 22), MI (n = 20), MI + ARM036 (n = 19), MI + S107 (n = 19), MI + propranolol (n = 14) and MI + SD-208 (n = 19) mice. e, Probe trials after escape platform removed showing the total duration spent in the target quadrant at day 5 in SHAM (n = 22), MI (n = 20), MI + ARM036 (n = 18), MI + S107 (n = 17), MI + propranolol (n = 14) and MI + SD-208 (n = 17) mice. f, Number of target crossings at day 5 in SHAM (n = 20), MI (n = 20), MI + ARM036 (n = 18), MI + S107 (n = 16), MI + propranolol (n = 14) and MI + SD-208 (n = 17) mice. g, Heat maps showing the latency for each group at day 2 and day 4. Individual values are shown with mean ± s.e.m. Two-tailed t-test *P < 0.05 in a shows significance between the first 3 min and second 3 min of each group. One-way analysis of variance (ANOVA) was used to compare the difference between the six groups in b, c, e and f; Tukey’s test was used for multiple comparisons; two-way ANOVA was used in d. Tukey’s test post hoc correction for multiple comparisons was used. *P < 0.05, SHAM versus MI or MI + ARM036; #P < 0.05, MI versus MI + S107, MI + propranolol or MI + SD-208. All statistical tests were two sided. Data are derived from biologically independent samples. Source data
Fig. 3
Fig. 3. Mouse model of heart failure is associated with leaky hippocampal RyR2.
a, Cryogenic electron microscopy structure of RyR2 (gray, top and side view) showing the location of the Ser2808 in the RY3&4 phosphorylation domain (magenta) and calstabin2 (cyan). RyR2 PKA phosphorylation shifted the channel toward a primed state (yellow). b,c, Representative SDS–PAGE analysis and quantification of modified RyR2 and calstabin2 immunoprecipitated from hippocampal RyR2 complex (IP RyR2; bands normalized to total RyR2) in SHAM (n = 6), MI (n = 6), MI + ARM036 (n = 6), MI + S107 (n = 6), MI+ propranolol (n = 4) and MI + SD-208 (n = 4) mice. d, Single-channel traces of RyR2 incorporated in planar lipid bilayers with 150 nM Ca2+ in the cis chamber, corresponding to representative experiments performed with hippocampal samples from SHAM (n = 6), MI (n = 5), MI + ARM036 (n = 6), MI + S107 (n = 5), MI + propranolol (n = 5) and MI + SD-208 (n = 5) mice. e, RyR2 Po, To and Tc in the same groups. f, Ca2+ leak measured in microsomes from mouse hippocampi of the same groups. g, Bar graphs represent the quantification of Ca2+ leak as the percentage of uptake in SHAM (n = 6), MI (n = 6), MI + ARM036 (n = 6), MI + S107 (n = 6), MI + propranolol (n = 3) and MI + SD-208 (n = 3) mice. Individual values are shown with the mean ± s.e.m. One-way ANOVA and Tukey’s test post hoc correction for multiple comparisons shows *P < 0.05, SHAM versus MI or MI + ARM036; #P < 0.05, MI versus MI + S107, MI + propranolol or MI + SD-208. Data are derived from biologically independent samples. All statistical tests were two sided. Source data
Fig. 4
Fig. 4. Mouse model of heart failure exhibits impaired long-term potentiation and diminished hippocampal glucose uptake.
a, Schematic representation of a hippocampal brain slice for LTP experiments and the positioning of the stimulating and recording electrodes. b, fEPSPs in hippocampal slices from each experimental group (SHAM (n = 13), MI (n = 12), MI + ARM036 (n = 12), MI + S107 (n = 11), MI + propranolol (n = 17) and MI + SD-208 (n = 16)). c, fEPSPs at 150 min in all the experimental groups. d, Basal neurotransmission (fEPSP slope), which remained unaltered between the different groups. e, Representative microPET images of FDG uptake (percentage of injected dose per gram (%ID/g)) in the mouse brains of different groups. f, Quantification of FDG uptake in the brains of mice from different experimental groups shown as a percentage of the FDG uptake in the SHAM mice (SHAM (n = 17), MI (n = 6), MI + ARM036 (n = 9), MI + S107 (n = 6), MI+ propranolol (n = 7) and MI + SD-208 (n = 6)). g, Quantification of 2-min dynamic microPET scans of MI (n = 4) and SHAM (n = 4) mice demonstrating similar brain blood flow FDG uptake in the brains of both groups of mice during the first 2 min after intravenous injection (%ID/g). hj, pH, PO2 and PCO2 blood levels in SHAM (n = 6) and MI (n = 7) mice. Individual values are shown with the mean ± s.e.m. One-way ANOVA and Tukey’s test post hoc correction for multiple comparisons, *P < 0.05, SHAM versus MI or MI + ARM036; #P < 0.05, MI versus MI + S107, MI + propranolol or MI + SD-208. A t-test was used in hj. Data are derived from biologically independent samples. All statistical tests were two sided. Source data
Fig. 5
Fig. 5. Adrenergic agonist and RyR2 Ser2808 phospho-mimetic mutation deplete endoplasmic reticulum Ca2+ stores in primary hippocampal neurons.
a, Representative images of 14-d cultured hippocampal neurons stimulated with 10 mM caffeine. For each condition, the Ca2+ levels are shown at baseline, during stimulation and at recovery. b, Quantification of caffeine-induced Ca2+release (F/F0) in response to 10 mM caffeine in neurons from wild-type (WT; n = 50), WT + S107 (n = 30), WT + isoproterenol (ISO; n = 26), WT + ISO + propranolol (n = 35), neurons expressing RyR2-p.Ser2808Asp untreated (S2808D; n = 70) and treated with S107 (p.Ser2808Asp + S107; n = 54). Individual values are shown with the mean ± s.e.m. (t-test *P < 0.05). Scale bar, 10 μm. A reduction in caffeine-induced Ca2+ release indicates a Ca2+-depleted ER due to persistent RyR2-mediated Ca2+ leak. Data are derived from biologically independent samples. All statistical tests were two sided. Source data
Fig. 6
Fig. 6. Quantitative proteomics analysis.
a, Quantitative proteomics was performed on hippocampus samples from SHAM (n = 4) and MI (n = 4) mice. The Volcano plot shows differentially expressed proteins (P adjusted < 0.05, fold change ≥ 1.5) in SHAM and MI mice. Red indicates upregulation, while blue represents downregulation of protein expression. Black indicates unchanged expression levels. b, The heat map of significantly dysregulated proteins (312 downregulated; 425 upregulated) The color scale bar shows the row normalized log2 protein abundance. cf, Dot plots show top ten GO biological processes (c), molecular functions (d), cellular components (e) and KEGG pathways (f) that were enriched from differentially expressed proteins. Significantly changed protein abundance was determined by unpaired t-test with a threshold for significance of P < 0.05 (permutation-based FDR correction), fold change ≥ 1.5, unique peptides ≥ 2. Data are derived from biologically independent samples. All statistical tests were two sided. See Supplementary Table 7 for protein list. Source data
Fig. 7
Fig. 7. Altered synaptic protein expression in heart failure.
a, Cohort plot representation of differentially expressed synaptic proteins (SHAM versus MI) from six significantly enriched synaptic transmission GO terms and generated by GOplot. The color map represents fold change of proteins (log2 scale). Selected proteins in the SNARE pathway are highlighted in red (upregulated) or green (downregulated). b,c, Immunoblots showing total expression of SNAP25, VAMP8, SYT2 and CPLX3, normalized to GAPDH in the hippocampi of controls (n = 4) and individuals with HF (n = 9). Individual values are shown with the mean ± s.e.m. (t-test *P < 0.05, control versus individuals with HF). d,e, Immunoblots showing total expression of SNAP25, VAMP8, SYT2 and CPLX3, normalized to GAPDH in the hippocampi of SHAM (n = 6), MI (n = 6), MI + ARM036 (n = 6), MI + S107 (n = 6), MI + propranolol (n = 4) and MI + SD-208 (n = 4) mice. Individual values are shown with the mean ± s.e.m. One-way ANOVA and Tukey’s test post hoc correction for multiple comparisons, *P < 0.05, SHAM versus MI or MI + ARM036; #P < 0.05 MI versus MI + S107, MI + propranolol or MI + SD-208. Data are derived from biologically independent samples. All statistical tests were two sided. Source data
Fig. 8
Fig. 8. Neuronal Ca2+ signaling in heart failure.
Increased catecholamine levels during HF activate PKA, which phosphorylates RyR2 on Ser2808 (Fig. 3). Increased inflammation in HF includes activation of the TGF-β pathway resulting in SMAD3 phosphorylation and upregulation of NOX2 and binding to RyR2 (Extended Data Fig. 4). NOX2 promotes oxidation of RyR2 channels. The combination of oxidation and phosphorylation of RyR2 results in ER Ca2+ leak (Fig. 3). Ca2+ leak through RyR2 leads to increased mitochondrial Ca2+ accumulation, which enhances mitochondrial ROS production (Extended Data Fig. 10). Therefore, a vicious cycle is created between the mitochondria and RyR2, where increased ER Ca2+ leak causes mitochondrial ROS production and increased mitochondrial ROS production further oxidizes RyR2 and renders it leakier. Chronic RyR2 Ca2+ leak depletes ER Ca2+ content and reduces the Ca2+ transient (Fig. 5) required for synaptic vesicle release during synaptic transmission (Figs. 4 and 7). Furthermore, oxidative stress and Ca2+ dyshomeostasis alter gene transcription (Extended Data Fig. 7), with a particular effect on proteins that are regulated by Ca2+ and involved in neurotransmission. Dysregulation of key proteins involved in synaptic transmission is reflected in the impaired LTP observed in the MI mice (Fig. 4b,c). Accumulation of Ca2+ in the cytosol activates Ca2+-dependent enzymes including CAMKII, GSK-β, CDK5 and p25, which subsequently leads to Tau phosphorylation, a hallmark of neurodegenerative disease (Supplementary Figs. 9 and 10). All these activated signaling cascades can be prevented, at least in part, by S107, a Rycal drug that reduces the ER Ca2+ leak. Gs, G protein; AC, adenylyl cyclase; cAMP, cyclic AMP; GSK-β, glycogen synthase kinase 3 beta. Created with BioRender.com.
Extended Data Fig. 1
Extended Data Fig. 1. Mouse model of leaky RyR2 (constitutive RyR2 PKA-phosphorylation) is associated with cognitive dysfunction.
Mouse model of leaky RyR2 (phospho-mimetic mutation) is associated with cognitive dysfunction. a) Open field test of SHAM (n = 14), S2808A-SHAM (n = 8), S2808A-MI (n = 8), S2808D (n = 13), and S2808D + S107 (n = 8) mice. Ratios of total time spent in the center area versus periphery area within first (1st) 3 min and second (2nd) 3 min are shown. b) Elevated plus maze test in SHAM (n = 14), S2808A-SHAM (n = 8), S2808A-MI (n = 8), S2808D (n = 13), and S2808D + S107 (n = 8) mice. Ratios of time spent on the open-arm versus closed-arm are shown. c) Novel object recognition test in SHAM (n = 14), S2808A-SHAM (n = 8), S2808A-MI (n = 8), S2808D (n = 13), and S2808D + S107 (n = 8) mice. Discrimination index is shown. d) Morris water maze test (learning curves) in SHAM (n = 14), S2808A-SHAM (n = 8), S2808A-MI (n = 8), S2808D (n = 13), and S2808D + S107 (n = 8) mice. e) Probe trials after escape platform removed in the same groups showing the total duration spent in the target quadrant. f) Number of target crossings SHAM (n = 14), S2808A-SHAM (n = 8), S2808A-MI (n = 8), S2808D (n = 13), and S2808D + S107 (n = 8) mice. g) Heat maps showing the latency from each group at Day 2 and Day 4. Individual values are shown with mean ± SEM (t-test * p < 0.05 in panel A shows significance between the first 3 min and second 3 min of the same groups. One-way ANOVA was used to compare the difference between the 5 groups in panel B, C, E and F; Two-way ANNOVA was used in panel D. Tukey’s test post-hoc correction for multiple comparisons was used; * p < 0.05, S2808A-SHAM vs. S2808D or S2808D + S107; # p < 0.05, S2808D vs. S2808D + S107. No differences were detected between S2808A-SHAM and S2808A-MI. All statistical tests were two-sided. Data are derived from biologically independent samples. Source data
Extended Data Fig. 2
Extended Data Fig. 2. Cognitive function in RyR1-S2844D mice.
a) Open field test using WT mice (n = 10) and a mouse model with leaky RyR1 channels (S2844D) (n = 21). Ratios of total time spent in the center area versus periphery area within first 3 min and second 3 min are shown. b) Elevated plus maze test in WT mice (n = 10) and S2808D (n = 21). Ratios of time spent in the open-arm versus closed-arm are shown. c) Novel object recognition test in WT mice (n = 10) and S2808D (n = 21). Discrimination index is shown. d) Morris water maze test (learning curves) in WT mice (n = 10) and S2808D (n = 21). e) Probe trials after escape platform removed in the same groups showing the total duration spent in the target quadrant in WT mice (n = 10) and S2808D (n = 21). f) Number of target crossings in WT mice (n = 10) and S2808D (n = 21). g) Heat maps showing the latency from each group at Day 2 and Day 5. Individual values are shown with mean ± SEM. T-test was used in panel A-C, E-F, * p < 0.05 in panel A shows significance between the first 3 min and second 3 min of each group). Two-way ANOVA was used in panel D. Tukey’s test post-hoc correction for multiple comparisons was used. All statistical tests were two-sided. Data are derived from biologically independent samples. Source data
Extended Data Fig. 3
Extended Data Fig. 3. Constitutive RyR2 phosphorylation on Ser2808 (S2808D mice) induces ER Ca2+ leak in the hippocampus.
Phospho-mimetic mutation (RyR2-S2808D mice) induces ER Ca2+ leak in the hippocampus. a, b) Representative SDS-PAGE analysis and quantification of modified RyR2 and calstabin2 immunoprecipitated from hippocampus of S2808A-SHAM (n = 4), S2808A-MI (n = 4), S2808D (n = 4), S2808D + S107 mice (n = 4) (IP RyR2: Bands normalized to total RyR2); n = 4 in each group. c) ER Ca2+ leak measured in microsomes from hippocampi of S2808A-SHAM (n = 4), S2808A-MI (n = 4), S2808D, S2808D + S107 mice (n = 4). d) Bar graphs represent the quantification of Ca2+ leak as the percentage of uptake in all the experimental groups (n = 4 per group). e) Single-channel traces of RyR2 incorporated in planar lipid bilayers with 150 nM Ca2+ in the cis chamber, corresponding to representative experiments performed with hippocampal samples from S2808A-SHAM, S2808A-MI, S2808D, S2808D + S107 mice. f–h) RyR2 open probability (Po), mean open time (To), and mean close time (Tc) in S2808A-SHAM, S2808A-MI, S2808D, and S2808D + S107 mice (n = n = 5, 5, 4 and 4 respectively). Individual values are shown with mean ± SEM. One way-ANOVA and Tukey’s test post-hoc correction for multiple comparisons shows * p < 0.05, S2808A-SHAM vs. S2808D or S2808D + S107; # p < 0.05, S2808D vs. S2808D + S107. No differences were detected between S2808A-SHAM and S2808A-MI. All statistical tests were two-sided. Data are derived from biologically independent samples. Source data
Extended Data Fig. 4
Extended Data Fig. 4. TGF-β activation in HF.
a) Immunoblots showing expressing levels of TGF-β, phosphorylated SMAD3, total SMAD3, and NOX2 binding to RyR2 in the hippocampi of controls (n = 4) and HF patients (n = 9). b) Bar graphs depicting the ratio of TGF-β expression normalized to GAPDH, phosphorylated SMAD3 to total SMAD3 and NOX2 binding to RyR2 (IP RyR2). The same quantity of proteins were loaded on two separate gels and blotted separately for SMAD3 and pSMAD3. Individual values are shown with mean ± SEM (t-test * p < 0.05, Controls vs. HF patients). c) Immunoblots showing expressing levels of TGF-β, phosphorylated SMAD3, total SMAD3, and NOX2 binding to RyR2 in the hippocampi of SHAM, MI, MI + ARM036, MI + S107, MI+ propranolol and MI + SD-208 mice (n = 6, 6, 6, 6, 4 and 4 respectively). d) Bar graphs depicting the ratio of TGF-β expression normalized to GAPDH, phosphorylated SMAD3 to total SMAD3 and NOX2 binding to RyR2 (IP RyR2). The same quantity of proteins were loaded on two separate gels and blotted separately for SMAD3 and pSMAD3. Individual values are shown with mean ± SEM. One-way ANOVA and Tukey’s test post-hoc correction for multiple comparisons shows * p < 0.05, SHAM vs. MI, MI + ARM036 or MI + S107; #p < 0.05, MI vs. MI + S107, MI+ propranolol or MI + SD-208. All statistical tests were two-sided. Data are derived from biologically independent samples. Source data
Extended Data Fig. 5
Extended Data Fig. 5. Pre-ranked gene set enrichment analysis (GSEA) of the hippocampal proteomics.
Dot plots show: a) Top 20 up- and top 20 down-regulated GO biological process, b) top 10 up- and top 20 down-regulated GO cellular component, c) top 10 up- and top 20 down-regulated GO molecular function terms. Significantly changed protein abundance was determined by unpaired t-test with a threshold for significance of p < 0.05 (permutation-based FDR correction), fold-change ≥1.5, unique peptides ≥2. Data are derived from biologically independent samples. All statistical tests were two-sided.Source file PRIDE #PXD042295.
Extended Data Fig. 6
Extended Data Fig. 6. Gene set enrichment analysis (GSEA) of the hippocampal proteomics.
The enrichment plots of representative KEGG pathway gene sets demonstrate that oxidative phosphorylation (a), Parkinson’s disease (b), Alzheimer’s disease (c), and Huntington’s disease (d) are significantly enriched in MI compared to SHAM. The heatmap on the right side of each panel visualizes the genes contributing to the enriched pathways. For the detailed list see Supplementary Table 8. Signal-to-noise ratio was used to rank the genes per their correlation with either MI phenotype (red) or SHAM phenotype (blue). The y-axis represents enrichment score (ES) and on the x-axis are genes (vertical black lines) represented in gene sets. The GSEA analysis calculates an enrichment score (the maximum deviation from zero) reflecting the degree of over-representation of a gene set at the top or the bottom of the ranked gene list. A positive ES indicates gene set enrichment at the top of the ranked list; a negative ES indicates gene set enrichment at the bottom of the ranked list. NES, normalized enrichment score; FDR, FDR adjusted p-value.
Extended Data Fig. 7
Extended Data Fig. 7. RNA sequencing analysis.
RNA-sequencing was performed on the hippocampi of SHAM and MI mice (n = 4 for each group). a) The Volcano plot shows differentially expressed genes (p-adj<0.05, fold-change ≥1.3) in SHAM and MI mice. Red indicates up-regulated, while blue represents down-regulated genes. Black indicates unchanged expression levels. b) The heat map shows significantly dysregulated genes (down-regulated: 2003, up-regulated: 1149 genes), the color scale bar shows the row normalized log2 protein abundance. c) Dot plots show top 10 GO biological processes, d) molecular functions, e) cellular components, and f) KEGG pathways that were enriched from differentially expressed genes. Significantly changed gene abundance was determined by unpaired t-test with a threshold for significance of p < 0.05 (permutation-based FDR correction), fold-change ≥1.5. Data are derived from biologically independent samples. All statistical tests were two-sided. See Supplementary Table 9for gene list. Data are accessible on SRA- Accession: PRJNA956662.
Extended Data Fig. 8
Extended Data Fig. 8. Pre-ranked gene set enrichment analysis (GSEA) of RNA sequencing.
Dot plots show: a) Top 20 up- and top 20 down-regulated GO biological process, b) top 20 up- and top 20 down-regulated GO cellular component, c) top 20 up- and top 20 down-regulated GO molecular function terms. Significantly changed gene abundance was determined by unpaired t-test with a threshold for significance of p < 0.05 (permutation-based FDR correction), fold-change ≥1.5. Data are derived from biologically independent samples. All statistical tests were two-sided.
Extended Data Fig. 9
Extended Data Fig. 9. Gene set enrichment analysis (GSEA) of the hippocampal RNA sequencing.
The enrichment plots of representative KEGG pathway gene sets demonstrate that oxidative phosphorylation (a), Parkinson’s disease (b), Alzheimer’s disease (c), and Huntington’s disease (d) are significantly enriched in MI compared to SHAM. The heatmap on the right side of each panel visualizes the genes contributing to the enriched pathways. For the detailed list, see Supplementary Table 10. Signal-to-Noise ratio was used to rank the genes per their correlation with either MI phenotype (red) or SHAM phenotype (blue). The y-axis represents enrichment score (ES) and on the x-axis are genes (vertical black lines) represented in gene sets. The GSEA analysis calculates an enrichment score (the maximum deviation from zero) reflecting the degree of over-representation of a gene set at the top or the bottom of the ranked gene list. A positive ES indicates gene set enrichment at the top of the ranked list; a negative ES indicates gene set enrichment at the bottom of the ranked list. NES, normalized enrichment score; FDR, FDR adjusted p-value.
Extended Data Fig. 10
Extended Data Fig. 10. Mitochondrial Ca2+ overload and oxidative stress in HF.
a) Cohort plot representation of differentially expressed mitochondrial proteins (SHAM vs MI) from 4 significantly enriched mitochondrial GO-terms and generated by GOplot. The color map represents fold change of proteins (log2 scale). b) Ca2+ accumulation in isolated mitochondria from SHAM (n = 6), MI (n = 5), MI + ARM036 (n = 5), and MI + S107 (n = 5) mice. C) Reactive oxygen species (ROS) production in isolated mitochondria from SHAM (n = 6), MI (n = 6), MI + ARM036 (n = 6), and MI + S107 (n = 5) mice. Individual values are shown with mean ± SEM (one-way ANOVA and Tukey’s test post-hoc correction for multiple comparisons show * p < 0.05, SHAM vs. MI or MI + ARM036; #p < 0.05, MI vs. MI + S107). All statistical tests were two-sided. Source data

References

    1. Ambrosy AP, et al. The global health and economic burden of hospitalizations for heart failure: lessons learned from hospitalized heart failure registries. J. Am. Coll. Cardiol. 2014;63:1123–1133. - PubMed
    1. Ponikowski P, et al. Heart failure: preventing disease and death worldwide. ESC Heart Fail. 2014;1:4–25. - PubMed
    1. Leto L, Feola M. Cognitive impairment in heart failure patients. J. Geriatr. Cardiol. 2014;11:316–328. - PMC - PubMed
    1. McParland C, Krishnan B, Wang Y, Gallagher CG. Inspiratory muscle weakness and dyspnea in chronic heart failure. Am. Rev. Respir. Dis. 1992;146:467–472. - PubMed
    1. Huynh K. Heart failure: HF-induced diaphragmatic atrophy and weakness. Nat. Rev. Cardiol. 2017;14:384. - PubMed

Publication types

Substances