. 2023 Jul 10;13(1):11177.
doi: 10.1038/s41598-023-38301-8.

Macrophages play a leading role in determining the direction of astrocytic migration in spinal cord injury via ADP-P2Y1R axis

Affiliations

Macrophages play a leading role in determining the direction of astrocytic migration in spinal cord injury via ADP-P2Y1R axis

Gentaro Ono et al. Sci Rep. .

Abstract

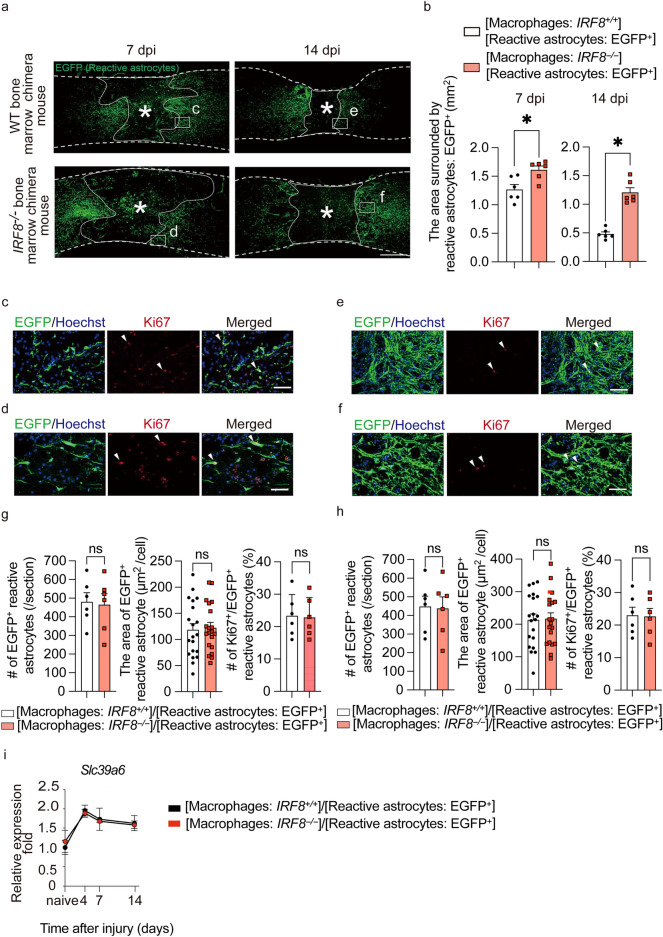
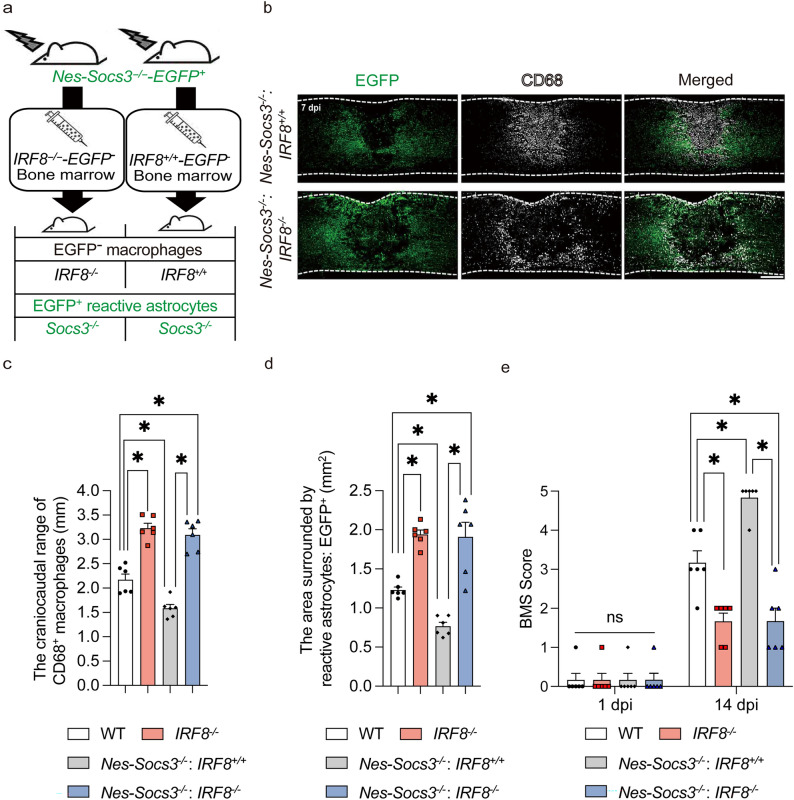
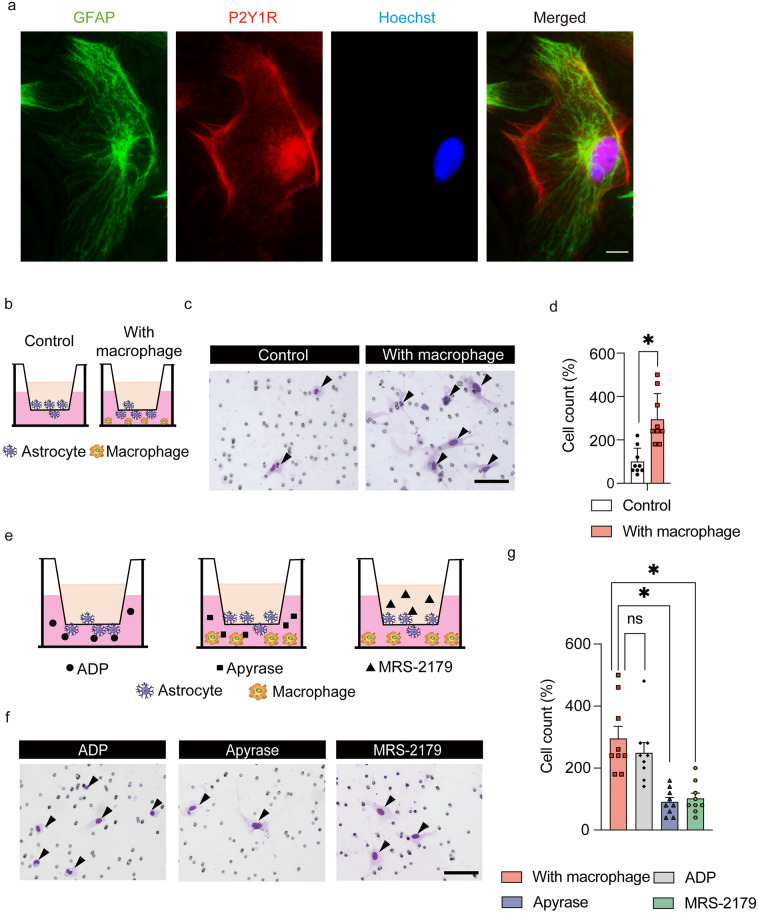
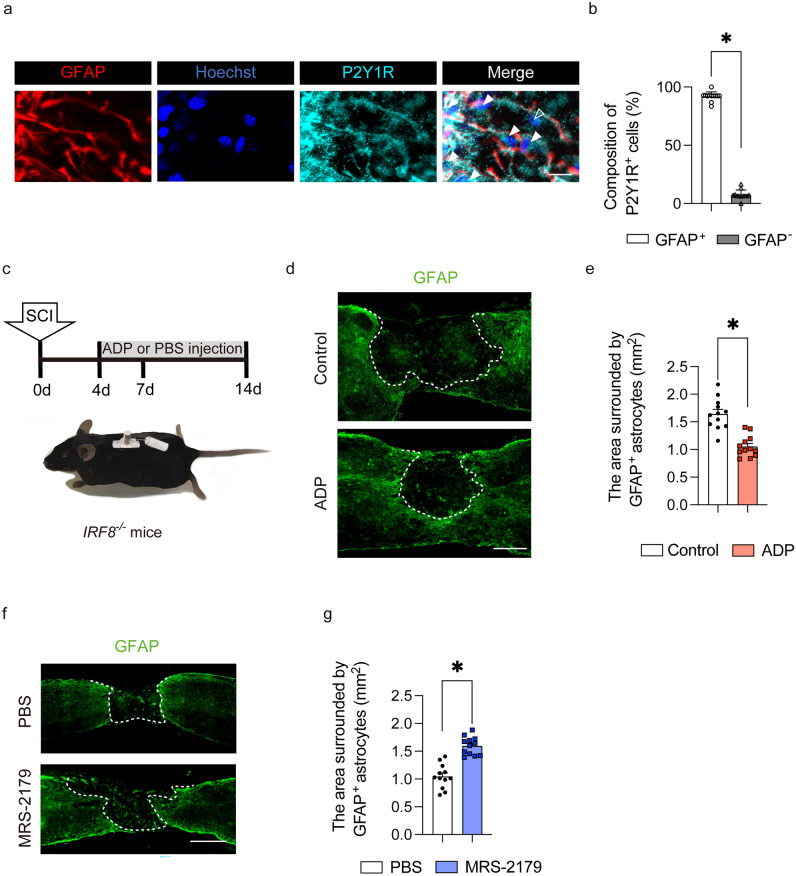
After spinal cord injury (SCI), inflammatory cells such as macrophages infiltrate the injured area, and astrocytes migrate, forming a glial scar around macrophages. The glial scar inhibits axonal regeneration, resulting in significant permanent disability. However, the mechanism through which glial scar-forming astrocytes migrate to the injury site has not been clarified. Here we show that migrating macrophages attract reactive astrocytes toward the center of the lesion after SCI. Chimeric mice with bone marrow lacking IRF8, which controls macrophage centripetal migration after SCI, showed widely scattered macrophages in the injured spinal cord with the formation of a huge glial scar around the macrophages. To determine whether astrocytes or macrophages play a leading role in determining the directions of migration, we generated chimeric mice with reactive astrocyte-specific Socs3-/- mice, which showed enhanced astrocyte migration, and bone marrow from IRF8-/- mice. In this mouse model, macrophages were widely scattered, and a huge glial scar was formed around the macrophages as in wild-type mice that were transplanted with IRF8-/- bone marrow. In addition, we revealed that macrophage-secreted ATP-derived ADP attracts astrocytes via the P2Y1 receptor. Our findings revealed a mechanism through which migrating macrophages attract astrocytes and affect the pathophysiology and outcome after SCI.


Conflict of interest statement

The authors declare no competing interests.

Figures

Figure 1
Figure 1
Temporal changes in macrophages and astrocytes in SCI. (a) Macrophage migration occurred after SCI, followed by glial scar formation by astrocytes at 7–14 days post-injury (dpi). Scale bar: 500 μm. (b) Quantitative analysis of the craniocaudal range of astrocytes in the glial scar and macrophages (n = 6 per group). Error bars indicate the SEM.
Figure 2
Figure 2
Inhibition of macrophage migration results in larger glial scars. (a) Change in the distribution of EGFP+ reactive astrocytes over time in the injured spinal cord of [reactive astrocytes: Nes-Cre-EGFP+/macrophages: WT] and [reactive astrocytes: Nes-Cre-EGFP+/macrophages: IRF8−/−] mice. Reactive astrocytes: Nes-Cre-EGFP+/macrophages: IRF8−/− mice had larger glial scars. Scale bar: 500 μm. (b) Quantitative analysis of the area surrounded by EGFP-positive cells: reactive astrocytes. There were significant differences between [reactive astrocytes: Nes-Cre-Socs3−/−EGFP+/macrophages: WT] and [reactive astrocytes: Nes-Cre-Socs3−/−EGFP+/macrophages: IRF8−/−] mice at 7 days and 14 dpi (n = 6 per group at each time point). (c) High-magnification view of WT bone chimeric mice at 1 week after injury. Scale bar: 100 μm. (d) High-magnification view of IRF8−/− bone chimeric mice at 1 week after injury. Scale bar: 100 μm. (e) High-magnification view of WT bone chimeric mice at 2 weeks after injury. Scale bar: 100 μm. (f) High-magnification view of IRF8−/− bone chimeric mice 2 weeks after injury. Scale bar: 100 μm. (g) Quantitative analysis of the number of reactive astrocytes, the area of astrocyte cell bodies, and a proliferation assessment by Ki67 staining at 7 dpi. No significant differences were found in any of the parameters (n = 6 per group). (h) Quantitative analysis of the number of reactive astrocytes, the area of astrocyte cell bodies, and a proliferation assessment by Ki67 staining at 14 dpi. No significant differences were found in any of the parameters (n = 6 per group). (i) The time course of Slc39a6 expression in the injured spinal cord determined by real-time RT‒PCR in [reactive astrocytes: Nes-Cre-Socs3−/−EGFP+/macrophages: WT] and [reactive astrocytes: Nes-Cre-Socs3−/−EGFP+/macrophages: IRF8−/−] mice (n = 6 per group at each time point). Each group was normalized to Gapdh values. There were no significant differences between [reactive astrocytes: Nes-Cre-Soc3−/−EGFP+/macrophages: WT] and [reactive astrocytes: Nes-Cre-Socs3−/−EGFP+/macrophages: IRF8−/−] mice. *p < 0.05, unpaired t-test. Error bars indicate the SEM.
Figure 3
Figure 3
Impaired macrophage migration disturbs migration of genetically promoted migration of astrocytes after SCI. (a) A schematic illustration of the creation of bone marrow chimeric mice. (b) Immunostaining of the injured spinal cord in [reactive astrocytes: Nes-Cre-Soc3−/−EGFP+/macrophages: WT] and [reactive astrocytes: Nes-Cre-Soc3−/−EGFP+/macrophages: IRF8−/−] mice. Scale bar: 500 μm. (c) Quantitative analysis of the extent of macrophage migration. The lack of Socs3 in reactive astrocytes narrows the range of macrophage migration, while the lack of IRF8 widens the range of macrophage migration (n = 6 per group). (d) Quantitative analysis of the area surrounded by EGFP-positive cells: reactive astrocytes. There were significant differences in the area between [reactive astrocytes: Nes-Cre-Soc3−/−EGFP+/macrophages: WT] and [reactive astrocytes: Nes-Cre-Soc3−/−EGFP+/ macrophages: IRF8−/−] mice at 7 days post-injury (n = 6 per group). (e) The time course of motor function score after SCI. Significant differences were only seen at 14 dpi (n = 6 per group). *p < 0.05, ordinary one-way ANOVA/two-way ANOVA. Error bars indicate the SEM.
Figure 4
Figure 4
Macrophages attract astrocytes via the P2Y1R. (a) The expression of P2Y1R in astrocytes in vitro. Scale bar: 10 μm. (b) A schematic illustration of the astrocyte transwell assay with/without macrophages. (c) Transwell assay of astrocytes in the control and macrophage groups. Diff-Quik staining images are representative of 2 independent experiments. Scale bar: 100 μm. (d) Comparison of the number of migrating cells in the control and macrophage groups (9 sections/3 wells per group). (e) A schematic illustration of the transwell assay to reveal the pathways by which macrophages attract astrocytes. (f) Transwell assay of astrocytes in the control and macrophage groups. Diff-Quik staining images are representative of 3 independent experiments. Scale bar: 100 μm. (g) Comparison of the number of migrating cells between macrophages, without macrophages/with ADP, with macrophages/with apyrase, and with macrophages/with MRS-2179 (9 sections/3 wells per group). *p < 0.05, ordinary one-way ANOVA/unpaired t-test. Error bars indicate the SEM.
Figure 5
Figure 5
ADP attracts astrocytes in vivo. (a) Immunostaining of the injured spinal cord at 7 dpi. Scale bar: 50 μm. (b) The quantitative analysis of composition in P2Y1R+ cells. There was a significant difference between the GFAP+ cells and GFAP cells. White arrowheads are P2Y1R+/GFAP+ cells, hollow arrowhead is P2Y1R+/GFAP cell. Scale bar: 50 μm. (c) A schematic illustration of continuous intraspinal injection of ADP. (b) Immunostaining of the injured spinal cord in the ADP continuous intraspinal injection group and the control group. Scale bar: 500 μm. (d) The quantitative analysis of the area surrounded by GFAP-positive cells. There was a significant difference between the ADP continuous intraspinal injection group and the control group (n = 6 per group). (e) Immunostaining of the injured spinal cord in the MRS-2179 intraspinal injection group and the PBS intraspinal injection group. Scale bar: 500 μm. (f) The quantitative analysis of the area surrounded by GFAP-positive cells. There was a significant difference between the MRS-2179 intraspinal injection group and the PBS intraspinal injection group (n = 6 per group). *p < 0.05, unpaired t-test. Error bars indicate the SEM.

Update of

References

    1. McDonald JW, Sadowsky C. Spinal-cord injury. Lancet. 2002;359:417–425. doi: 10.1016/S0140-6736(02)07603-1. - DOI - PubMed
    1. Anjum A, et al. Molecular sciences spinal cord injury: Pathophysiology, multimolecular interactions, and underlying recovery mechanisms. Int. J. Mol. Sci. 2020;21:7533. doi: 10.3390/ijms21207533. - DOI - PMC - PubMed
    1. Tran AP, Warren PM, Silver J. The biology of regeneration failure and success after spinal cord injury. Physiol. Rev. 2018;98:881. doi: 10.1152/physrev.00017.2017. - DOI - PMC - PubMed
    1. Okada S, et al. Conditional ablation of Stat3 or Socs3 discloses a dual role for reactive astrocytes after spinal cord injury. Nat. Med. 2006;12:829. doi: 10.1038/nm1425. - DOI - PubMed
    1. Orr MB, Gensel JC. Spinal cord injury scarring and inflammation: Therapies targeting glial and inflammatory responses. Neurotherapeutics. 2018;15:541. doi: 10.1007/s13311-018-0631-6. - DOI - PMC - PubMed

Publication types

Substances