. 2023 Jul 10;14(1):4079.
doi: 10.1038/s41467-023-39835-1.

Individual bat virome analysis reveals co-infection and spillover among bats and virus zoonotic potential

Affiliations

Individual bat virome analysis reveals co-infection and spillover among bats and virus zoonotic potential

Jing Wang et al. Nat Commun. .

Abstract

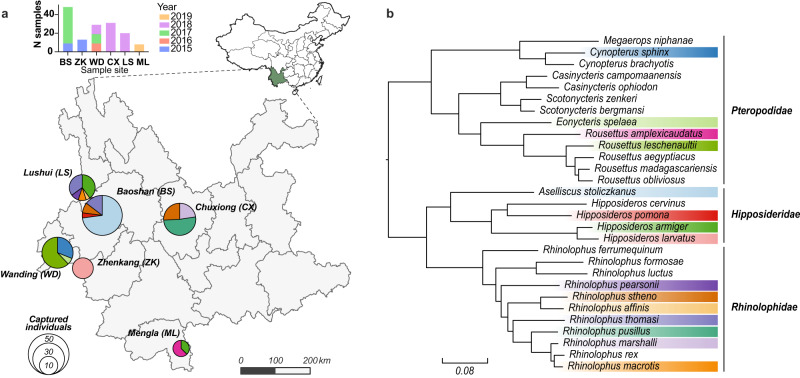
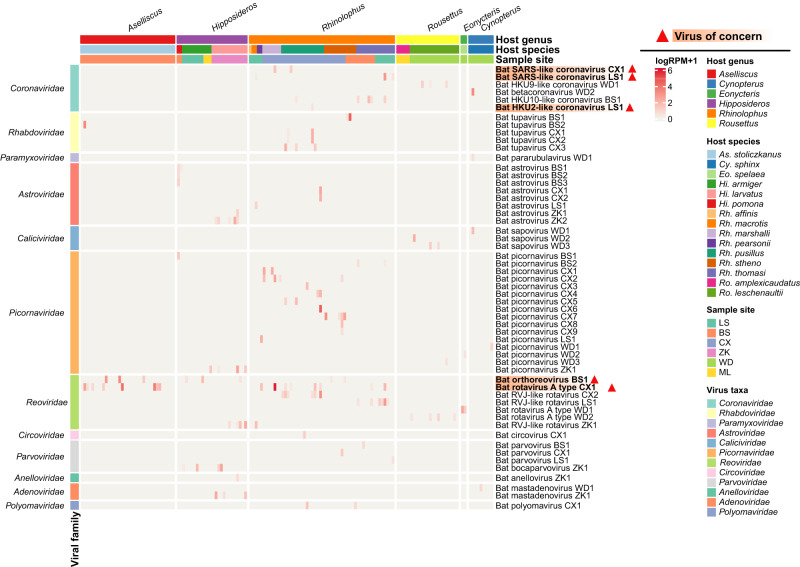
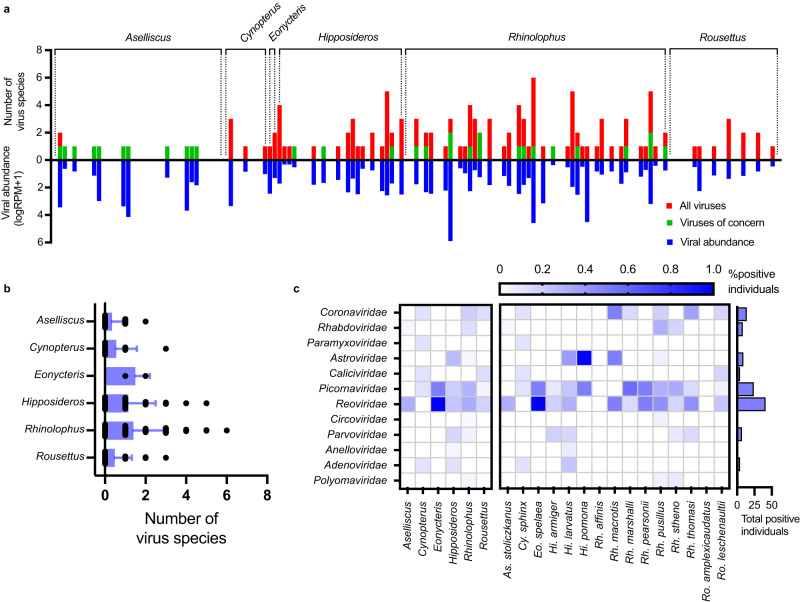
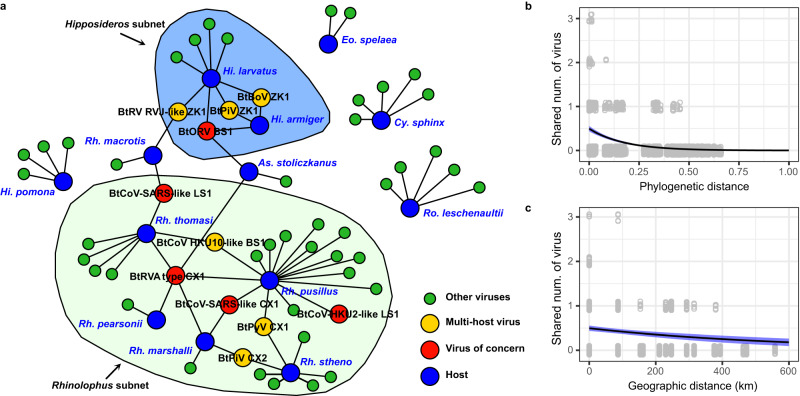
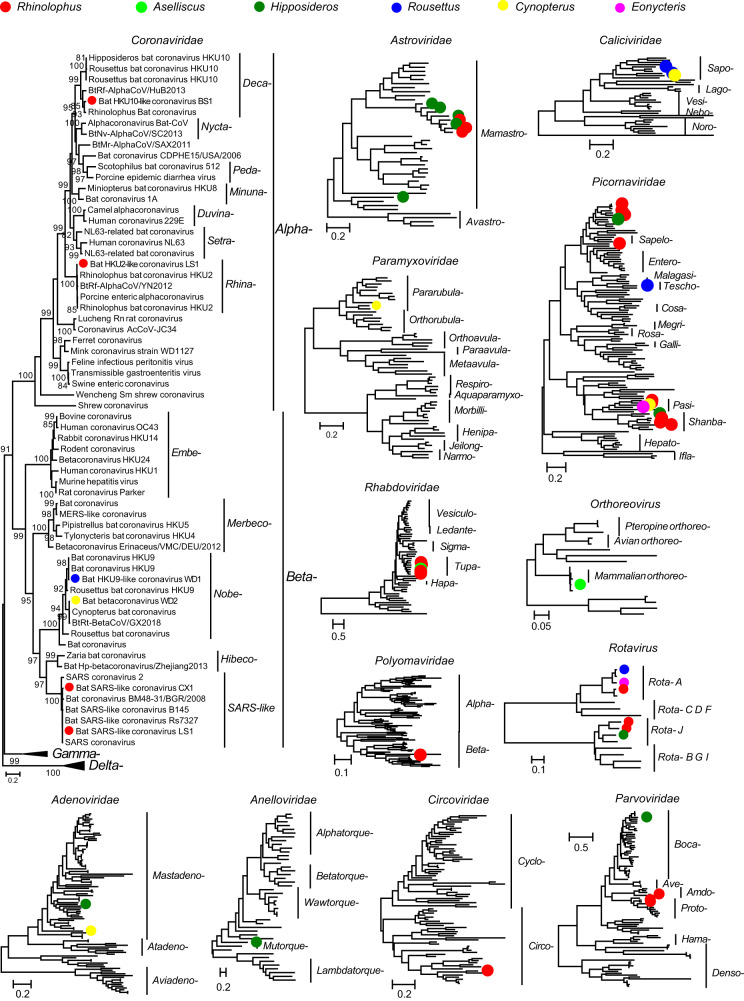
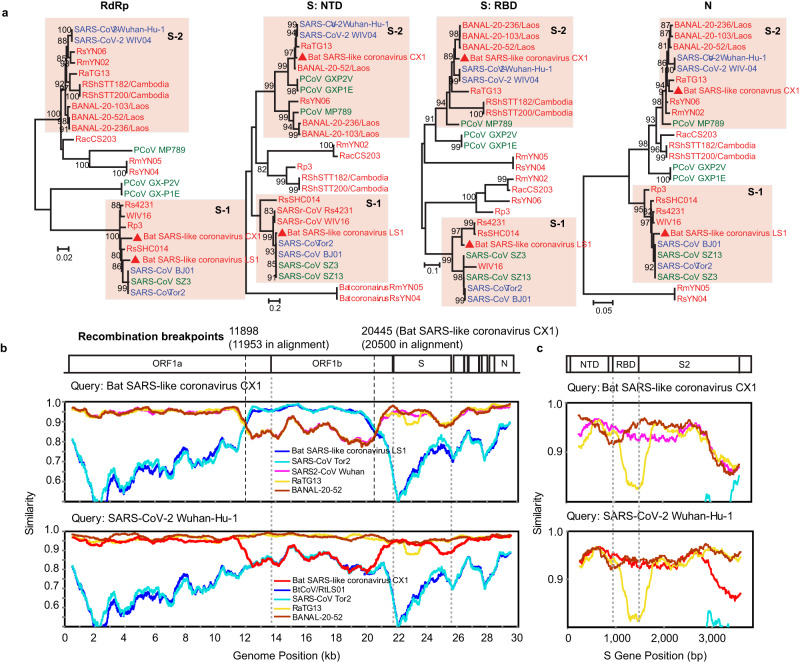
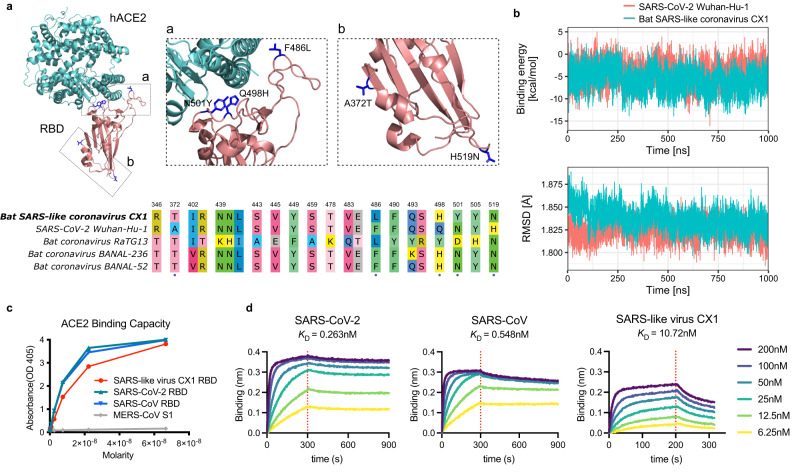
Bats are reservoir hosts for many zoonotic viruses. Despite this, relatively little is known about the diversity and abundance of viruses within individual bats, and hence the frequency of virus co-infection and spillover among them. We characterize the mammal-associated viruses in 149 individual bats sampled from Yunnan province, China, using an unbiased meta-transcriptomics approach. This reveals a high frequency of virus co-infection (simultaneous infection of bat individuals by multiple viral species) and spillover among the animals studied, which may in turn facilitate virus recombination and reassortment. Of note, we identify five viral species that are likely to be pathogenic to humans or livestock, based on phylogenetic relatedness to known pathogens or in vitro receptor binding assays. This includes a novel recombinant SARS-like coronavirus that is closely related to both SARS-CoV and SARS-CoV-2. In vitro assays indicate that this recombinant virus can utilize the human ACE2 receptor such that it is likely to be of increased emergence risk. Our study highlights the common occurrence of co-infection and spillover of bat viruses and their implications for virus emergence.


Conflict of interest statement

The authors declare no competing interests.

Figures

Fig. 1
Fig. 1. Overview of the samples analyzed in this study.
a Locations in Yunnan province China where bat samples were taken. Bar plot on the top shows number of samples per year per site. Pie charts indicate the composition of bat species sampled at each location, while the total area of the pies are proportional to number of captured individuals. Colors indicate different bat species, which are consistent with the coloring scheme in plot (b). b Phylogeny of bats, including those sampled as part of this study. The tree was estimated using nucleotide sequences of bat COI gene utilizing a maximum likelihood (ML) method. Colored strips indicate the bat species sampled in this study. Map data were retrieved from 10.5281/zenodo.4167299. Source data are provided as a Source Data file.
Fig. 2
Fig. 2. Characterization of the mammal-associated virome of bats.
The heatmap displays the distribution and abundance of mammal-associated viruses in individual bats. Each column represents an individual bat, while each row represents a virus species. The abundance of viruses in each individual is represented as a logarithm of the number of mapped reads per million total reads (RPM). Sampling site, host taxonomy (species and genus) and virus taxonomy are shown as colored strips at top and left, respectively. Red triangle marks indicate “viruses of concern”, defined as those that are closely related to known human or livestock pathogens (>90% amino acid similarity in RNA-dependent RNA polymerase). Source data are provided as a Source Data file.
Fig. 3
Fig. 3. Comparison of mammal-associated virus diversity among different bat taxa.
a Virus abundance and the number of virus species in individual bats. Red bars, the total number of mammal-associated viruses per host. Green bars, number of viruses of concern per host. Blue bars represent viral abundance per host as logarithm of the sum of total viral RPM. b Comparison of the number of viruses per individual host among six bat genera (mean + SD). Sample size: Aselliscus n = 35 individual bats, Cynopterus n = 9, Eonycteris n = 2, Hipposideros n = 26, Rhinolophus n = 72, Rousettus n = 23. c Comparison of the prevalence of 11 viral families among different host genera (left block) and species (right block). Source data are provided as a Source Data file.
Fig. 4
Fig. 4. The virus-sharing network of bats.
a The virus-sharing network reveals connectivity among viromes of different bat taxa. Viruses of concern and putative cross-species transmissions are shown in different colors. Two network modules (subnets) were detected with a network betweenness-based criterion and are visualized by colored areas. The relationship between the number of shared viruses with phylogenetic (b) or geographic distance (c) between pairs of host individuals. Phylogenetic distance is calculated as the sum of phylogenetic tree branch length between a pair of hosts, and the tree was estimated with nucleotide sequences of the COI gene employing a maximum likelihood method. The line and blue area mark the estimated partial effect and standard error of phylogenetic or geographic distance by Poisson regression. Blue shaded areas indicate 95% CI. Source data are provided as a Source Data file.
Fig. 5
Fig. 5. Evolutionary relationships of 11 viral families detected in our study.
Phylogenetic trees were estimated using a maximum likelihood method based on conserved replicase protein (RNA viruses: RdRp, Polyomaviridae: LTAg, Anelloviridae: ORF1 protein, Parvoviridae: NS1, and other DNA viruses: DNA pol). Trees were midpoint rooted, and the branch length indicates number of nucleotide substitutions per site. Dots indicate viruses detected in our samples, and colors represent host genus.
Fig. 6
Fig. 6. Phylogenetic and structural analysis of a potentially zoonotic SARS-related coronavirus detected in our samples.
a Phylogenetic trees of four key functional genes of SARS-related coronaviruses. Colors of virus strain names indicate the host taxa where the viruses were detected. Red: bats, blue: human, green: others. Recombination analysis of SARS-related coronaviruses at the whole genome (b) and spike protein (c) scales. Source data are provided as a Source Data file.
Fig. 7
Fig. 7. In silico and in vitro assessment of the hACE2 receptor binding potential of a potentially zoonotic SARS-related coronavirus.
a Top, homology-modeling structure of the receptor-binding domain (RBD) of Bat SARS-like coronavirus CX1 in complex with human angiotensin-converting enzyme 2 (hACE2). Blue-colored residues on RBD indicate amino acid differences compared with SARS-CoV-2 Wuhan-Hu-1. Bottom, alignment of RBD sequences (residues T333 to G526 of spike protein) of Bat SARS-like coronavirus CX1, SARS-CoV-2 Wuhan-Hu-1 and two closely related bat coronavirus. Only polymorphic sites are shown. The five amino acid differences in the RBD of Bat SARS-like coronavirus CX1 compared to SARS-CoV-2 Wuhan-Hu-1 are marked with blue dots. b Molecular dynamics simulation results of binding energy  (top) and binding stability (bottom) of Bat SARS-like coronavirus CX1 RBD-hACE2 complex. c The binding capability of SARS-CoV, SARS-CoV-2 and Bat SARS-like coronavirus CX1 RBD proteins to hACE2 protein was tested with various concentrations of the RBD proteins via ELISA. d The binding kinetics was determined by the biolayer interferometry (BLI) binding analysis. The purified hACE2 were coated on the sensor followed by the injection of various concentrations of SARS-CoV, SARS-CoV-2 and Bat SARS-like coronavirus CX1 RBD proteins. Source data are provided as a Source Data file.

References

    1. Mollentze N, Streicker DG. Viral zoonotic risk is homogenous among taxonomic orders of mammalian and avian reservoir hosts. Proc. Natl Acad. Sci. USA. 2020;117:9423–9430. doi: 10.1073/pnas.1919176117. - DOI - PMC - PubMed
    1. Hayman DTS. Bats as viral reservoirs. Annu. Rev. Virol. 2016;3:77–99. doi: 10.1146/annurev-virology-110615-042203. - DOI - PubMed
    1. Van Brussel K, Holmes EC. Zoonotic disease and virome diversity in bats. Curr. Opin. Virol. 2022;52:192–202. doi: 10.1016/j.coviro.2021.12.008. - DOI - PMC - PubMed
    1. Letko M, Seifert SN, Olival KJ, Plowright RK, Munster VJ. Bat-borne virus diversity, spillover and emergence. Nat. Rev. Microbiol. 2020;18:461–471. doi: 10.1038/s41579-020-0394-z. - DOI - PMC - PubMed
    1. Ruiz-Aravena, M. et al. Ecology, evolution and spillover of coronaviruses from bats. Nat. Rev. Microbiol.20, 299–314 (2021). - PMC - PubMed

Publication types