. 2023 Aug;5(8):1364-1381.
doi: 10.1038/s42255-023-00838-3. Epub 2023 Jul 10.

Targeting the TCA cycle can ameliorate widespread axonal energy deficiency in neuroinflammatory lesions

Affiliations

Targeting the TCA cycle can ameliorate widespread axonal energy deficiency in neuroinflammatory lesions

Yi-Heng Tai et al. Nat Metab. 2023 Aug.

Abstract

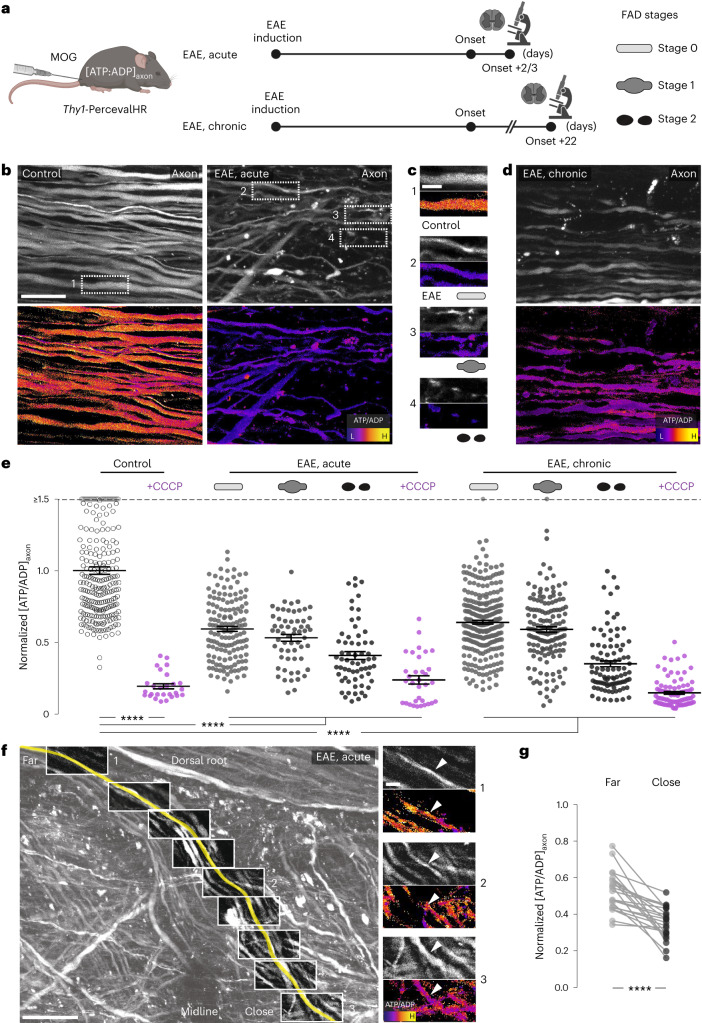
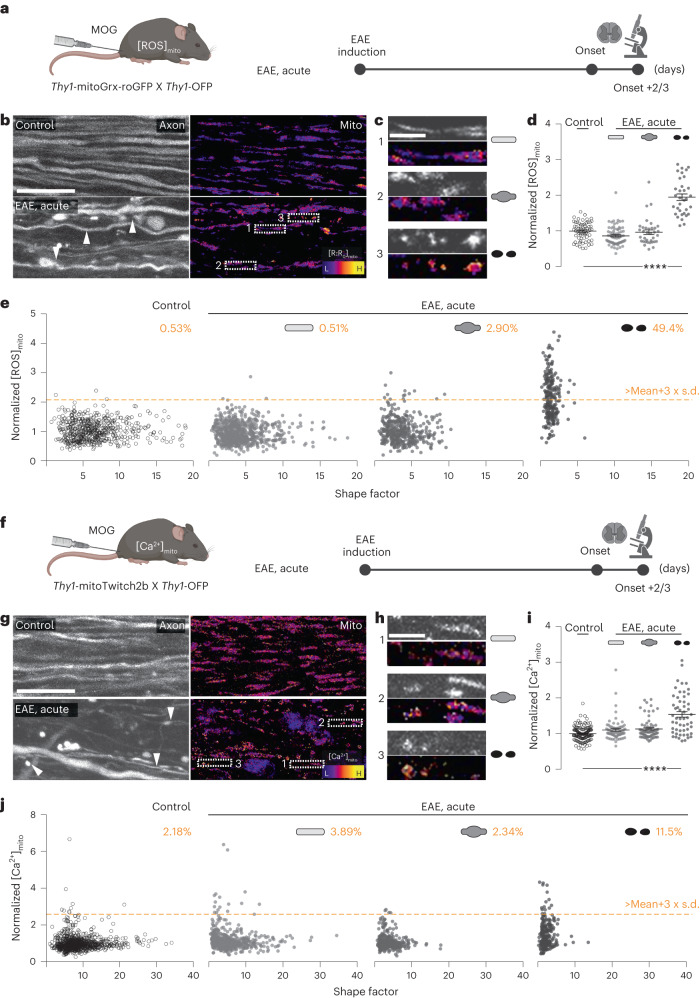
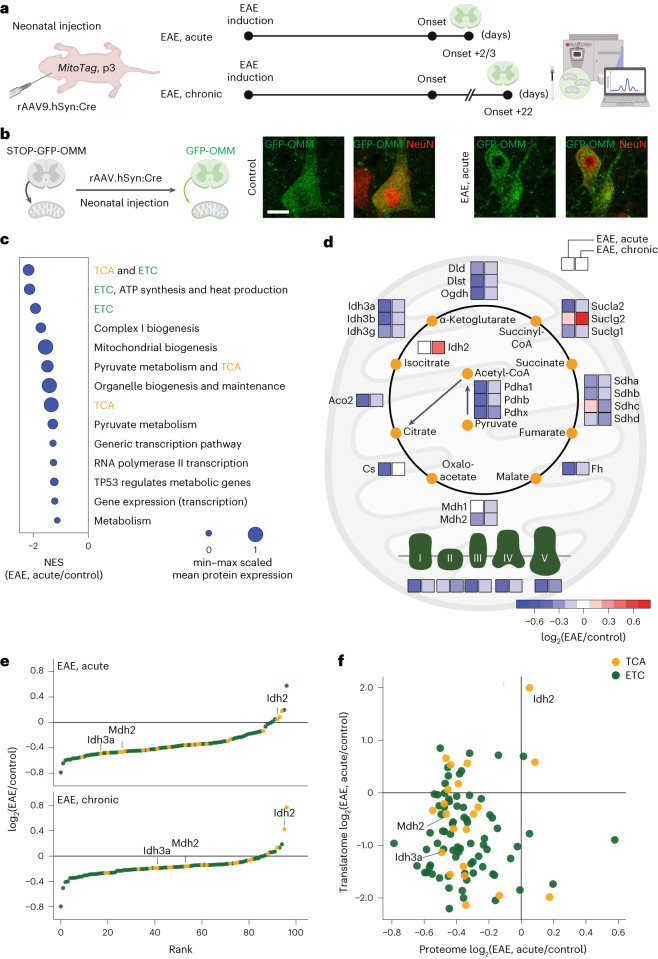
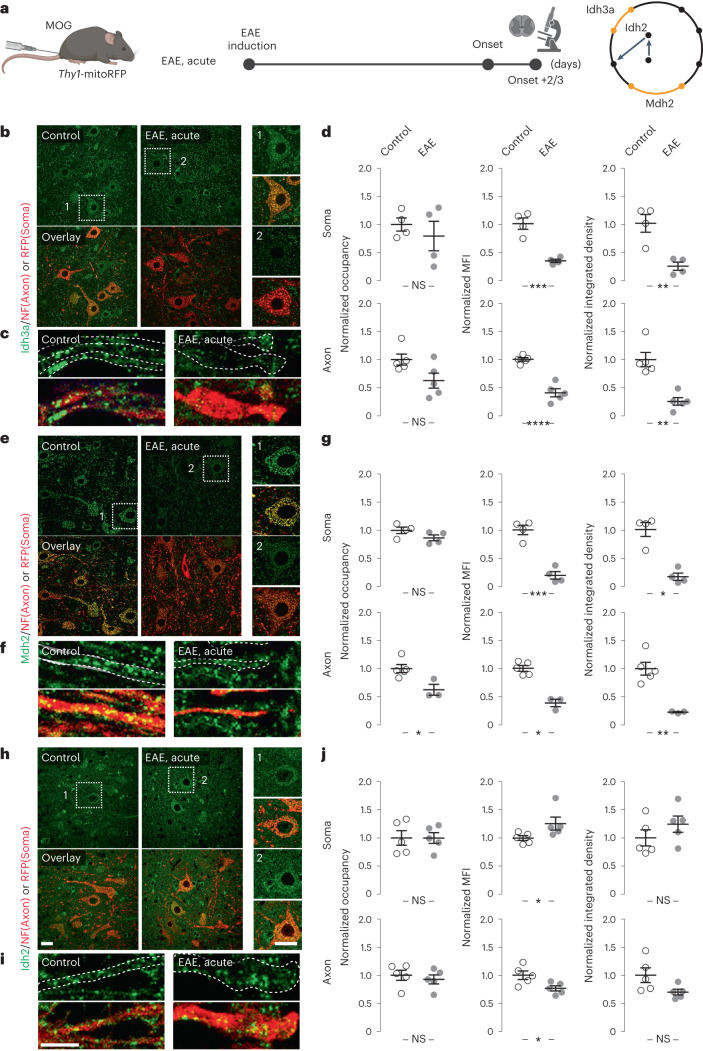
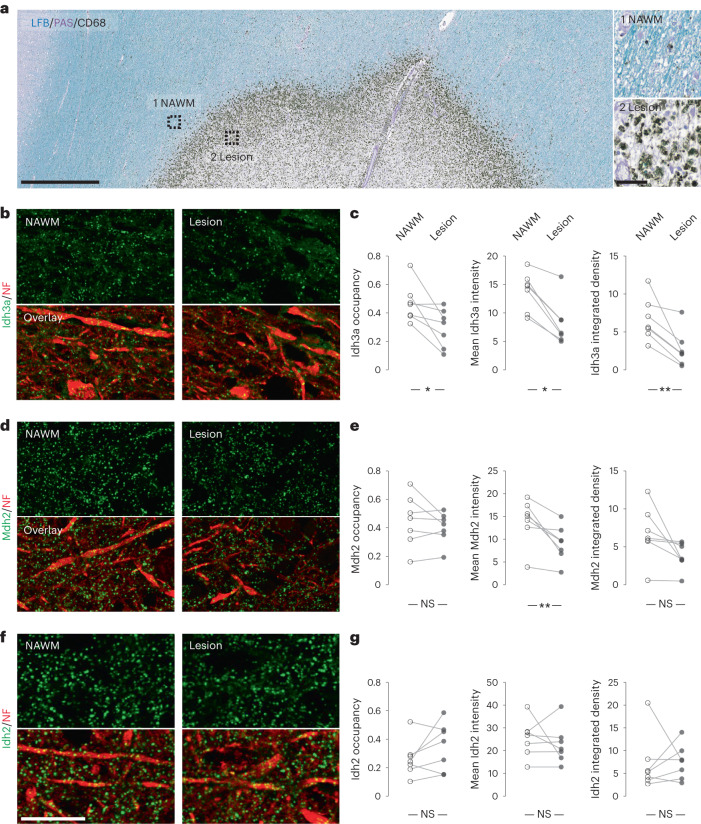
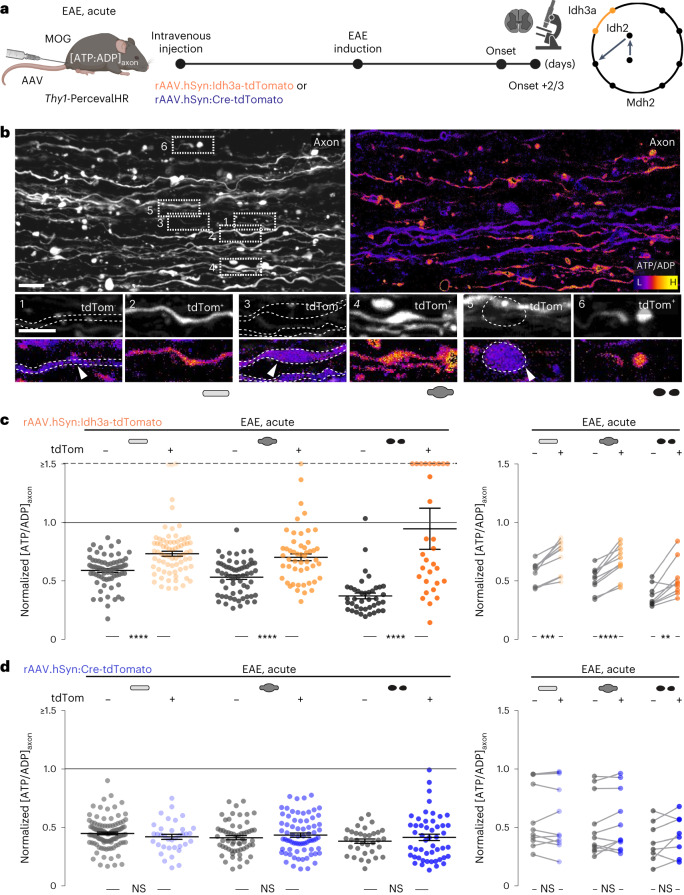
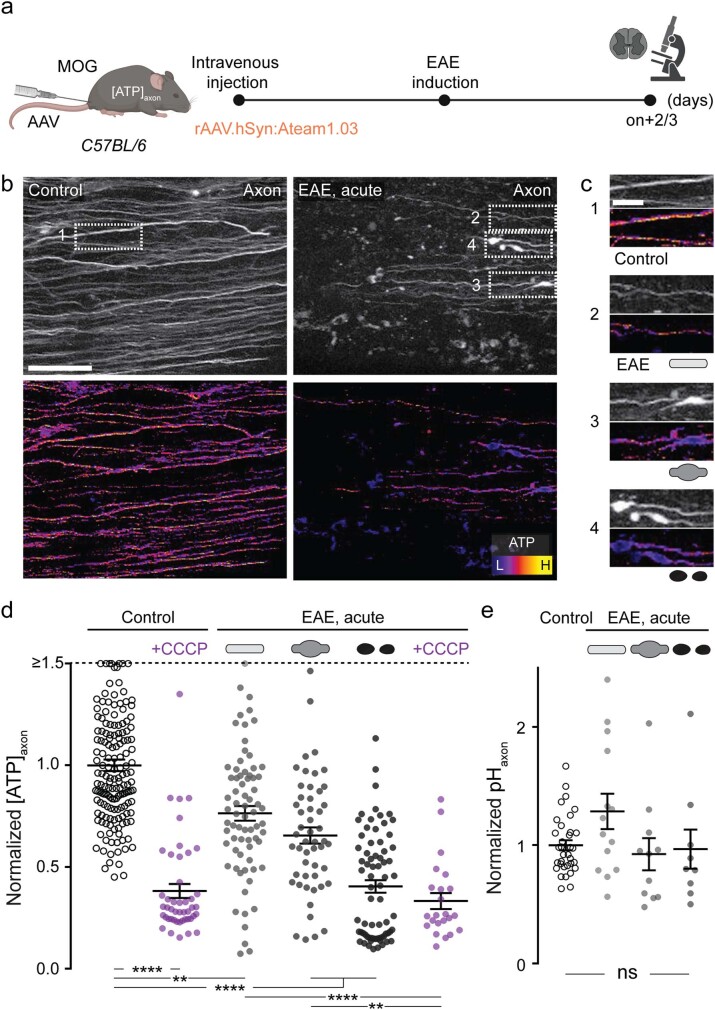
Inflammation in the central nervous system can impair the function of neuronal mitochondria and contributes to axon degeneration in the common neuroinflammatory disease multiple sclerosis (MS). Here we combine cell-type-specific mitochondrial proteomics with in vivo biosensor imaging to dissect how inflammation alters the molecular composition and functional capacity of neuronal mitochondria. We show that neuroinflammatory lesions in the mouse spinal cord cause widespread and persisting axonal ATP deficiency, which precedes mitochondrial oxidation and calcium overload. This axonal energy deficiency is associated with impaired electron transport chain function, but also an upstream imbalance of tricarboxylic acid (TCA) cycle enzymes, with several, including key rate-limiting, enzymes being depleted in neuronal mitochondria in experimental models and in MS lesions. Notably, viral overexpression of individual TCA enzymes can ameliorate the axonal energy deficits in neuroinflammatory lesions, suggesting that TCA cycle dysfunction in MS may be amendable to therapy.


Conflict of interest statement

The authors declare no competing interests.

Figures

Fig. 1
Fig. 1. Early and pervasive axonal ATP deficits in EAE lesions.
a, Experimental design for axonal ATP/ADP ratio ([ATP/ADP]axon) measurements in EAE. b, Maximum intensity projections of in vivo multi-photon image stacks of spinal cord axons of control (left) and acute EAE (right) in Thy1-PercevalHR mice. Grayscale look-up table (LUT; λex 950 nm) (top). Ratiometric [ATP/ADP]axon LUT (λex ratio 950 nm:840 nm) (bottom). L, low; H, high. c, Details from b. [ATP/ADP]axon images of control axon in healthy spinal cord and normal-appearing, swollen and fragmented axons in acute EAE (top to bottom). d, Spinal cord axons during chronic EAE shown as in b. e, [ATP/ADP]axon of single axons in healthy and EAE mice normalized to mean of controls (magenta: axons after CCCP, 100 μM; mean ± s.e.m.; 246 axons from six control, 272 axons from four EAE, acute and 522 axons from six EAE, chronic mice; compared by Kruskal–Wallis and Dunn’s multiple comparison test; values ≥ 1.5 are lined up on the ‘≥1.5’ dashed line). f, [ATP/ADP]axon gradient in a dorsal root axon traced through a lesion using in vivo multi-photon imaging. Traced axon pseudo-colored yellow, running from root at top left to the lesion center at lower right, superimposed on full volume projection, grayscale LUT, λex 950 nm (left). Boxes indicate locations of high-resolution stacks. Details showing the [ATP/ADP]axon gradient between locations far from (1) versus close to the lesion (3) (right). LUTs as in b. g, Paired analysis of [ATP/ADP]axon far versus close to the lesion (n = 22 axons from three EAE mice; two-tailed, paired t-test; normalized to control). Scale bars, 25 μm in b, also applied to d; 10 μm in c and f (right); 100 μm in f (left). ****P < 0.001. See source data for individual data points and further statistical parameters. Illustration created with BioRender. Source data
Fig. 2
Fig. 2. Late changes in axonal ROS and calcium homeostasis in EAE lesions.
a, Experimental design to measure mitochondrial ROS ([ROS]mito) in EAE. b, Maximum intensity projections of in vivo confocal image stacks of spinal cord axons of control (top) and acute EAE (bottom) in Thy1-mitoGrx-roGFP × Thy1-OFP mice. Orange fluorescent protein (OFP) channel shown with grayscale LUT (left). Ratiometric LUT of [ROS]mitoex ratio 405 nm/488 nm, indicated as R/R0) (right). c, Details from b. Mitochondrial morphologies and [ROS]mito in normal-appearing, swollen and fragmented axons in acute EAE; grayscale LUT of OFP channel above ratiometric [ROS]mito images (top to bottom). d, Average [ROS]mito of single axons in control and acute EAE mice normalized to control mean (mean ± s.e.m.; 63 axons from five control mice and 137 axons from six EAE mice compared by one-way analysis of variance (ANOVA) and Tukey’s multiple comparison test). e, Single-organelle correlation analysis of mitochondrial shape factor (length:width ratio) and [ROS]mito of axons plotted in d. Percentages indicate fraction of mitochondria with [ROS]mito > control mean + 3 × s.d. (orange line) in each axon stage. f, Experimental design to measure mitochondrial Ca2+ levels ([Ca2+]mito) in EAE. g, Maximum intensity projections of in vivo multi-photon images of spinal cord axons of control (top) and acute EAE (bottom) in Thy1-mitoTwitch2b × Thy1-OFP mice. OFP channel shown with grayscale LUT (left). Ratiometric LUT of [Ca2+]mito (yellow fluorescent protein (YFP) to cyan fluorescent protein (CFP) emission ratio) (right). h, Details from g. Mitochondria morphologies and Ca2+mito represented as in c; grayscale LUT of OFP channel above ratiometric Ca2+mito images (top to bottom). i, Average Ca2+mito of single axons in control and acute EAE mice normalized to mean of controls (mean ± s.e.m.; 138 axons from nine control mice and 192 axons from 11 EAE mice compared by one-way ANOVA and Tukey’s multiple comparison test). j, Single-organelle correlation analysis of mitochondrial shape factor (length:width ratio) and [Ca2+]mito of axons plotted in i. Percentages indicate fraction of mitochondria with [Ca2+]mito > control mean + 3 × s.d. (orange line) in each axon stage. Arrow heads indicate axons with different FAD stages. Scale bars, 25 μm (b,g) and 10 μm (c,h). ****P < 0.001. See source data for individual data points and further statistical parameters. Illustration created with BioRender. Source data
Fig. 3
Fig. 3. ETC depletion and TCA cycle imbalance in neurons during EAE.
a, Experimental design for combined AAV/MitoTag-based proteomic analysis of neuronal mitochondria in EAE. b, Confocal image of GFP expression (green) in rAAV9.hSyn:Cre transduced neurons (NeuN; red) in a control and EAE MitoTag mouse spinal cord. c, Annotations of the most downregulated pathways (Reactome,, v.7.4) in MitoTag proteomes of neuronal mitochondria in acute EAE. Dot size indicates min–max scaled mean protein expression level ranged from 0 to 1. NES, normalized enrichment score. d, Relative abundance of the TCA cycle and ETC components in neuronal mitochondria. Average shown as color-coded log2(EAE/control) for acute and chronic EAE compared to respective controls. e, Rank of TCA cycle (orange) and ETC (green) proteins according to log2FC expression in acute (top) and chronic (bottom) EAE. f, Correlation between neuronal transcript and protein levels of TCA cycle and ETC proteins in EAE. Translatomic data were re-analyzed from Schattling et al.. The acute cohort was collected from six control and five EAE acute mice and the chronic cohort was collected from five control and five EAE chronic mice. Scale bars, 25 μm in b. See source data for individual data points and further statistical parameters. See source data for individual data points and further statistical parameters. Illustration created with BioRender. Source data
Fig. 4
Fig. 4. TCA cycle enzymes, Idh3, Idh2 and Mdh2, are dysregulated in neurons in EAE.
a, Experimental design to validate dysregulated TCA cycle enzymes identified by MitoTag proteomics in EAE. bj, Immunofluorescence analysis of Idh3a (bd), Mdh2 (eg) and Idh2 (hj) in spinal cord neuronal somata (top) and axons (bottom) of control (left) or of acute EAE (right) Thy1-mitoRFP mice (TCA cycle enzymes, green; RFP, red for neuronal mitochondria in somata or neurofilament (NF) for axonal staining, respectively). Graphs (d,g,j) show area occupancy (soma, P = 0.5009 for Idh3a, 0.1371 for Mdh2 and 0.9907 for Idh2; axon, P = 0.053 for Idh3a, 0.0357 for Mdh2 and 0.5615 for Idh2), mean fluorescence intensities (MFIs) (soma, P = 0.0007 for Idh3a, 0.0003 for Mdh2 and 0.0317 for Idh2; axon, P = 0.00006 for Idh3a, 0.0357 for Mdh2 and 0.0299 for Idh2) and their product, integrated density (soma, P = 0.0046 for Idh3a, 0.0286 for Mdh2 and 0.265 for Idh2; axon, P = 0.0079 for Idh3a, 0.0023 for Mdh2 and 0.0653 for Idh2), in EAE neuronal somata and axons normalized to the mean of control (mean ± s.e.m.; compared per animal by two-tailed, unpaired Student’s t-test or Mann–Whitney U-test where normal distribution could not be confirmed from four control and four EAE mice for Idh3a and Mdh2; five control and five EAE mice for Idh2. Scale bar, 25 μm (h) applies also to b,e and their details; 10 μm (i), applies also to c and f. *P < 0.05; **P < 0.01, ***P < 0.005; ****P < 0.001; NS, not significant. See source data for individual data points and further statistical parameters. Illustration created with BioRender. Source data
Fig. 5
Fig. 5. TCA cycle enzymes, Idh3, Idh2 and Mdh2, are dysregulated in neurons in MS.
a, Overview of an MS lesion in human cortex, with areas of NAWM and the lesion site marked and magnified in insets. Myelin (Luxol fast blue, LFB, blue; periodic acid–Schiff, PAS, purple) and macrophages (CD68, black) are labeled. b,c, Immunofluorescence analysis of Idh3a in cortical axons in NAWM (left) or lesion areas (right; Idh3a, green; NF, red). d,e, Immunofluorescence analysis of Mdh2 in cortical axons in NAWM (left) or lesion areas (right; Mdh2, green; NF, red). f,g, Immunofluorescence analysis of Idh2 in cortical axons in NAWM (left) or lesion areas (right; Idh2, green; NF, red). Graphs (c,e,g show area occupancy (P = 0.0251 for Idh3a, 0.2995 for Mdh2 and 0.1599 for Idh2), MFIs (P = 0.0156 for Idh3a, 0.0099 for Mdh2 and 0.5144 for Idh2) and their product, integrated density (P = 0.0075 for Idh3a, 0.0606 for Mdh2 and 0.6875 for Idh2), in pairs of NAWM and lesion areas from seven cases, as listed in Extended Data Table 1 and compared by two-tailed, paired t-test or Wilcoxon matched-pairs signed-rank test where normal distribution could not be confirmed. Scale bars, 1,000 μm (a); 50 μm in inset; 25 μm (f), also applies to b and d. *P < 0.05; **P < 0.01; NS, not significant. See source data for individual data points and further statistical parameters. Source data
Fig. 6
Fig. 6. Idh3 overexpression ameliorates axonal ATP deficits in EAE lesions.
a, Experimental design to measure [ATP/ADP]axon in acute EAE in Thy1-PercevalHR mice that virally overexpressed Idh3a or a control protein (Cre recombinase) together with tdTomato in a subset of axons. b, Maximum intensity projections of in vivo multi-photon image stacks of spinal cord axons in Idh3a-overexpressing Thy1-PercevalHR mice. Grayscale LUT of tdTomato (left). Ratiometric [ATP/ADP]axon LUT (λex ratio 950 nm/840 nm) (right). Details below show image pairs of tdTomato-negative (tdTom, left) and tdTomato-positive (tdTom+, right) normal-appearing, swollen and fragmented axons (tdTom has dashed outlines) in acute EAE. c, Comparison of [ATP/ADP]axon in tdTom+ and tdTom axons (plotted as λex ratio 950 nm/840 nm, normalized to control axon mean indicated as the black line; values above 1.5 are lined up on the ‘≥1.5’ dashed line). [ATP/ADP]axon of single tdTom (gray) and tdTom+ (orange) axons in Idh3a-overexpressing EAE mice (left). Lesion-specific paired analysis of mean [ATP/ADP]axon in tdTom (gray) and tdTom+ (orange) axon populations of the three morphological stages (right). d, Same analysis as c, but in a mouse cohort overexpressing a control protein (Cre recombinase). Mean ± s.e.m. Comparison of 176 tdTom axons versus 153 tdTom+ axons in 12 lesions from four mice in c; 214 tdTom axons versus 159 tdTom+ axons in 11 lesions from three mice in d using a two-tailed, unpaired Student’s t-test (c,d, left graphs) and a paired t-test (c,d, right graphs). Scale bar, 25 μm (b). **P < 0.01; ***P < 0.005; ****P < 0.001. See source data for individual data points and further statistical parameters. Illustration created with BioRender. Source data
Extended Data Fig. 1
Extended Data Fig. 1. Transgenic mouse lines to measure neuronal ATP/ADP ratio and mitochondrial calcium.
(a) CNS expression pattern of Thy1-PercevalHR mice. Confocal images of sagittal brain (left) and transverse spinal cord (SC) section (right; grayscale LUT; λex 488 nm). (b) Maximum intensity projections of in vivo multi-photon image stacks of axons in a Thy1-PercevalHR mouse spinal cord before (left) and after (middle) CCCP application. Individual frames in boxed area spanning 0 to 13 minutes after CCCP application (right). Ratiometric [ATP/ADP]axon LUT (λex ratio 950 nm/840 nm). (c) [ATP/ADP]axon of single axons before and after CCCP (100 μM, 15 min; left) and IAA (10 mM, 15 min; right) application, which interfere with oxidative phosphorylation and glycolysis, respectively. Values are normalized to mean of control. Mean ± s.e.m.; n = 27 axons from three mice with CCCP and 28 axons from three mice with IAA, compared by Mann-Whitney test, p = 10-15 and 7.1 × 10⁻¹³, respectively. Scale bars: 1000 μm in a, left; 500 μm in a, right; 25 μm in b. ****, p < 0.001. (d) CNS expression pattern of Thy1-mitoTwitch2b mice. Confocal images of sagittal brain (left) and transverse SC section (right; YFP channel using grayscale LUT). (e) Maximum intensity projections of in vivo multi-photon image stacks of axonal mitochondria in a Thy1-mitoTwitch2b mouse spinal cord before (left) and after (right) laser lesion. Top: YFP channel using grayscale LUT; Bottom: Ratiometric [Ca2+]mito LUT (YFP/CFP emission ratio). Insets: Details from respective panels. (f) [Ca2+]mito of axonal mitochondria before and after laser lesion (n > 150 mitochondria from 8 axons, three mice). Percentages indicate the fraction of axons with [Ca2+]mito > mean + 3 SD of values pre-lesion (orange line). Scale bars: 1000 μm in d, left; 500 μm in d, right; 20 μm in e; 10 μm in inset. See source data for individual data points and further statistical parameters. Illustration created with BioRender. Source data
Extended Data Fig. 2
Extended Data Fig. 2. Early axonal ATP deficits measured using ATeam in EAE.
(a) Experimental design for axonal ATP level measurement in experimental autoimmune encephalomyelitis (EAE). (b) Maximum intensity projections of in vivo multi-photon image stacks of spinal cord axons of control (left) and acute EAE (right) in AAV.PHPeB.hSyn:ATeam injected C57BL/6 mice. Top: Grayscale look-up table (LUT; λex 840 nm). Bottom: Ratiometric [ATP]axon LUT (YFP/CFP emission ratio). (c) Details from b. Top to bottom: [ATP]axon images of control axon in healthy spinal cord and normal-appearing, swollen, and fragmented axons in acute EAE. (d) [ATP]axon of single axons in healthy and EAE mice normalized to mean of controls. Mean ± s.e.m.; n = 157 axons from three control and 195 axons from four EAE mice compared by Kruskal-Wallis and Dunn’s multiple comparison test; values above 1.5 lined up on the “≥1.5” dashed line, p < 0.001, control versus control + CCCP; p = 0.001, 5.4 × 10⁻⁷, < 0.001, control versus stage 0, 1 and 2, respectively; p = 6.1 × 10⁻⁶, 0.0057, > 0.9999, EAE + CCCP versus stage 0, 1 and 2, respectively. (e) [pH]axon of single axons measured by using SypHer3s sensor in control and acute EAE mice normalized to mean of controls. Mean ± s.e.m.; n = 34 axons from two control and 34 axons from two EAE mice, compared Kruskal-Wallis and Dunn’s multiple comparison test, p > 0.9999, control versus stage 0, 1 and 2, respectively. Scale bars: 25 μm in b; 10 μm in c. **, p < 0.01; ****, p < 0.001. See source data for individual data points and further statistical parameters. Illustration created with BioRender. Source data
Extended Data Fig. 3
Extended Data Fig. 3. Proteomics analysis of neuronal mitochondria in EAE.
(a) CNS expression pattern of MitoTag mouse injected with rAAV.hSyn:Cre. Confocal images of the sagittal brain (left) and transverse spinal cord (SC) section (right; grayscale LUT; λex 488 nm). (b) Relative expression level (z-score for label-free quantification intensity, LFQ) of proteins quantified by mass spectrometry in MitoTag isolations that are annotated as mitochondrial proteins in MitoCarta 2.0 (mito) or not (ϕmito), p = 6.14 × 10-105 (c) Principal component analysis of MitoTag proteomics control and acute EAE samples. (d) Expression level (log2 of LFQ) of proteins annotated in MitoCarta 2.0 to reside in different mitochondrial subcompartments in control (gray) and acute EAE (black), including outer membrane (OMM, p = 0.075), inner membrane (IMM, p = 0.0013), intermembrane space (IMS, p = 0.26) and matrix (p = 0.00012) relative to all MitoCarta proteins. (e) Same as d, but for nuclear- vs. mitochondrial DNA-encoded proteins, p = 0.59 and 0.98, respectively. (f) Fold change (log2 of LFQ ratio of EAE over Control) versus protein half-life (as measured in Fornasiero et al). (g) Location of the TCA cycle (top, orange) and electron transport chain (ETC; bottom, green) proteins on the correlation plot of protein abundance (z score of label-free quantification values, LFQ) vs. fold change (log2 of LFQ ratio acute EAE over control). The vertical lines indicate the mean ± 1 SD, compared using a two-tailed, unpaired Student’s t-test. Biological replicates: n ≥ 3. (h) Annotations of the most regulated pathways (Reactome,, version 7.4) in MitoTag proteomes of neuronal mitochondria in acute EAE. Scale bars: 1000 μm in a, left; 500 μm in a, right. ****, p < 0.001. See source data for individual data points and further statistical parameters. See source data for individual data points and further statistical parameters. Illustration created with BioRender. Source data
Extended Data Fig. 4
Extended Data Fig. 4. Expression of ETC components in EAE neurons.
(a) Top: Schematic of the experiment, analysis of same data sets as shown in Fig. 3. Bottom: Relative abundance of individual ETC complex components in neuronal mitochondria. Average shown as color-coded log2(EAE/Control) for acute and chronic EAE compared to respective controls. (b) In situ analysis of axonal COX IV activity using in situ histochemical assay in Thy1-OFP EAE spinal cords. Top: Schematic of the experiment. Bottom: Confocal image of control and EAE stage 1 axons, OFP (red) and COX IV (arrow heads indicate mitochondria as dark areas, as fluorescence of OFP is quenched by reaction product of COX IV assay). (c) Quantification of COX IV activity signal’s occupancy of OFP axon area on axonal level. Mean ± s.e.m.; n = 180 axons from nine mice for control and 208 axons from nine mice for EAE using a two-tailed, Mann-Whitney test, p = 5.2 × 10⁻¹². Scale bar: 25 μm in b. ****, p < 0.001. See source data for individual data points and further statistical parameters. Illustration created with BioRender. Source data
Extended Data Fig. 5
Extended Data Fig. 5. Viral overexpression of Idh3a in EAE neurons.
(a) Schematic of experiment, analysis of same data sets as shown in Fig. 6. (b) Confocal images of spinal cord sections of a Thy1-PercevalHR mouse (green) that was injected with rAAV.hSyn:Idh3a-tdTomato (tdTomato, tdTom, red). Bottom row shows immunostainings for Idh3a, with details highlighting, left, a tdTomato-negative (tdTom) and, right, a tdTomato-positive (tdTom+) neuron with Idh3a overexpression. (c) Expression level of Idh3a in tdTomato-negative (tdTom) and tdTomato-positive (tdTom+) neurons (mean ± s.e.m.; n = 266 tdTom neurons and 803 tdTom+ neurons using two-tailed, Mann-Whitney test, p < 0.001). Scale bar: 25 μm (top) and 10 μm (bottom) in b. ****, p < 0.001. See source data for individual data points and further statistical parameters. Illustration created with BioRender. Source data
Extended Data Fig. 6
Extended Data Fig. 6. Chronic Idh3 overexpression modestly ameliorates axonal ATP deficits in EAE lesions.
(a) Experimental design for [ATP/ADP]axon measurements in chronic EAE in Thy1- PercevalHR mice virally overexpressing Idh3a or a control protein (Cre recombinase) and tdTomato in a subset of axons. (b) In vivo multi-photon image projections of chronically Idh3a-overexpressing Thy1-PercevalHR spinal axons. Left: Grayscale LUT of tdTomato. Right: Ratiometric [ATP/ADP]axon LUT (λex ratio 950 nm/840 nm). Details: Image pairs of tdTomato-negative (tdTom; left) and -positive (tdTom+; right) normal-appearing, swollen, and fragmented axons. (c) Comparison of [ATP/ADP]axon in tdTom and tdTom+ axons (λex ratio 950 nm/840 nm, normalized to control axon mean indicated by black line; values above 1.5 lined up on the “≥1.5” dashed line). Left: [ATP/ADP]axon of single tdTom (gray) and tdTom+ (orange) axons. Right: Lesion-specific paired analysis of mean [ATP/ADP]axon in tdTom (gray) and tdTom+ (orange) axon populations of the three morphological stages. Mean ± s.e.m. Comparison of 130 tdTomversus 115 tdTom+ axons in 12 lesions from four mice in c using two-tailed, unpaired Student’s t-test or Mann-Whitney test where normal distribution could not be confirmed (c, left graphs; p = 7 × 10⁻⁶, 9.9 × 10⁻⁵ and 3.8 × 10⁻⁵ for stages 0, 1 and 2) and a paired t-test (right graph; 0.001, 0.0273 and 0.0547 for stages 0, 1 and 2.) (d) Paired analysis of the frequency of stage 0, 1 and 2 in tdTom (gray) and tdTom+ (orange) axon populations. Mean ± s.e.m. Comparison of 551 tdTom versus 539 tdTom+ axons in 38 lesions from six mice in d using two-tailed, paired Student’s t-test or Wilcoxon test where normal distribution could not be confirmed (p = 0.2108, 0.743 and 0.0575 for stage 0, 1 and 2). Scale bars: 25 μm in b. *, p < 0.05; ***, p < 0.005; ****, p < 0.001. See source data for individual data points and further statistical parameters. Illustration created with BioRender. Source data
Extended Data Fig. 7
Extended Data Fig. 7. Mdh2 overexpression ameliorates axonal ATP deficits in EAE lesions.
(a) Experimental design for [ATP/ADP]axon in acute EAE in Thy1-PercevalHR mice that virally overexpressed Mdh2 together with tdTomato in a subset of axons. (b) Maximum intensity projections of in vivo multi-photon image stacks of spinal cord axons in Mdh2-overexpressing Thy1-PercevalHR mice. Left: Grayscale LUT of tdTomato. Right: Ratiometric [ATP/ADP]axon LUT (λex ratio 950 nm/840 nm). Details show image pairs of tdTomato-negative (left) and -positive (right) normal-appearing, swollen, and fragmented axons in acute EAE. (c) Comparison of [ATP/ADP]axon in tdTomato-positive (tdTom+) and -negative (tdTom) axons (plotted as λex ratio 950 nm/840 nm, normalized to control axon mean indicated as the black line; values above 1.5 lined up on the “≥1.5” dashed line). Left: [ATP/ADP]axon of single tdTom (gray) and tdTom+ (orange) axons in Mdh2-overexpressing EAE mice, mean ± s.e.m. of tdTom+ stage 2 axons are above 1.5. Right: Lesion-specific paired analysis of mean [ATP/ADP]axon in tdTom (gray) and tdTom+ (orange) axon populations of the three morphological stages. Mean ± s.e.m. Comparison of 110 tdTomaxons versus 112 tdTom+ axons in 14 lesions from four mice in using two-tailed, unpaired Student’s t-test or Mann-Whitney test where normal distribution could not be confirmed (left graph; p = 0.8851, 0.1804 and 0.0039 for stage 0, 1 and 2, respectively) and a paired t-test or Wilcoxon test where normal distribution could not be confirmed (right graph; 0.3225, 0.004 and 0.0609 for stage 0, 1 and 2, respectively). Scale bar: 25 μm in b. **, p < 0.01. See source data for individual data points and further statistical parameters. Illustration created with BioRender. Source data
Extended Data Fig. 8
Extended Data Fig. 8. Prediction of energy state using QSM™-based metabolic profiling.
(a) Comparisons of predicted maximal ATP production based on AAV/MitoTag-based proteomic analysis in control, EAE, modeled overexpression (Xn) of ETC, TCA cycle and both ETC and TCA cycle. (b) Predicted cytosolic ATP/ADP ratio with increasing metabolic load in EAE (dark gray) compared to healthy control (light gray). See source data for individual data points and further statistical parameters. Illustration created with BioRender. Source data

References

    1. Friese MA, Schattling B, Fugger L. Mechanisms of neurodegeneration and axonal dysfunction in multiple sclerosis. Nat. Rev. Neurol. 2014;10:225–238. doi: 10.1038/nrneurol.2014.37. - DOI - PubMed
    1. Mahad DH, Trapp BD, Lassmann H. Pathological mechanisms in progressive multiple sclerosis. Lancet Neurol. 2015;14:183–193. doi: 10.1016/S1474-4422(14)70256-X. - DOI - PubMed
    1. Absinta M, Lassmann H, Trapp BD. Mechanisms underlying progression in multiple sclerosis. Curr. Opin. Neurol. 2020;33:277–285. doi: 10.1097/WCO.0000000000000818. - DOI - PMC - PubMed
    1. Misgeld T, Schwarz TL. Mitostasis in neurons: maintaining mitochondria in an extended cellular architecture. Neuron. 2017;96:651–666. doi: 10.1016/j.neuron.2017.09.055. - DOI - PMC - PubMed
    1. Mahad DJ, et al. Mitochondrial changes within axons in multiple sclerosis. Brain. 2009;132:1161–1174. doi: 10.1093/brain/awp046. - DOI - PMC - PubMed

Publication types