. 2023 Oct;18(10):1241-1251.
doi: 10.1038/s41565-023-01419-x. Epub 2023 Jul 10.

Adeno-associated viral vectors for functional intravenous gene transfer throughout the non-human primate brain

Affiliations

Adeno-associated viral vectors for functional intravenous gene transfer throughout the non-human primate brain

Miguel R Chuapoco et al. Nat Nanotechnol. 2023 Oct.

Abstract

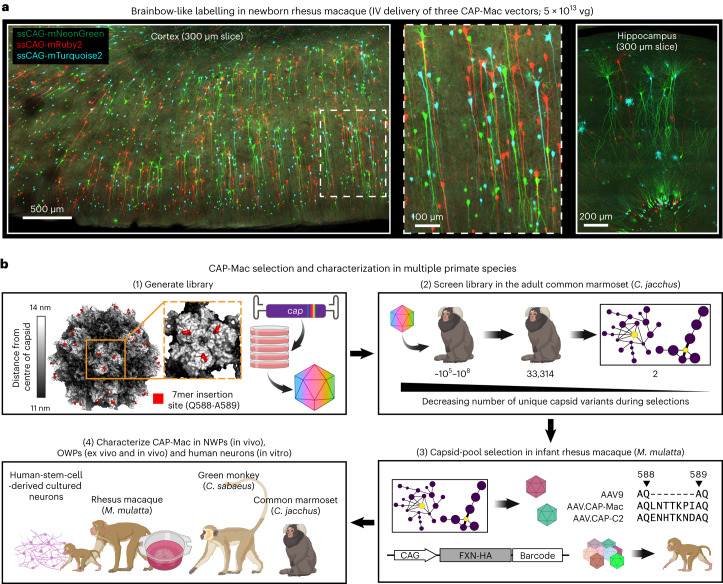
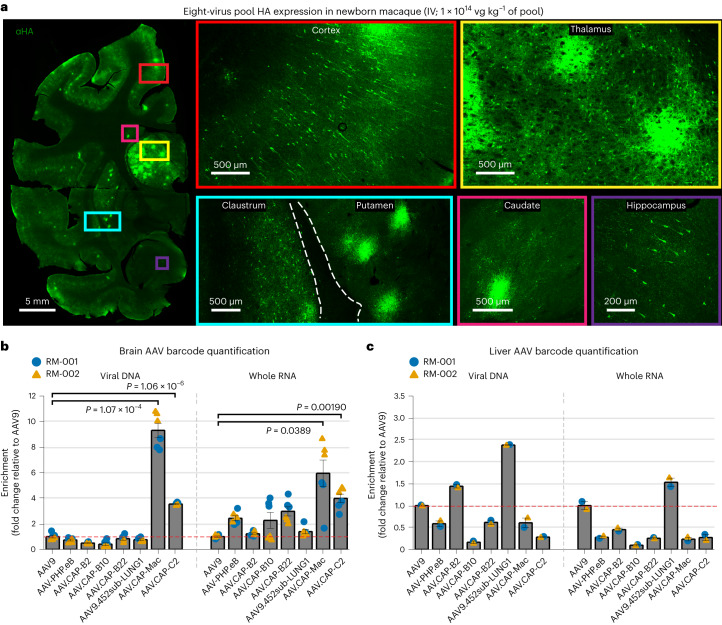
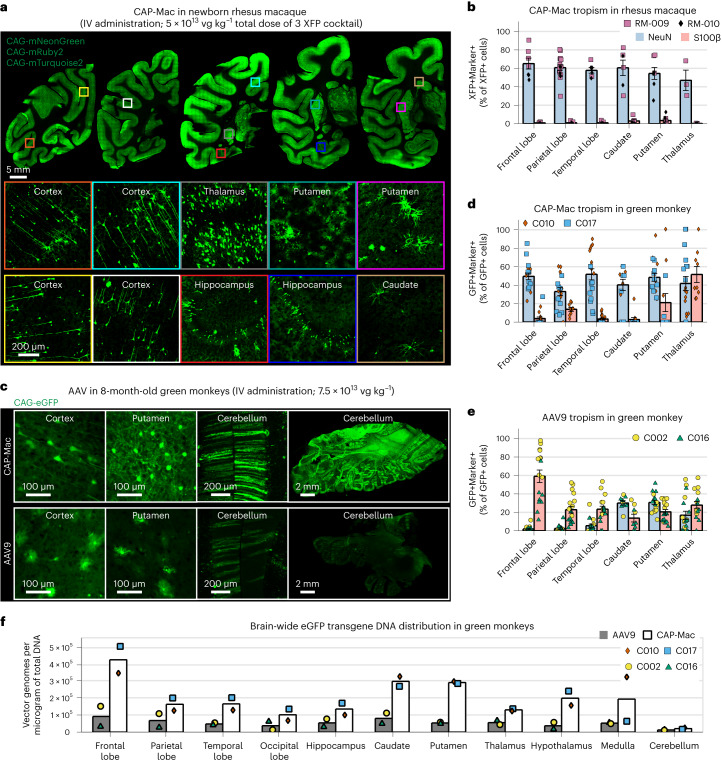
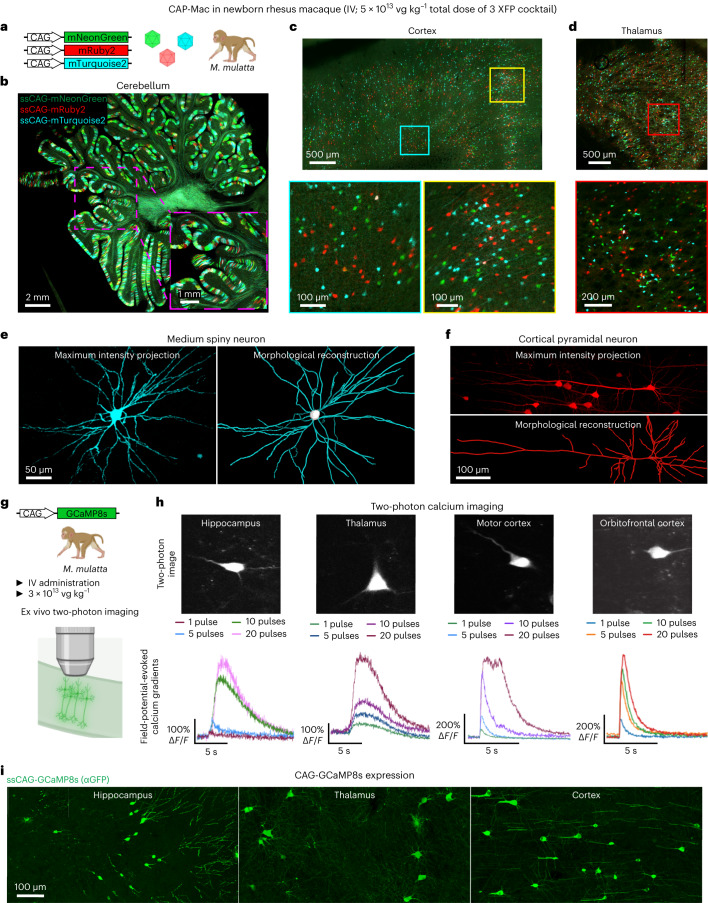
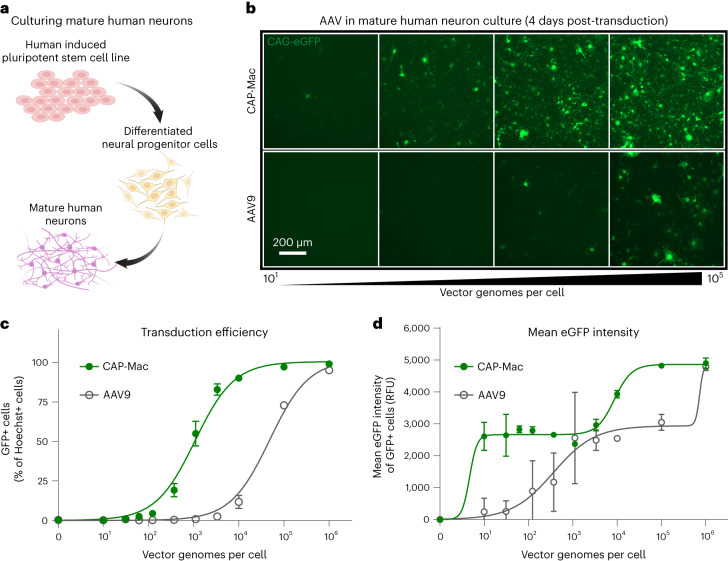
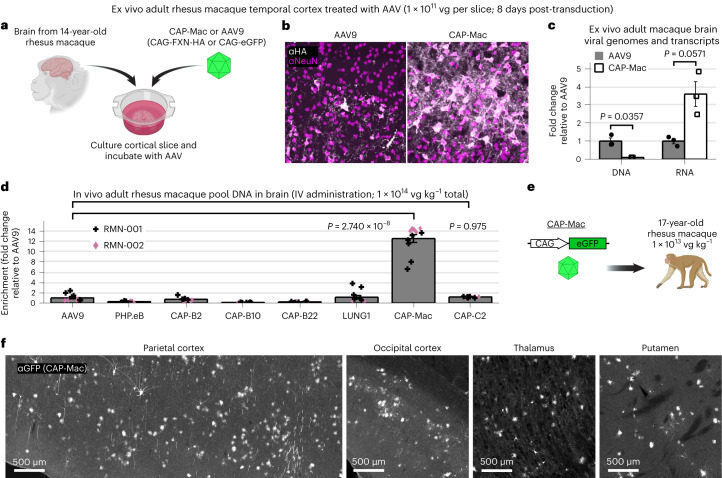
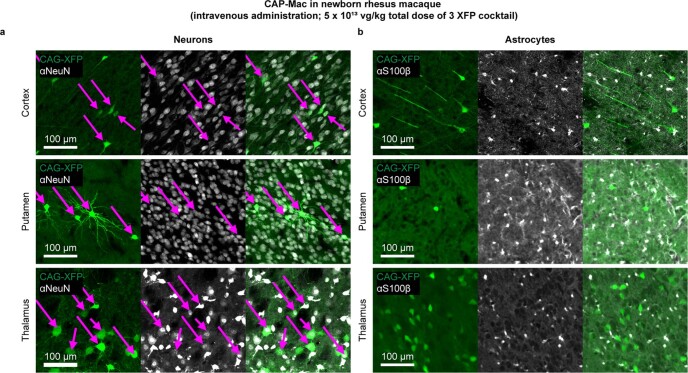
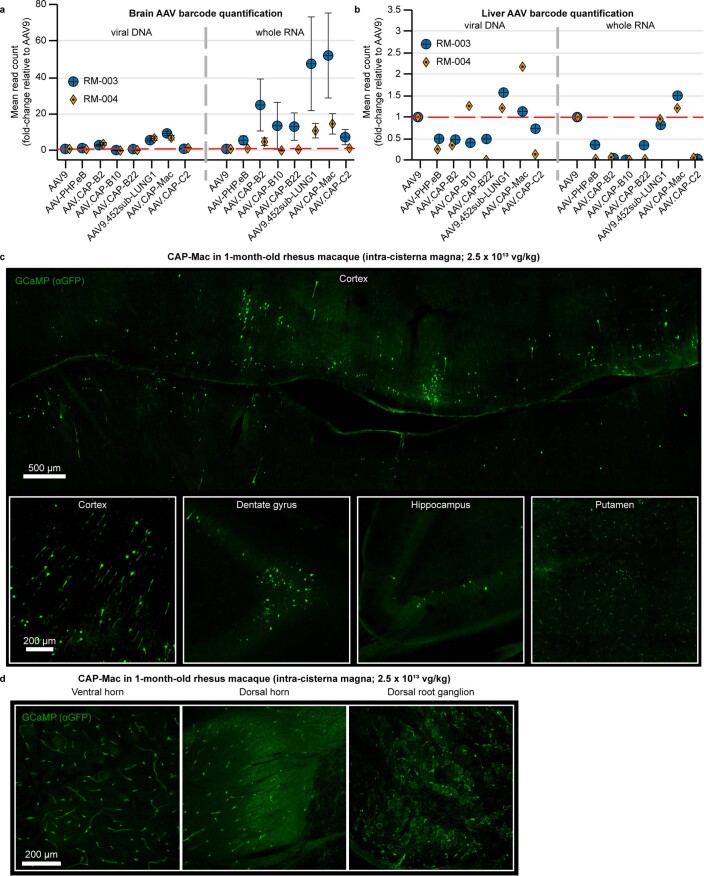
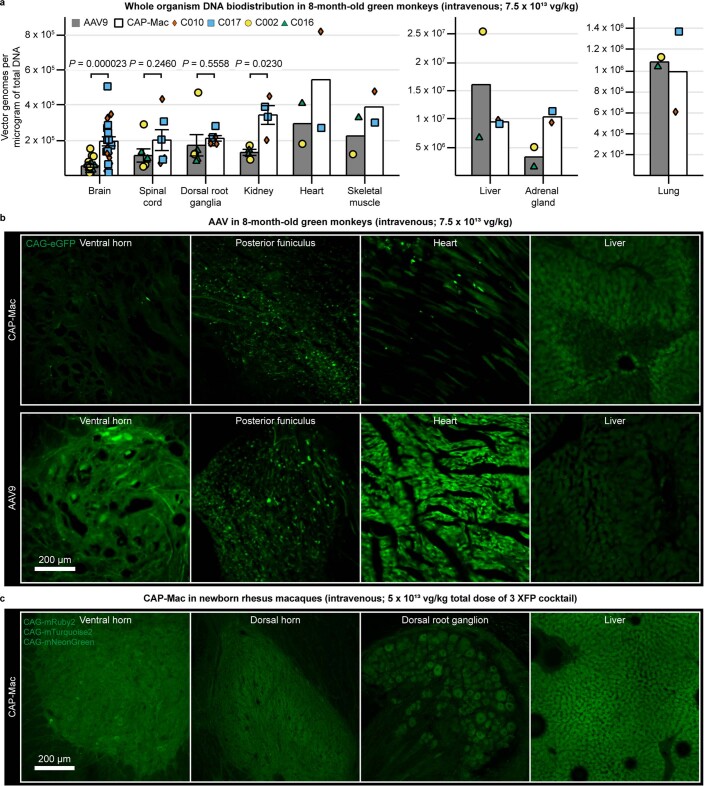
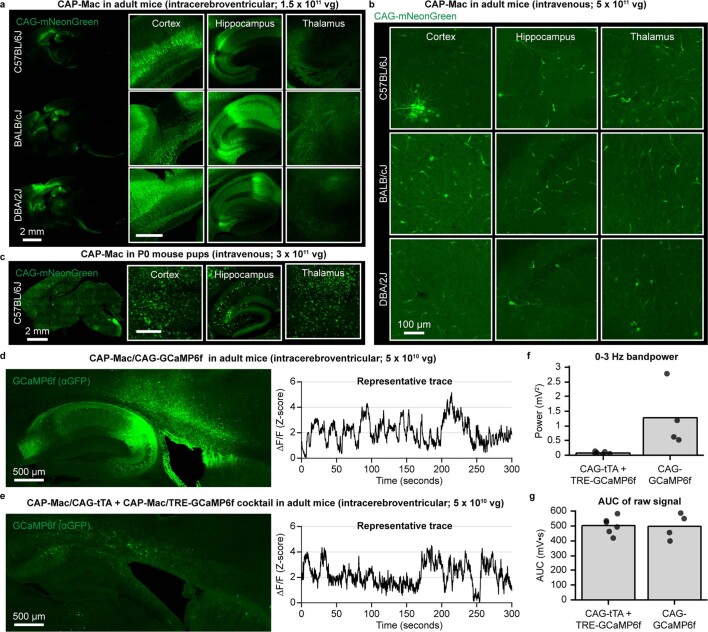
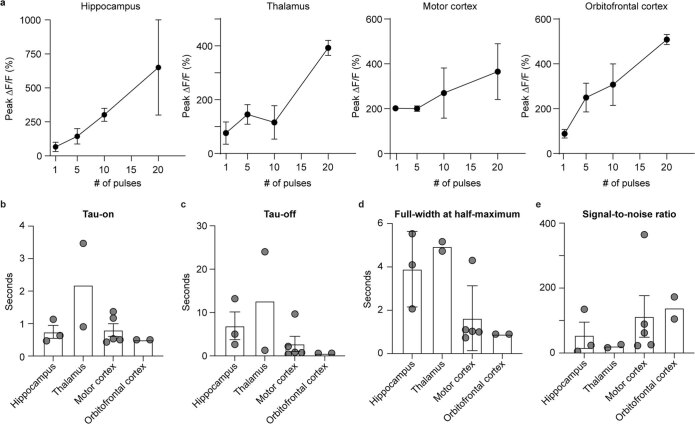
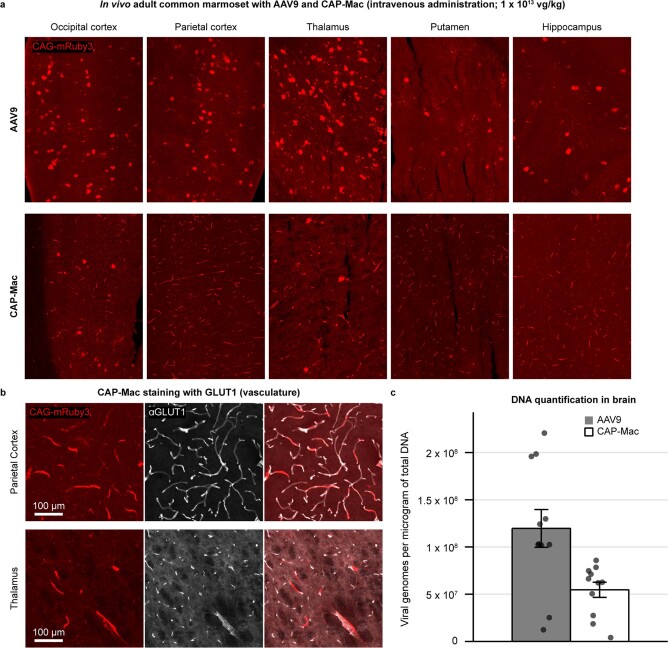
Crossing the blood-brain barrier in primates is a major obstacle for gene delivery to the brain. Adeno-associated viruses (AAVs) promise robust, non-invasive gene delivery from the bloodstream to the brain. However, unlike in rodents, few neurotropic AAVs efficiently cross the blood-brain barrier in non-human primates. Here we report on AAV.CAP-Mac, an engineered variant identified by screening in adult marmosets and newborn macaques, which has improved delivery efficiency in the brains of multiple non-human primate species: marmoset, rhesus macaque and green monkey. CAP-Mac is neuron biased in infant Old World primates, exhibits broad tropism in adult rhesus macaques and is vasculature biased in adult marmosets. We demonstrate applications of a single, intravenous dose of CAP-Mac to deliver functional GCaMP for ex vivo calcium imaging across multiple brain areas, or a cocktail of fluorescent reporters for Brainbow-like labelling throughout the macaque brain, circumventing the need for germline manipulations in Old World primates. As such, CAP-Mac is shown to have potential for non-invasive systemic gene transfer in the brains of non-human primates.


Conflict of interest statement

The California Institute of Technology has filed and licensed patent applications for the work described in this manuscript, with N.C.F., N.G. and V.G. listed as inventors (US patent application no. PCT/US21/46904). V.G. is a co-founder and board member and N.C.F. and N.G. are co-founders and officers of Capsida Biotherapeutics, a fully integrated AAV engineering and gene therapy company. A license for US patent application no. PCT/US21/46904 has been issued to Capsida Biotherapeutics. B.D. is a scientific founder and scientific advisor of Apertura Gene Therapy and is on the scientific advisory board of Tevard Biosciences. B.P.L. is on the scientific advisory board of Patch Biosciences. The remaining authors declare no competing interests.

Figures

Fig. 1
Fig. 1. CAP-Mac selection and characterization strategy.
a, AAV.CAP-Mac is a novel vector that enables brain-wide, systemic gene transfer in NHPs. Representative images are shown from a newborn rhesus macaque brain expressing three fluorescent reporters delivered intravenously using AAV.CAP-Mac (total dose 5 × 1013 vg, 4 weeks post-injection). b, Schematic of the CAP-Mac selection strategy. (1) CAP-Mac is an AAV9 variant that we selected from a library screened in the adult common marmoset. We generated diversity by introducing 7 NNK degenerate codons after Q588 in the AAV9 cap genome and produced the capsid library for in vivo selections in adult male marmosets. (2) In two rounds of selections, we intravenously administered 2 × 1012 vg per marmoset (two marmosets per round), narrowing our variant pool with each round of selection. After the first round of selection, we recovered 33,314 unique amino acid sequences in the brain. For the second round of selection, we generated a synthetic oligo pool containing each unique variant plus a codon-modified replicate (66,628 total sequences). After the second round of selection, we constructed network graphs of high-performing variants, and selected two capsids—AAV.CAP-Mac and AAV.CAP-C2—to be included in the pool selections in newborn rhesus macaques. (3) For pool selections, we produced eight capsids packaging ssCAG-hFXN-HA, each with a unique molecular barcode in the 3′ UTR. This construct design enabled us to assess the protein expression of the pool by staining for the HA epitope and quantify the barcodes in viral DNA and whole RNA extracts. We injected 1 × 1014 vg kg1 of the virus pool into two newborn rhesus macaques via the saphenous vein and recovered tissue 4 weeks post-injection. (4) We moved forward with the individual characterization of AAV.CAP-Mac in various contexts (ex vivo, in vitro and in vivo) in multiple primate species.
Fig. 2
Fig. 2. CAP-Mac outperforms other engineered variants in newborn rhesus macaque in pool testing.
a, Representative images of the expression in cortex, thalamus, caudate nucleus, putamen, hippocampus and claustrum after IV administration of 1 × 1014 vg kg1 of an eight-capsid pool (1.25 × 1013 vg kg1 of each variant) packaging HA-tagged human frataxin with a unique barcode in each capsid. HA epitope expression in the cortex and hippocampus is observable in single cells with clear projections that resemble the apical dendrites of pyramidal cells. Furthermore, the thalamus and dorsal striatum contain areas of dense HA expression relative to other brain regions. The white dashed line signifies the difference between ‘viral DNA’ and ‘whole RNA’ sections of the plot. b,c, Unique barcode enrichments in viral DNA (left) and whole RNA (right) extracts from the brain (b; n = 6 brain samples from two newborn macaques) and the liver (c; n = 2 liver tissue samples from two newborn macaques). Each data point represents the fold change relative to AAV9 within each tissue sample. Mean values ± standard error of the mean (s.e.m.) are shown. The red dashed line denotes AAV9 performance in the pool. One-way analysis of variance using Tamhane’s T2 correction was tested against AAV9 enrichment. Source data
Fig. 3
Fig. 3. CAP-Mac is biased towards neurons throughout infant green monkey and newborn rhesus macaque brains.
a, Distribution of IV CAP-Mac expression in 2-day-old rhesus macaques (5 × 1013 vg kg1 via the saphenous vein) across coronal slices showing fluorescent reporter expression (ssCAG-mNeonGreen, ssCAG-mRuby2 and ssCAG-mTurquoise2) in the cortical and subcortical brain regions (insets). Imaging channels of reporters are identically pseudo-coloured. b, Co-localization of fluorescent reporters with NeuN (neurons) or S100β (astrocytes) in 2-day-old rhesus macaques treated with CAP-Mac (n = 2 macaques). Values are reported as a percentage of all the XFP+ cells. Mean [XFP+NeuN+]/XFP+ range between 47% and 60% and mean [XFP + S100β+]/XFP+ between 0% and 3%. Overall, CAP-Mac targeted 1.12% and 0.04% of all NeuN+ and S100β+ cells, respectively. c, Representative images from 8-month-old green monkeys intravenously dosed with CAP-Mac (top) or AAV9 (bottom) packaging ssCAG-eGFP (7.5 × 1013 vg kg1 via the saphenous vein). d,e, Co-localization of fluorescent reporters with NeuN (neurons) or S100β (astrocytes) in infant green monkeys treated with CAP-Mac (d; n = 2 green monkeys) or AAV9 (e; n = 2 green monkeys). Values are reported as a percentage of all the GFP+ cells. CAP-Mac, mean [GFP+NeuN+]/GFP+ between 33% and 51% and mean [GFP+S100β+]/GFP+ between 3% and 21%. AAV9, mean [GFP+NeuN+]/GFP+ between 2% and 10% and mean [GFP+S100β+]/GFP+ between 23% and 59%. Overall, CAP-Mac targeted 1.30% and 0.64% of NeuN+ and S100β+ cells, respectively, in the green monkey brain. In contrast, AAV9 targeted 0.49% of NeuN+ cells and 1.86% of S100β+ cells. f, Distribution of CAP-Mac- and AAV9-delivered eGFP transgene in 11 brain regions of green monkeys (n = 4 green monkeys). Each data point represents the measured vector genomes per microgram of total DNA in a section of tissue from each region and monkey. Mean values ± s.e.m. are shown. Source data
Fig. 4
Fig. 4. Experimental utility of CAP-Mac for interrogation of the newborn rhesus macaque brain.
af, CAP-Mac packaging three fluorescent reporters (a) to generate Brainbow-like labelling in rhesus macaque cerebellum (b), cortex (c) and thalamus (lateral geniculate nucleus) (d), enabling morphological reconstruction of neurons (e and f). gi, Non-invasive delivery of ssCAG-GCaMP8s using CAP-Mac (g) for ex vivo two-photon imaging (h) and brain-wide GCaMP expression (i).
Fig. 5
Fig. 5. CAP-Mac is more potent in human cultured neurons compared with AAV9.
a, Differentiation process starting with an iPSC line that was differentiated into neural progenitor cells, which were further differentiated into mature neurons. b, Representative images of cultured human neurons after 4 days of incubation with either CAP-Mac (top) or AAV9 (bottom) packaging ssCAG-eGFP across four doses of AAV, ranging from 101 to 105 vg per cell. c,d, Dose response curves of AAV9 (n = 3 biologically independent replicates) and CAP-Mac (n = 3 biologically independent replicates) in mature human neuron cultures measuring the transduction efficiency (c) and mean eGFP intensity (d). Mean values ± s.e.m. are shown. Source data
Fig. 6
Fig. 6. Characterization in adult rhesus macaque.
a, AAV in ex vivo cortical slice taken from a 14-year-old rhesus macaque. b, CAP-Mac is more efficient at transducing neurons in the grey matter of the cortex. c, Quantification demonstrates that CAP-Mac-delivered transgene produces more RNA but not DNA compared with AAV9-delivered transgene; n = 3 brain slices; two-tailed Welch’s t-test. df, AAV in adult rhesus macaques in vivo. d, Recovered DNA from adult macaque administered with an eight-capsid pool (7.5 × 1013 vg kg1). Here n = 12 brain samples from two adult macaques. One-way analysis of variance using Tamhane’s T2 correction was tested against AAV9 enrichment. e, We intravenously injected 1 × 1013 vg of CAP-Mac packaging CAG-eGFP into a 17-year-old rhesus macaque via the saphenous vein to assess CAP-Mac protein expression in the adult macaque. f, CAP-Mac-mediated eGFP expression visualized after amplification with GFP antibody. Mean values ± s.e.m. are shown. Source data
Extended Data Fig. 1
Extended Data Fig. 1. CAG-XFP co-localization with cell-type-specific histological markers.
a, b, Representative images of a cocktail of 3 fluorescent proteins under control of CAG in newborn rhesus macaque tissue with histological markers for neurons (NeuN, a) and astrocytes (S100β, b). Cells that are positive for both fluorescent protein and histological marker are shown with a purple arrow. Fluorescent proteins are identically pseudo-coloured.
Extended Data Fig. 2
Extended Data Fig. 2. Administering AAV via intra-cisterna magna administration.
a, b, Barcode quantification in viral DNA and whole RNA from brain (a) and liver (b) of neonate rhesus macaques (n = 2 macaques) treated with a capsid pool via intra-cisterna magna administration. Mean ± s.e.m. shown. c, d, CAG-GCaMP7s expression in brain (c) and spinal cord (d) after intra-cisterna magna administration using AAV.CAP-Mac. Source data
Extended Data Fig. 3
Extended Data Fig. 3. CAG-XFP expression in non-brain tissue of Old World primates treated with AAV.
a, Vector genomes per microgram of total DNA in green monkeys treated with AAV9 (n = 2 green monkeys) or CAP-Mac (n = 2 green monkeys), expressed as fold-change relative to mean AAV9. Each data point represents measured vector genomes per microgram of total DNA in a section of tissue from each region and monkey. Mean ± s.e.m. shown. Two-tailed Welch’s t-test. b, CAG-eGFP expression in the spinal cord, heart, and liver of green monkeys after intravenous expression of either CAP-Mac (top) or AAV9 (bottom). c, CAG-XFP expression in the spinal cord, dorsal root ganglia, and liver of newborn rhesus macaque after intravenous administration of CAP-Mac packaging a cocktail of 3 CAG-XFPs. XFPs are pseudocoloured identically. Source data
Extended Data Fig. 4
Extended Data Fig. 4. Tropism in mice and utilizing mice as a model organism for cargo validation.
a, CAP-Mac after intracerebroventricular (ICV) administration in adult mice primarily transduces neurons, mimicking the CAP-Mac tropism in infant Old World primates after intravenous (IV) administration. b, CAP-Mac after IV administration in C57BL/6 J, BALB/cJ, and DBA/2 J adult mice primarily transduces vasculature, with no apparent differences between the three mouse strains. c, CAP-Mac in P0 C57BL/6 J pups after intravenous administration transduces various cell-types, including neurons, astrocytes, and vasculature. d-g, Given the neuronal tropism of CAP-Mac via ICV administration, we validated GCaMP cargo in mice prior to non-human primate experiments, testing either one-component or two-component systems. d, e, GCaMP protein expression and representative ΔF/F traces in mice after delivering CAG-GCaMP6f (n = 2 mice) (d) or a CAG-tTA/TRE-GCaMP6f cocktail (n = 3 mice) using CAP-Mac (e). f, g, To determine cargo to move forward with, we found that 0-3 Hz bandpower (two-tailed Welch’s t-test, P = 0.105) (f), but not area under the curve (AUC; two-tailed Welch’s t-test, P = 0.626) (g), was indicative of cargo performance.
Extended Data Fig. 5
Extended Data Fig. 5. Group-level analyses of two-photon calcium imaging in rhesus macaque slice.
a, Mean peak ΔF/F0 evoked by cells from hippocampus, thalamus, motor cortex, and orbitofrontal cortex after applying different numbers of pulses. b, Mean rise time of GCaMP8s responses in the four brain regions. Rise time is defined as time taken for the response to rise from 10% to 90% of the peak of the amplitude. c, Mean decay time constant of GCaMP8s responses in the four brain regions. Decay time constant was obtained by fitting sums of exponentials to the decay phase of the traces. d, Mean full width at half maximum (FWHM) of GCaMP8s responses in the four brain regions. e, Mean signal-to-noise ratio (SNR) of GCaMP8s responses in the four brain regions. SNR is defined as the peak amplitude divided by the standard deviation of the fluorescence signal before the electrical stimulation. Hippocampus: n = 3 cells. Thalamus: n = 2 cells. Motor cortex: n = 5 cells. Orbitofrontal cortex: n = 2 cells. Data is plotted as mean ± s.e.m.
Extended Data Fig. 6
Extended Data Fig. 6. CAP-Mac tropism in adult common marmoset compared to AAV9.
a, AAV9 and CAP-Mac tropism in two adult marmosets in vivo (3.8- and 5.8-years-old). b, CAP-Mac is biased primarily towards GLUT1+ cells (vasculature), consistent with our results in adult mice. c, Recovered viral genomes in adult marmoset brain (n = 2 marmosets). Mean ± s.e.m. shown. Two-tailed Welch’s t-test, P = 0.00981. Source data
Extended Data Fig. 7
Extended Data Fig. 7. Liver function tests in newborn rhesus macaques treated with AAV.
a, b, Liver function tests show no abnormal signs of adverse liver functionality, as measured by alanine transaminase (ALT; a) and aspartate transaminase (AST; b) activity. Source data

Update of

References

    1. Rose JA, Berns KI, Hoggan MD, Koczot FJ. Evidence for a single-stranded adenovirus-associated virus genome: formation of a DNA density hybrid on release of viral DNA. Proc. Natl Acad. Sci. USA. 1969;64:863–869. doi: 10.1073/pnas.64.3.863. - DOI - PMC - PubMed
    1. Atchison RW, Casto BC, Hammon WM. Adenovirus-associated defective virus particles. Science. 1965;149:754–756. doi: 10.1126/science.149.3685.754. - DOI - PubMed
    1. Hoggan MD, Blacklow NR, Rowe WP. Studies of small DNA viruses found in various adenovirus preparations: physical, biological, and immunological characteristics. Proc. Natl Acad. Sci. USA. 1966;55:1467–1474. doi: 10.1073/pnas.55.6.1467. - DOI - PMC - PubMed
    1. Wang D, Tai PWL, Gao G. Adeno-associated virus vector as a platform for gene therapy delivery. Nat. Rev. Drug Discov. 2019;18:358–378. doi: 10.1038/s41573-019-0012-9. - DOI - PMC - PubMed
    1. Zhu D, Schieferecke AJ, Lopez PA, Schaffer DV. Adeno-associated virus vector for central nervous system gene therapy. Trends Mol. Med. 2021;27:524–537. doi: 10.1016/j.molmed.2021.03.010. - DOI - PubMed

Publication types