. 2023 Jul;4(7):1016-1035.
doi: 10.1038/s43018-023-00591-2. Epub 2023 Jul 10.

ALK peptide vaccination restores the immunogenicity of ALK-rearranged non-small cell lung cancer

Affiliations

ALK peptide vaccination restores the immunogenicity of ALK-rearranged non-small cell lung cancer

Ines Mota et al. Nat Cancer. 2023 Jul.

Abstract

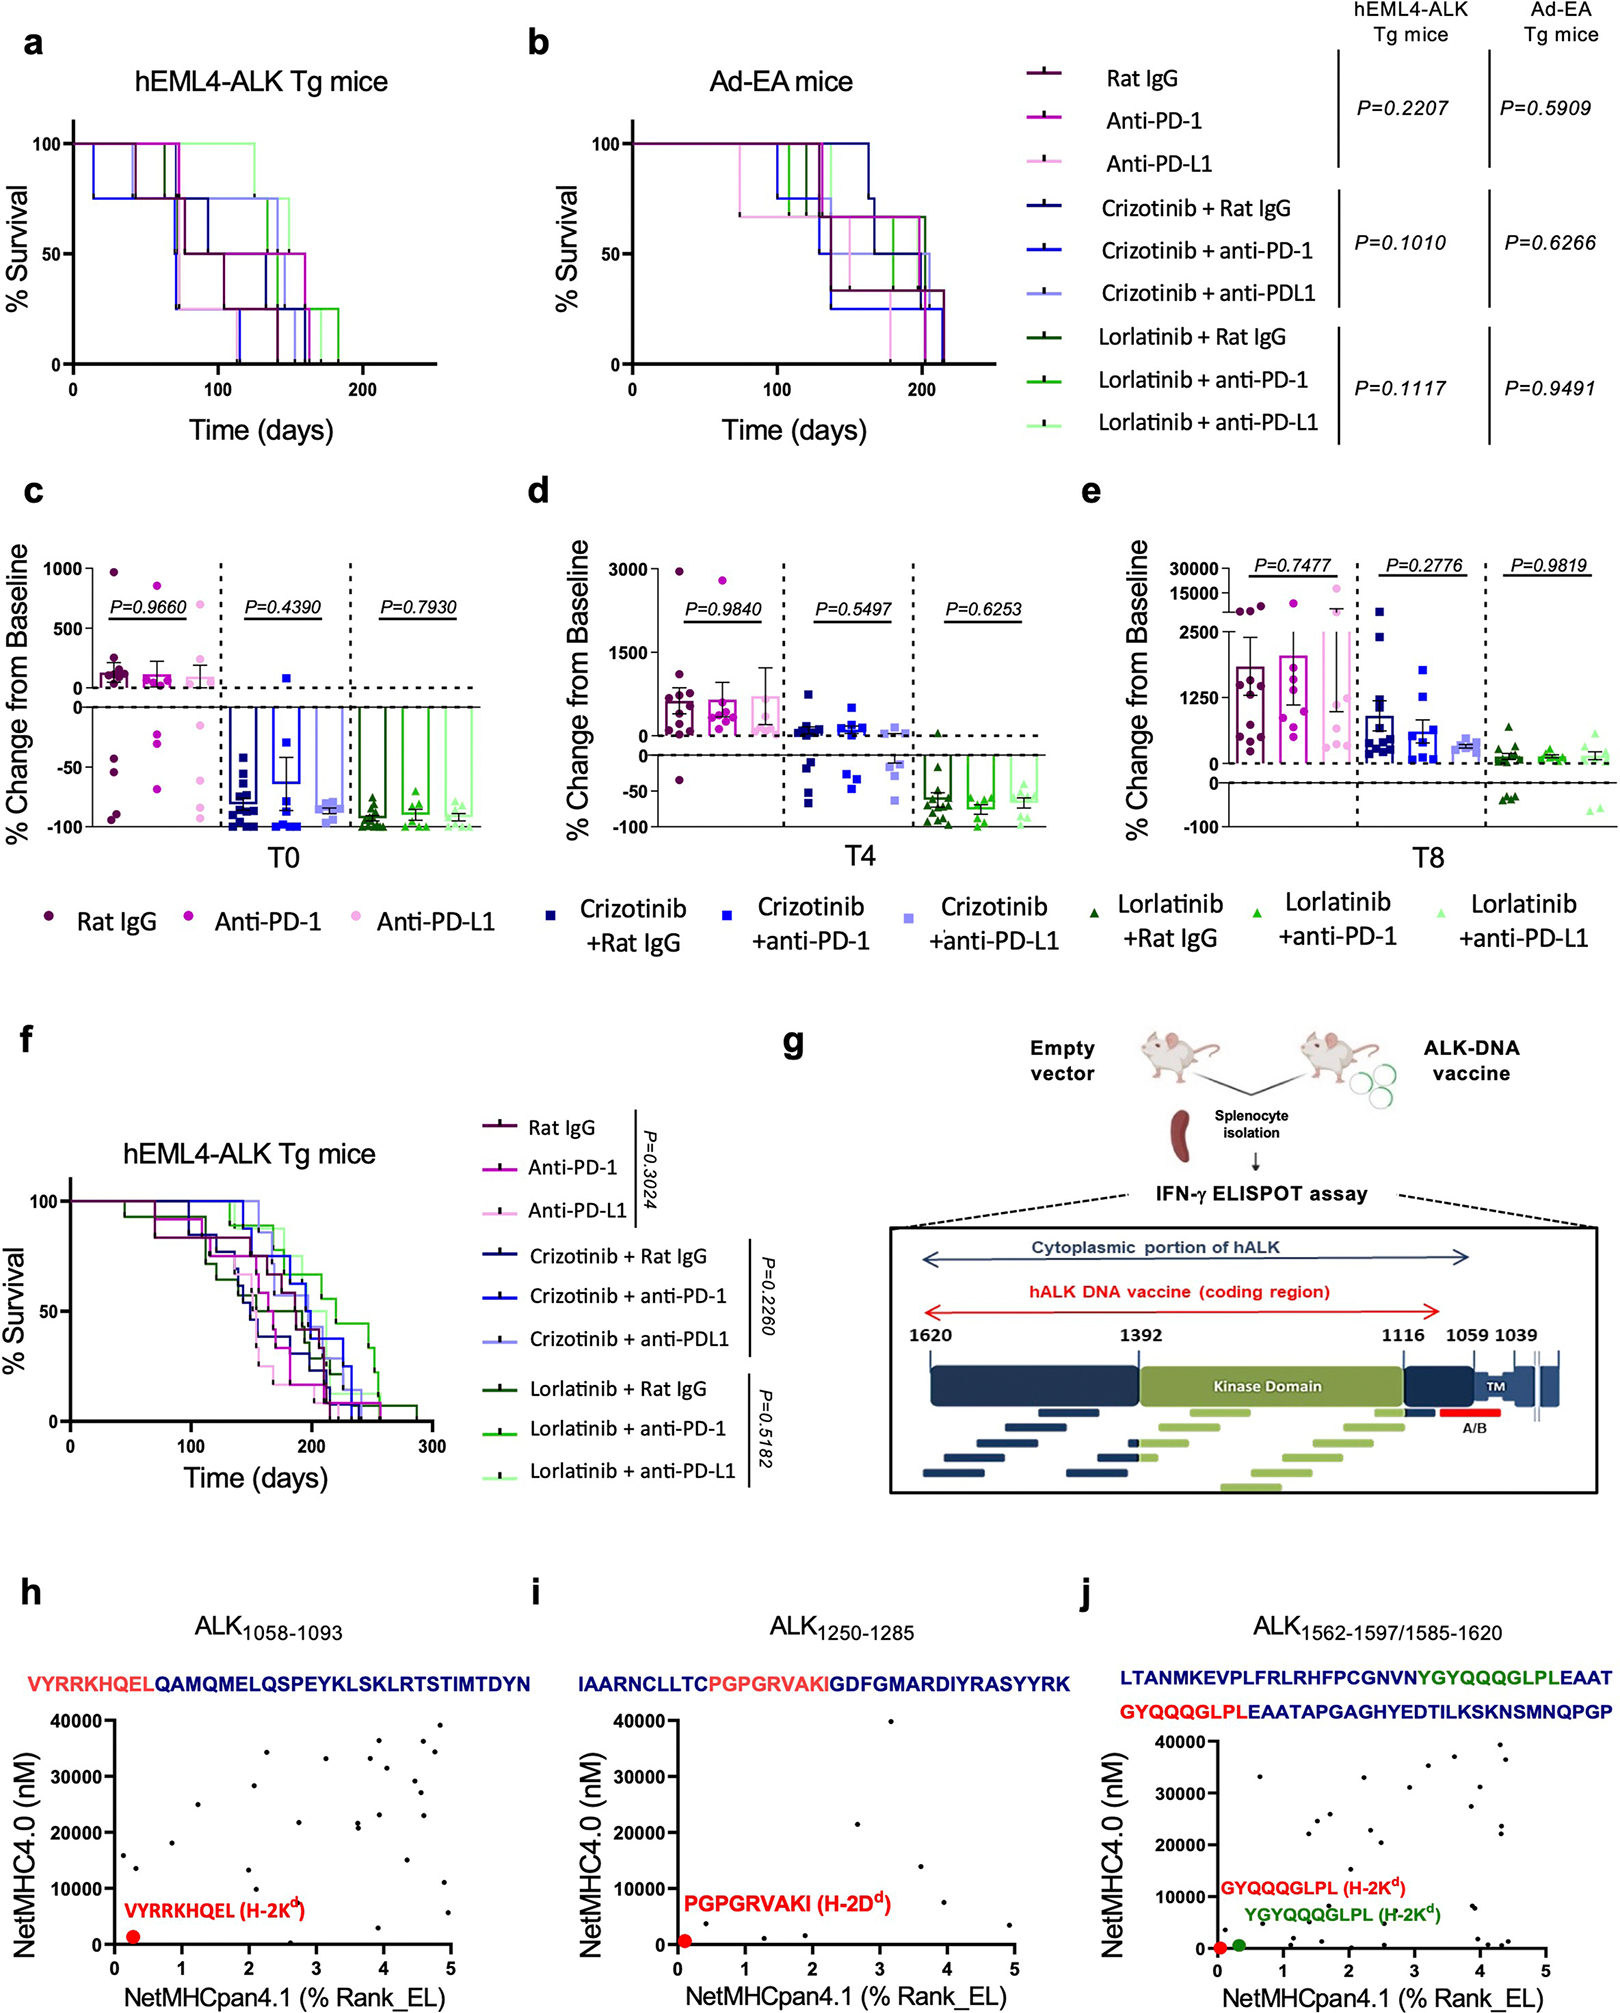
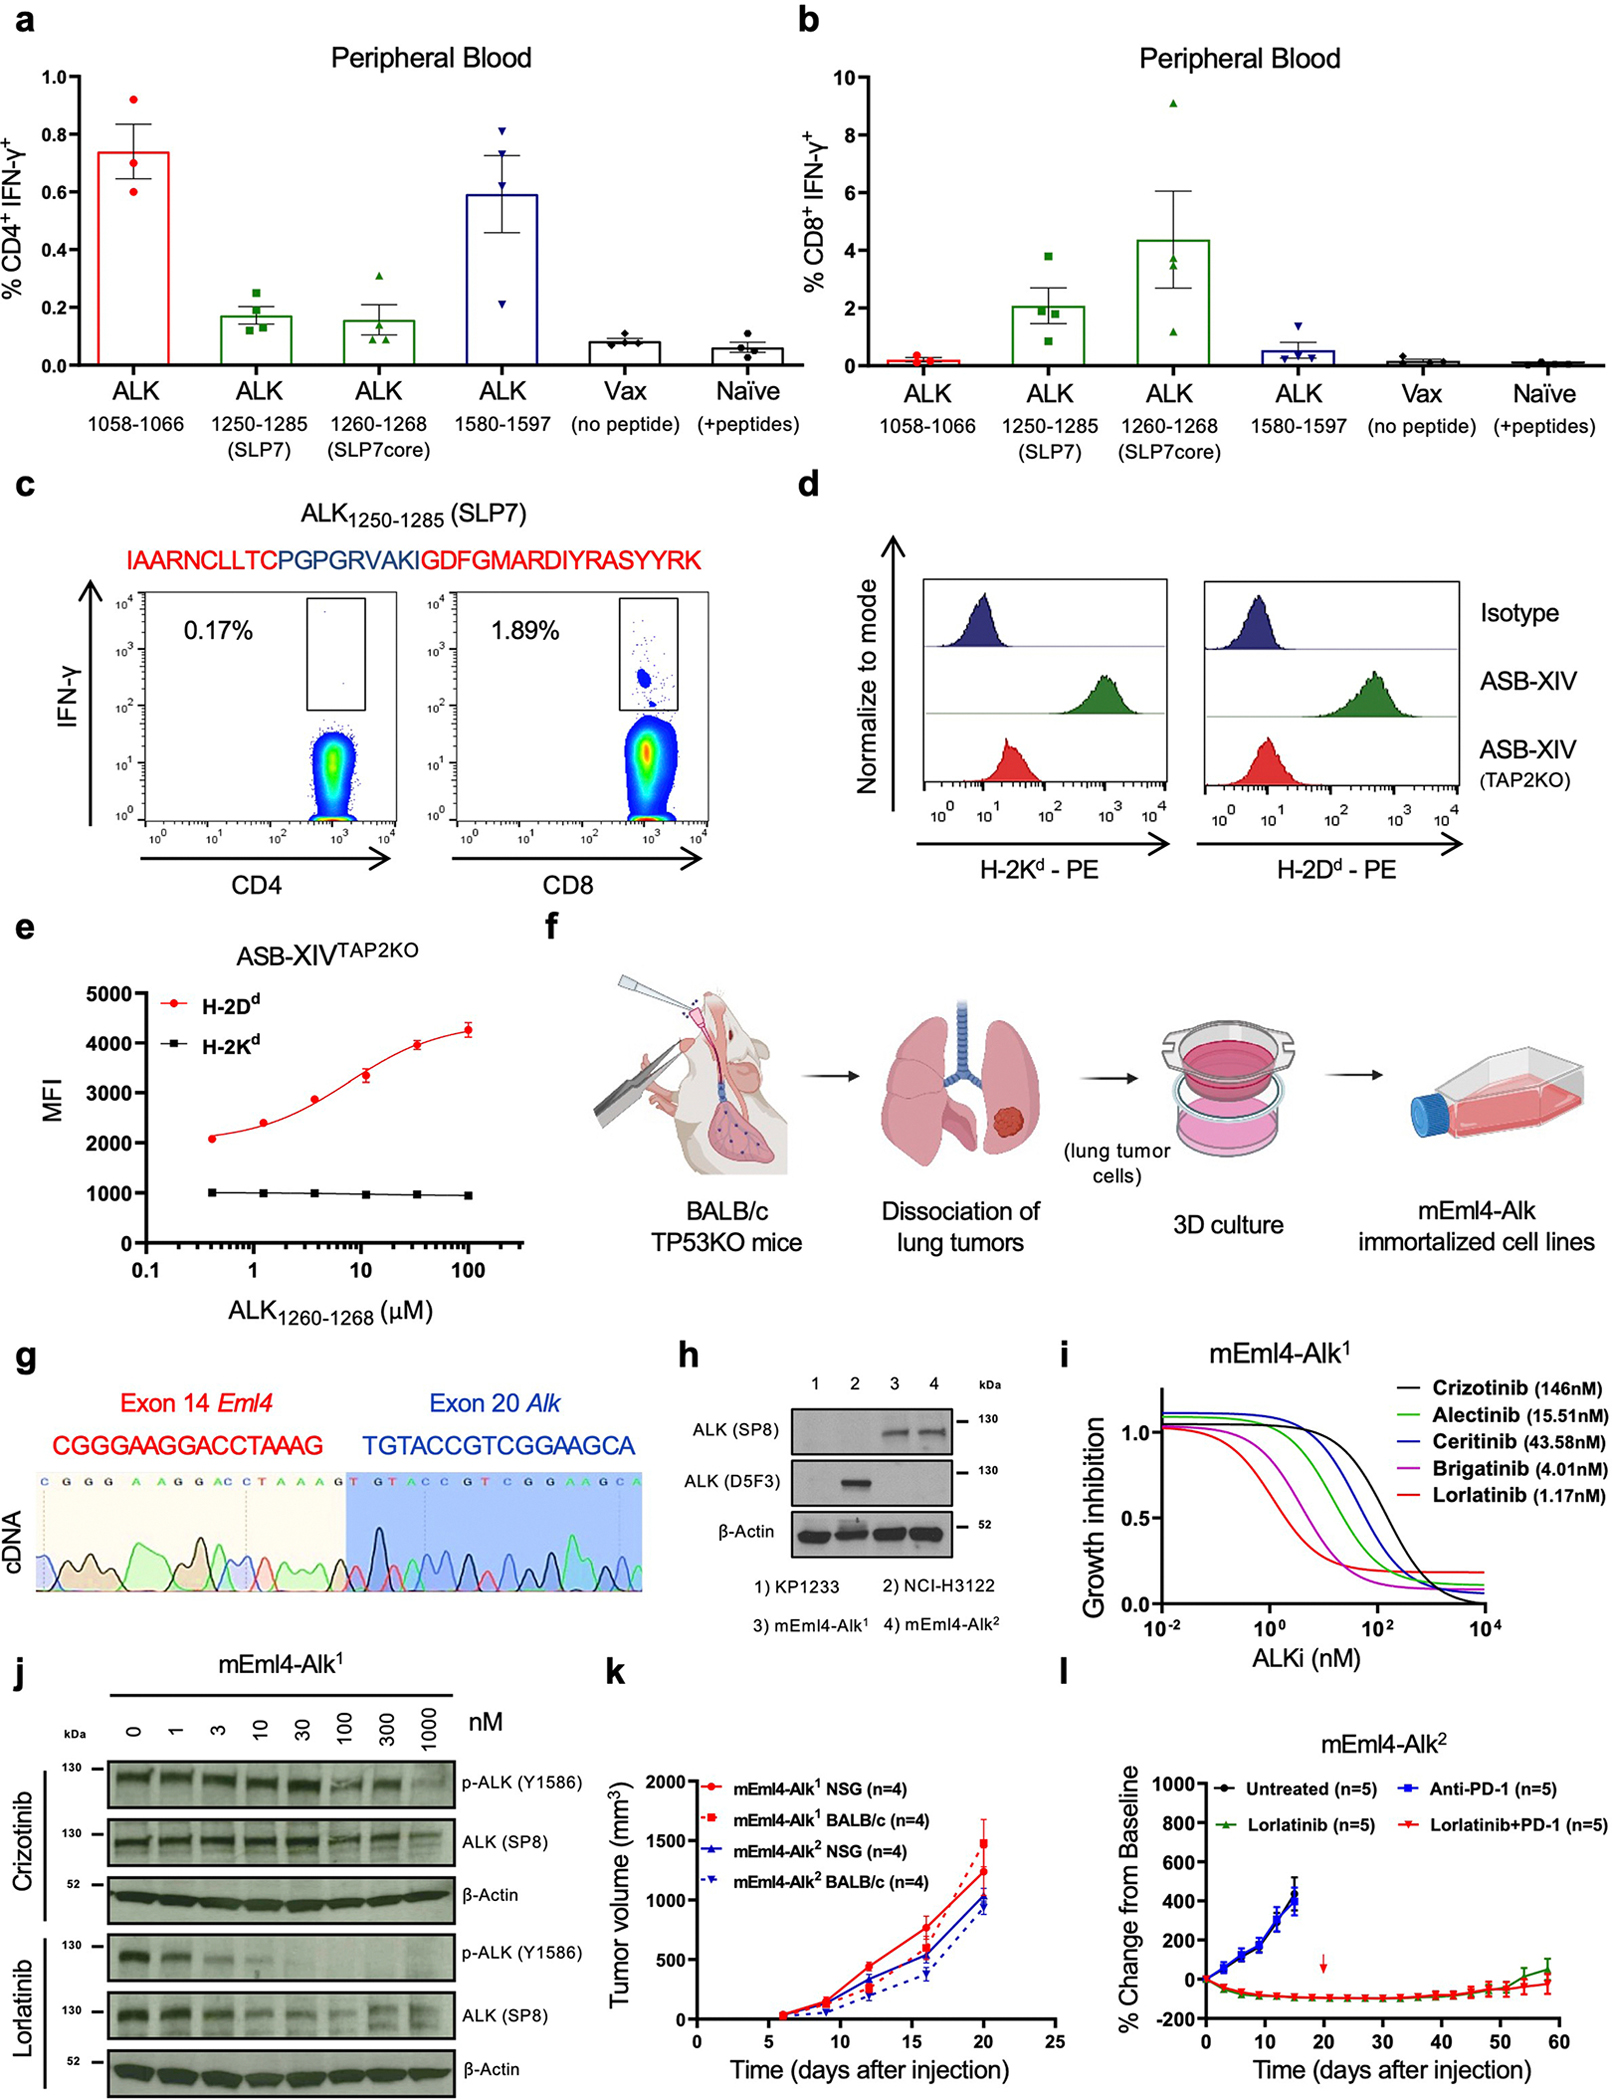
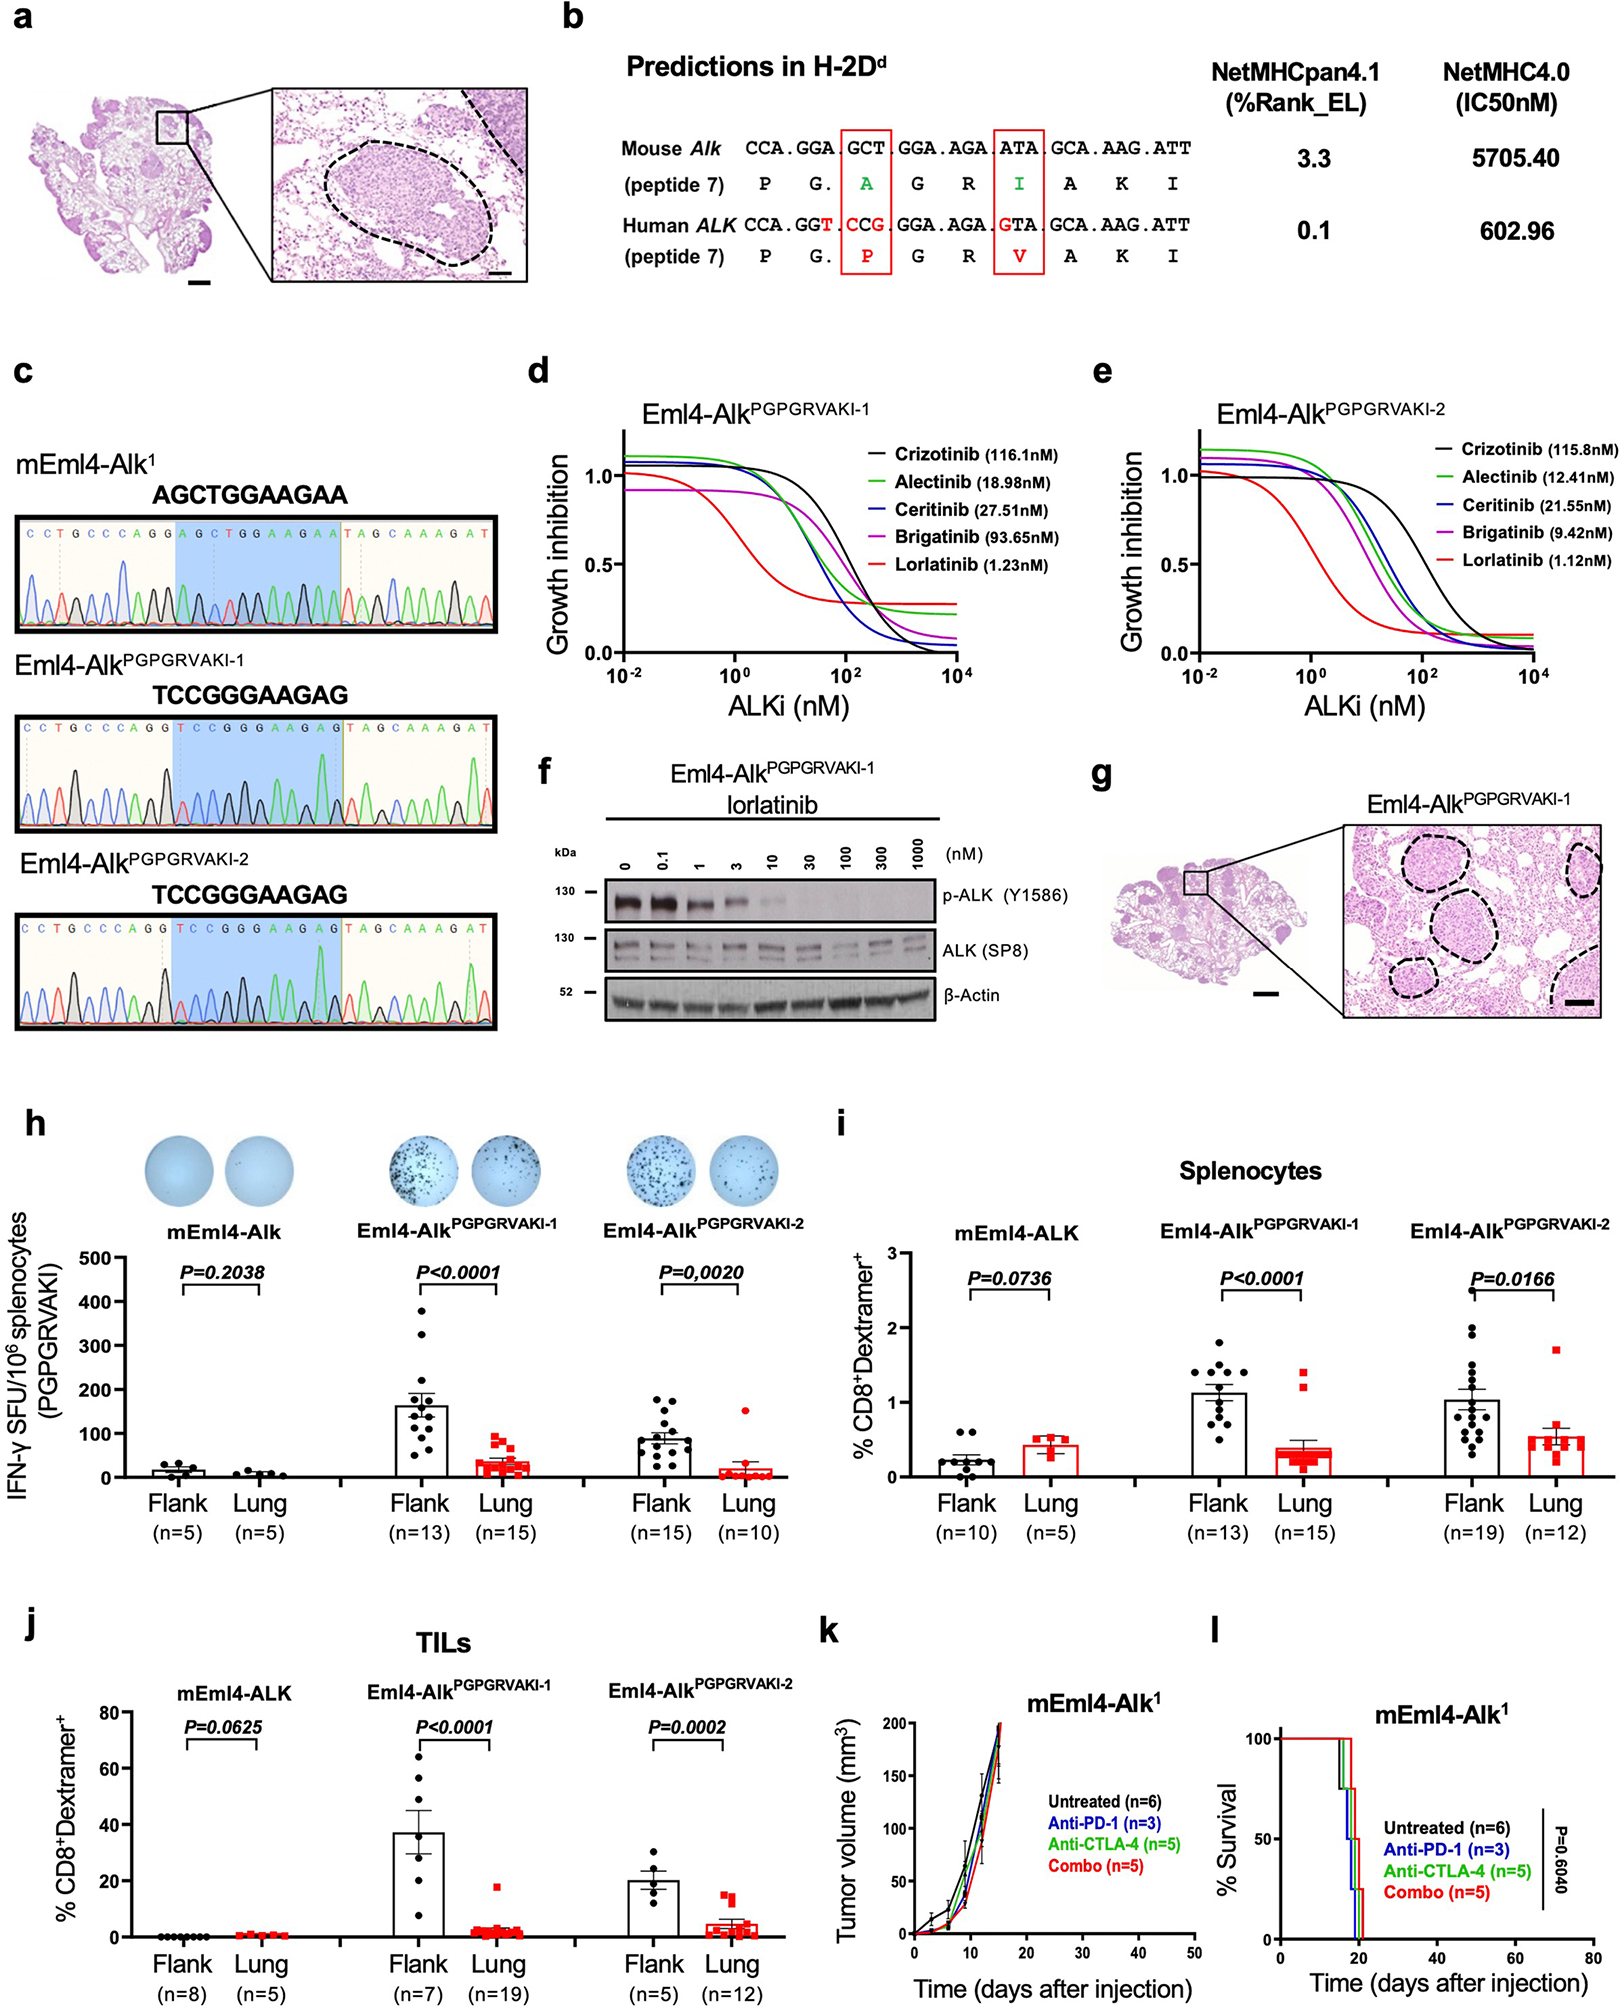
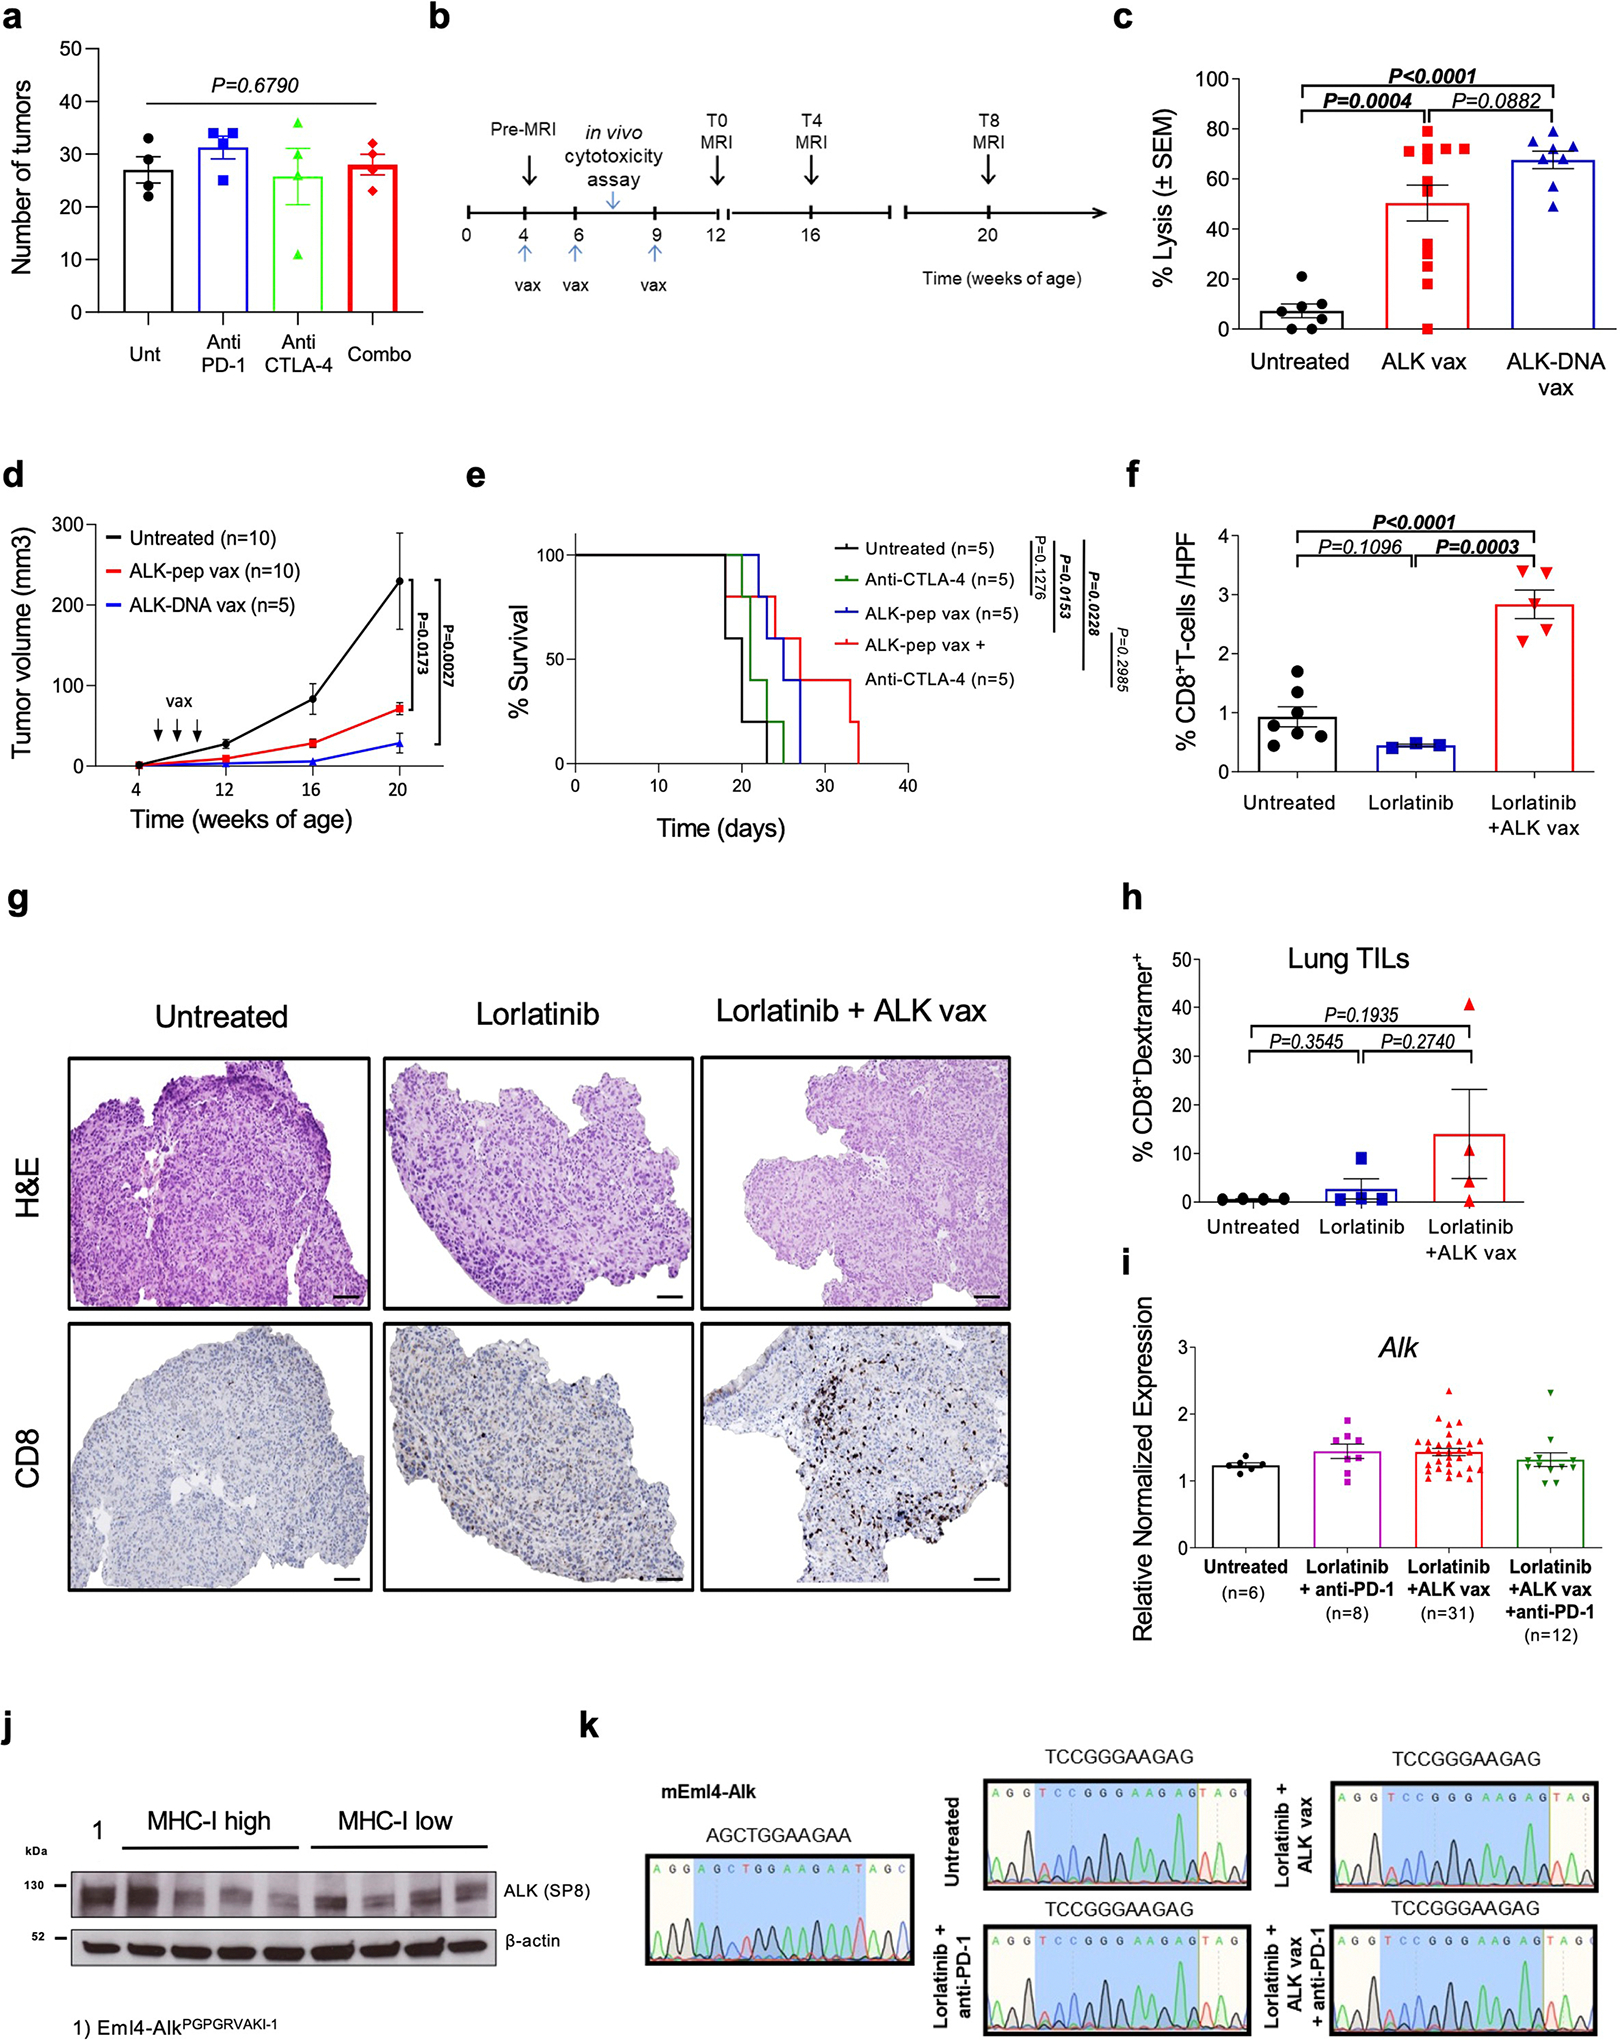
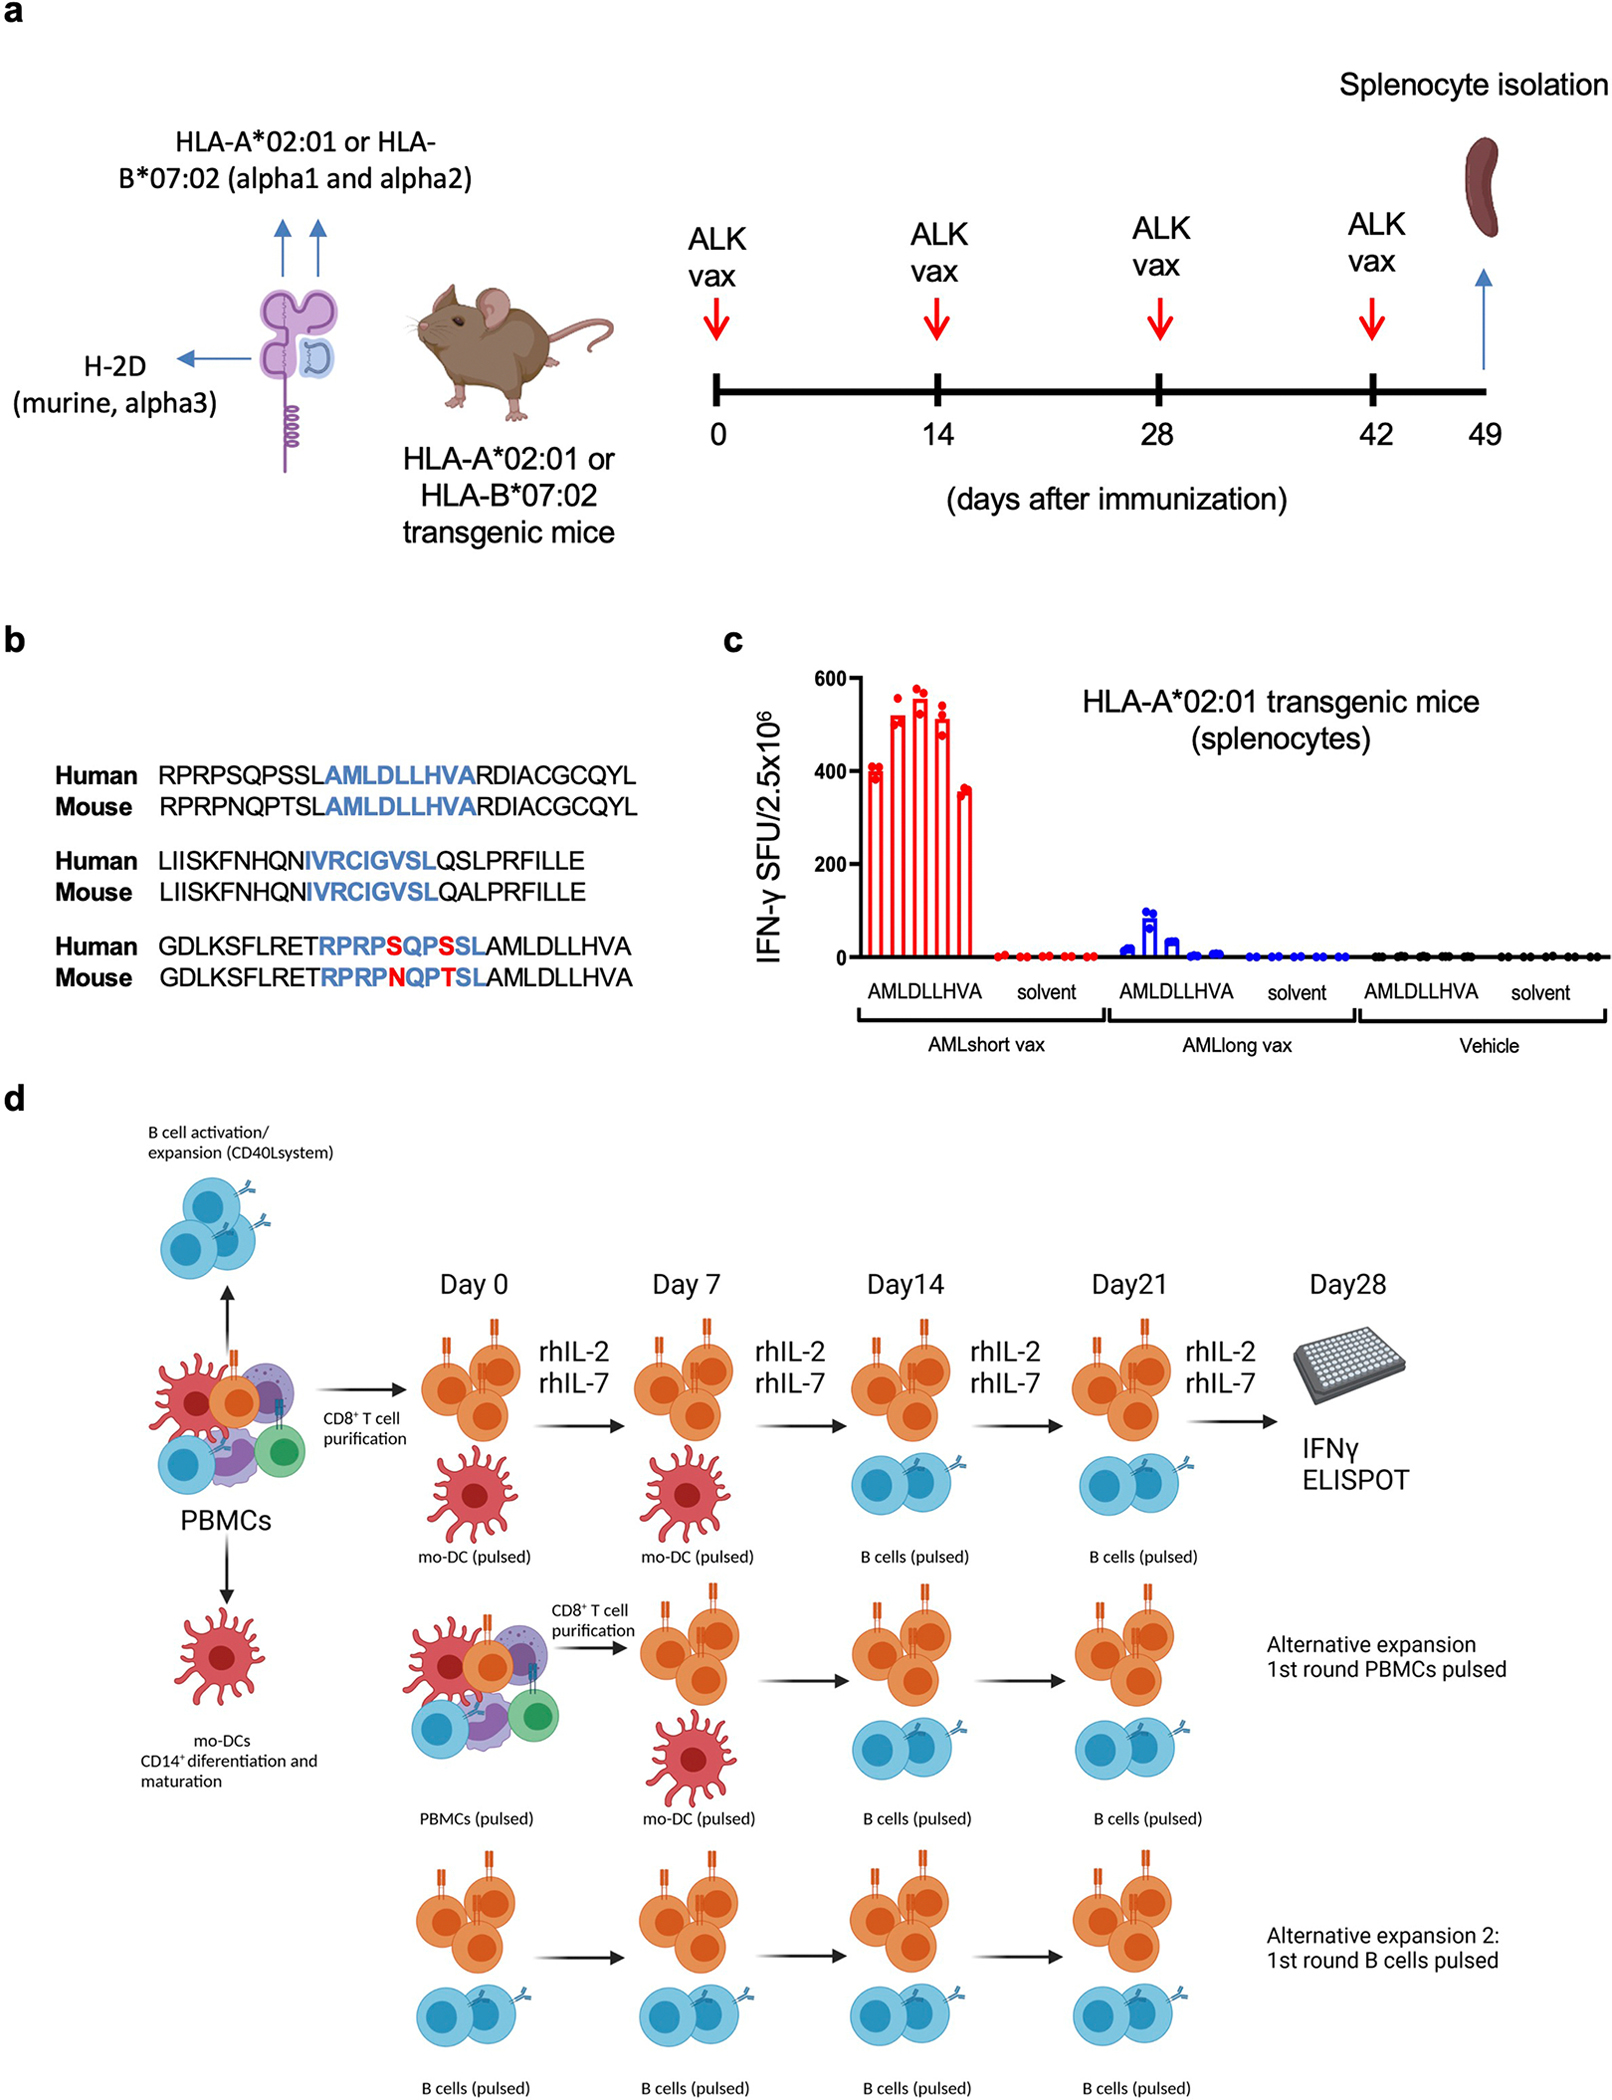
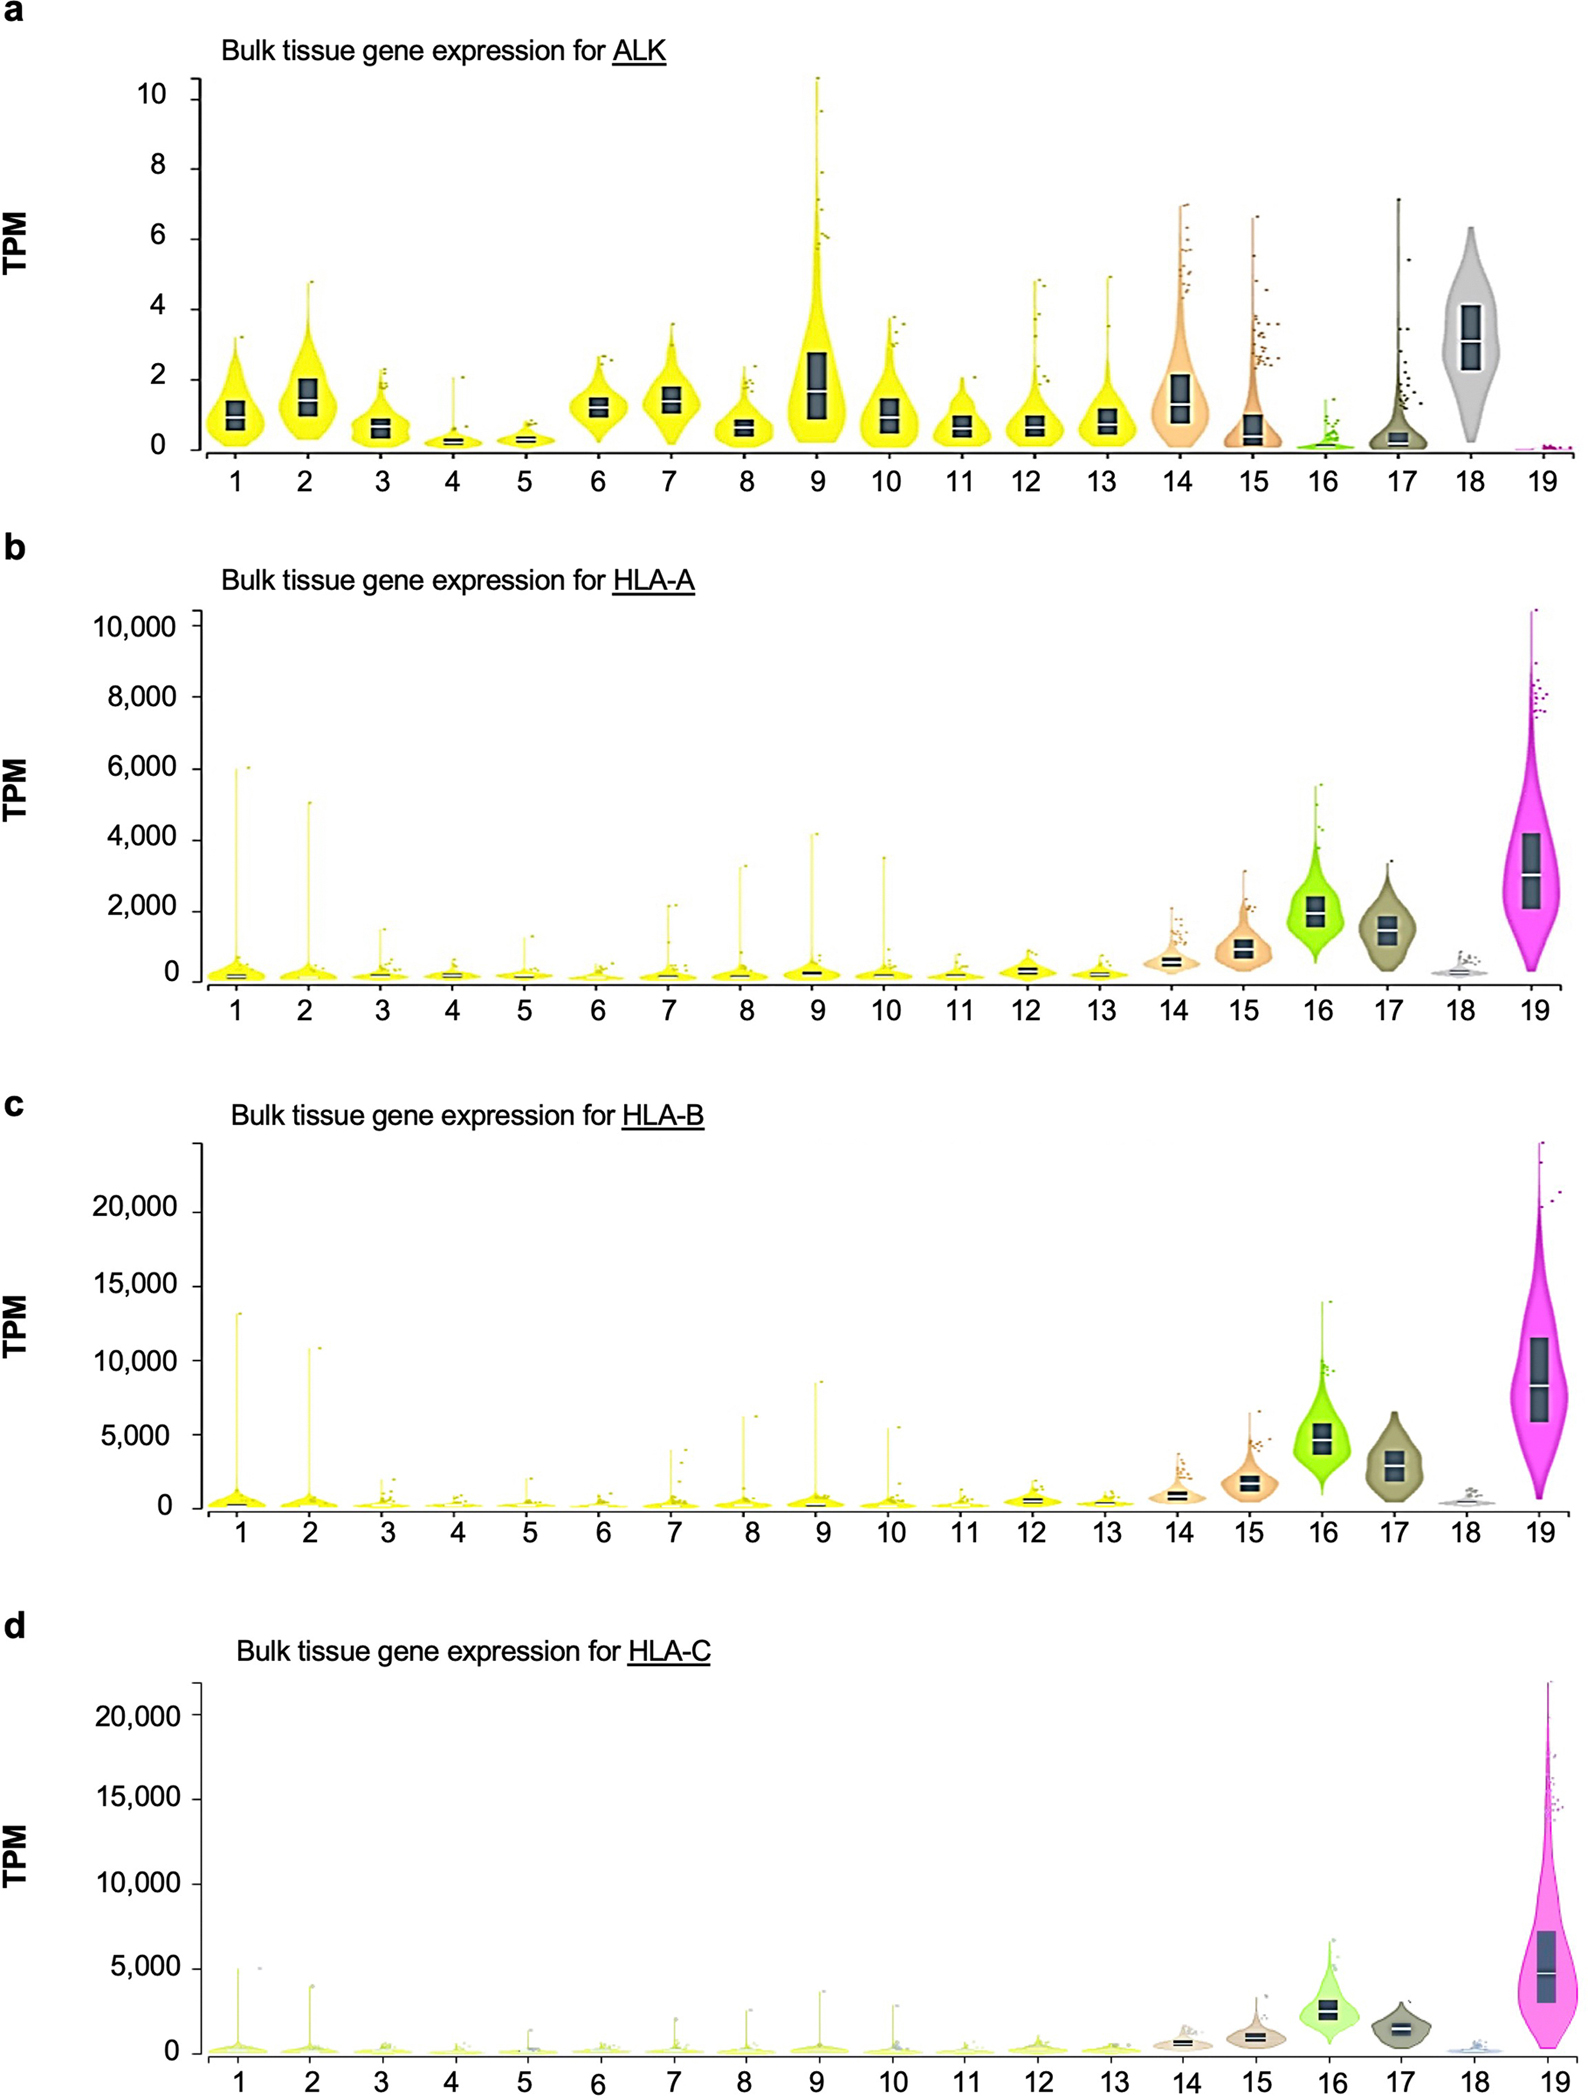
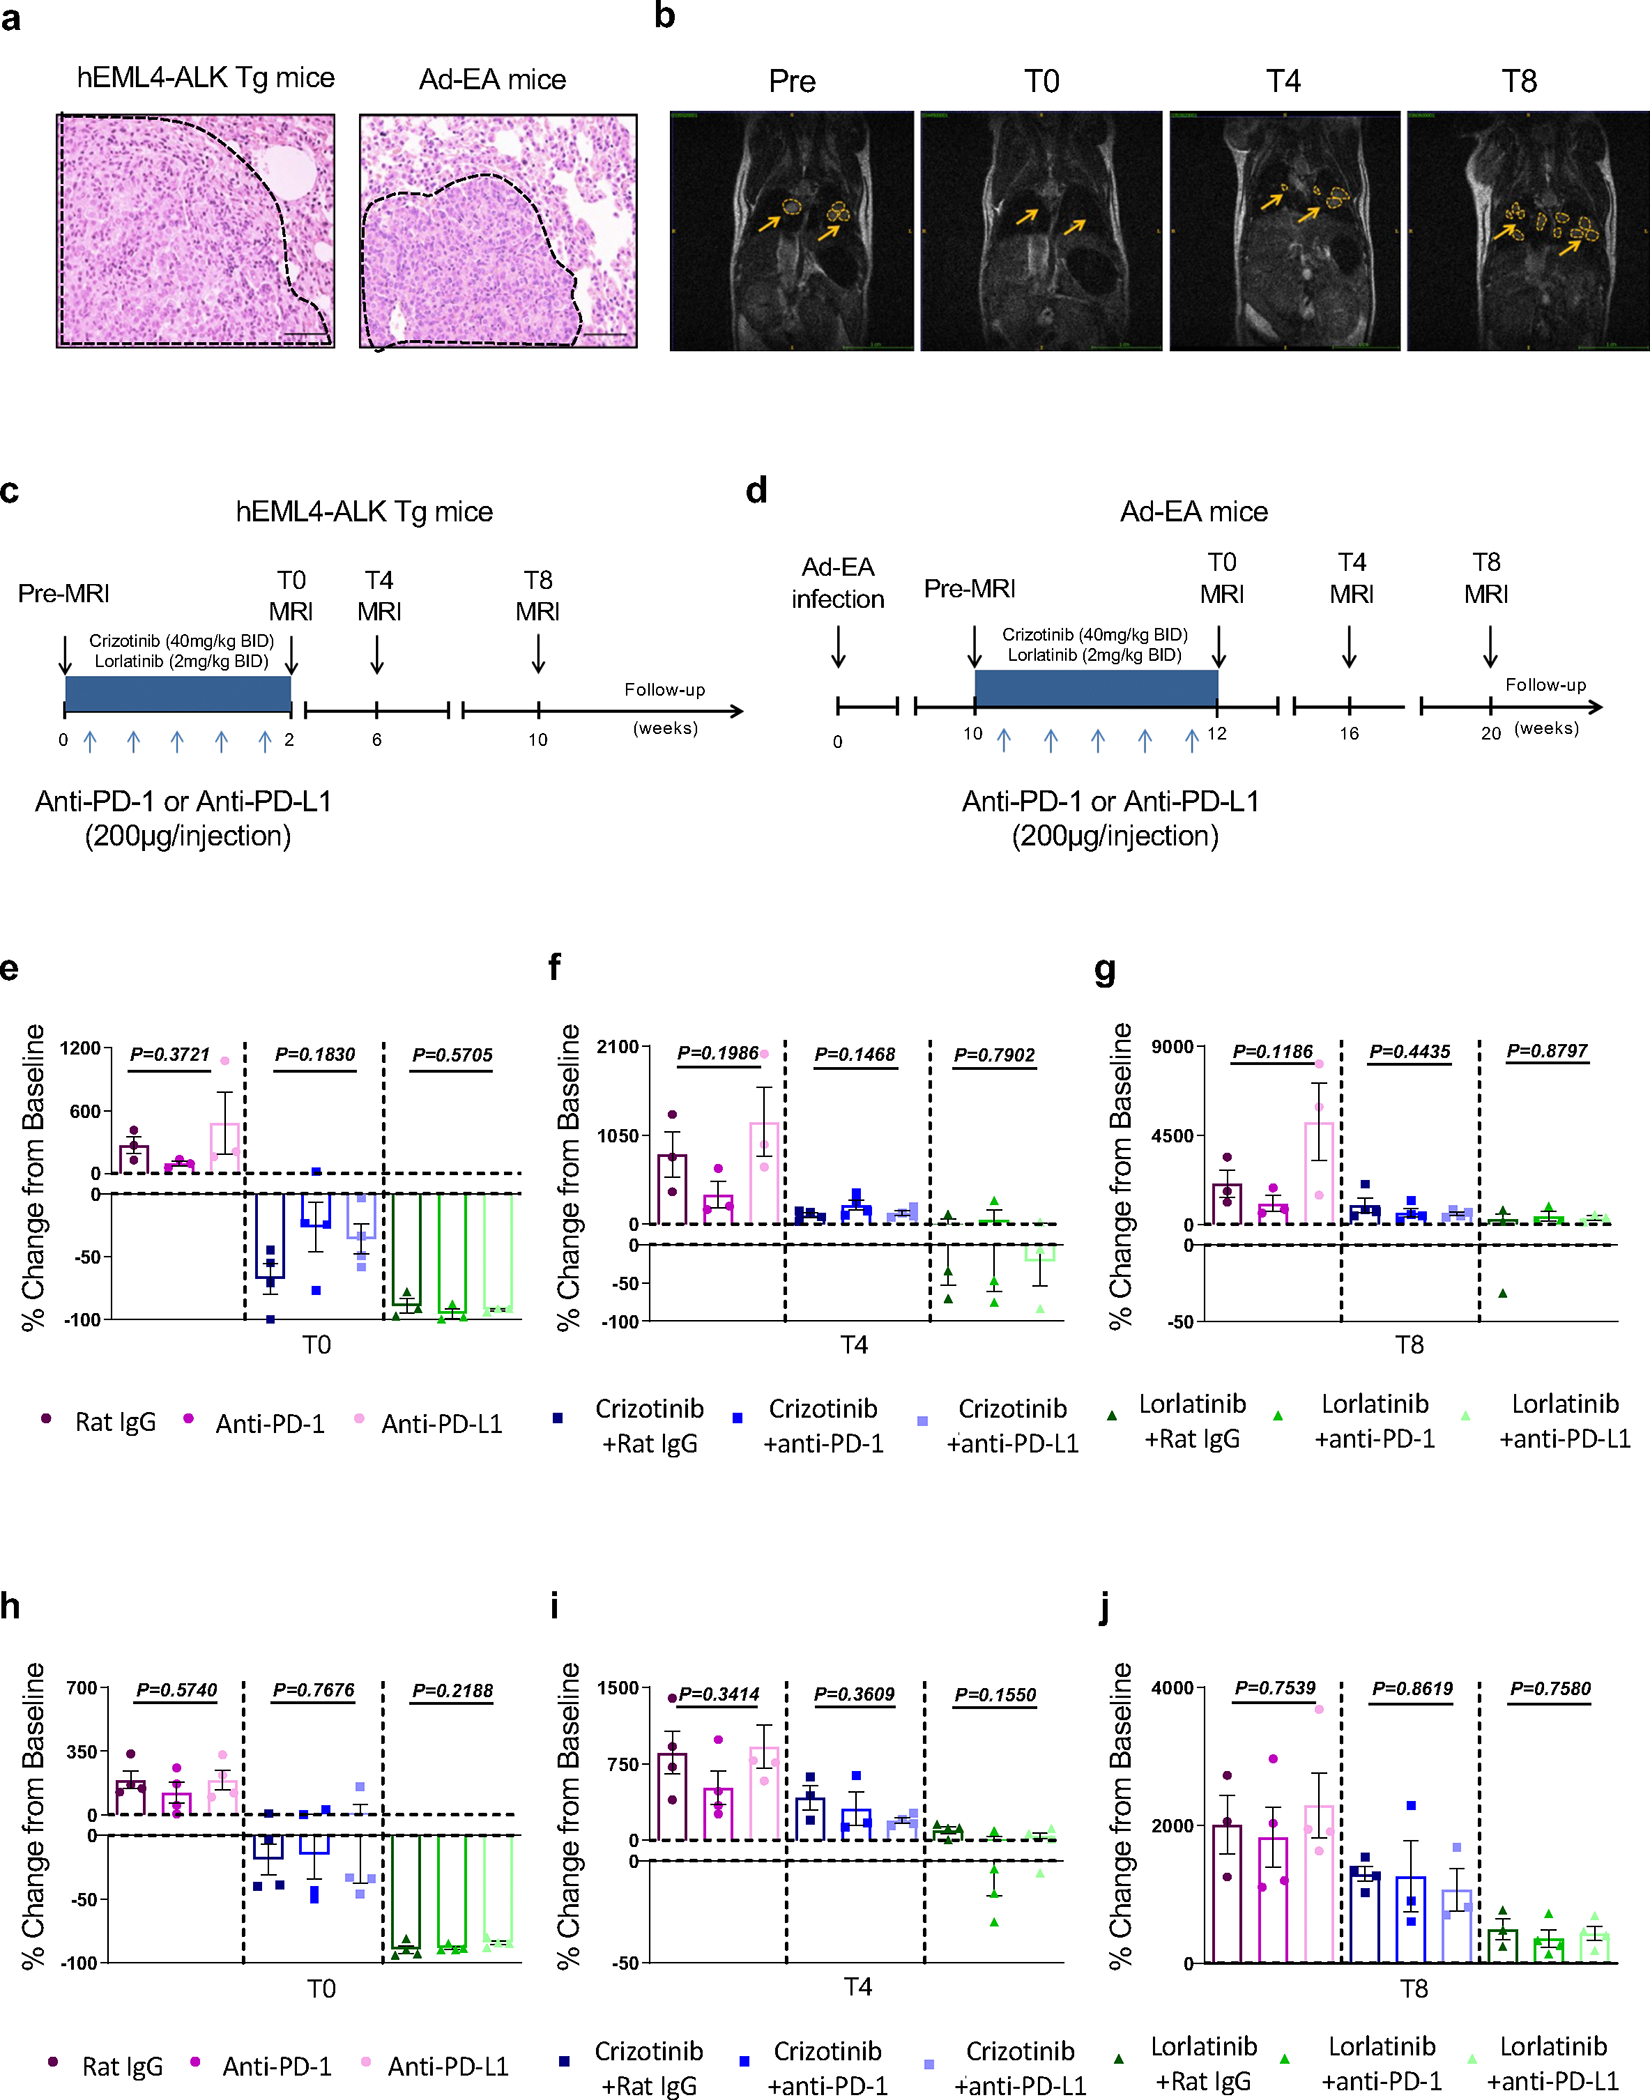
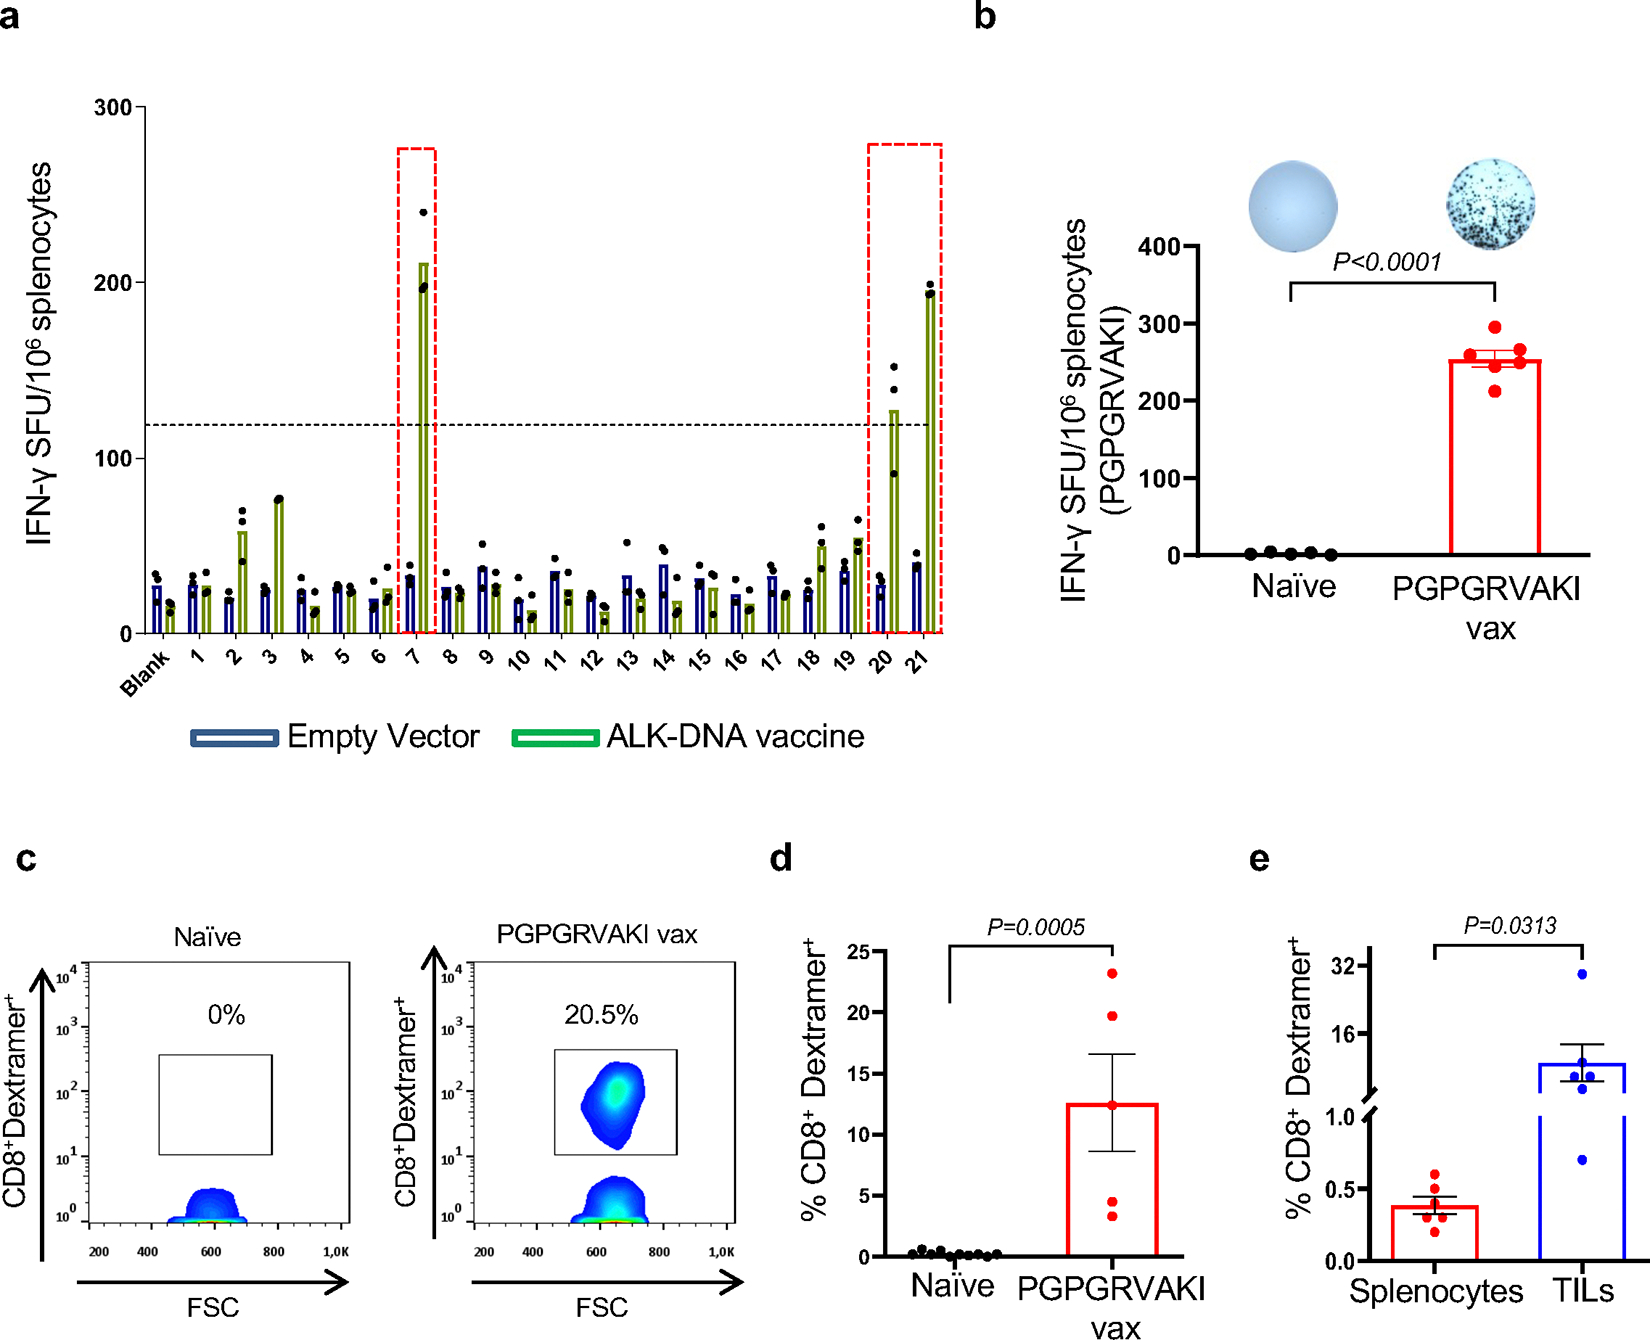
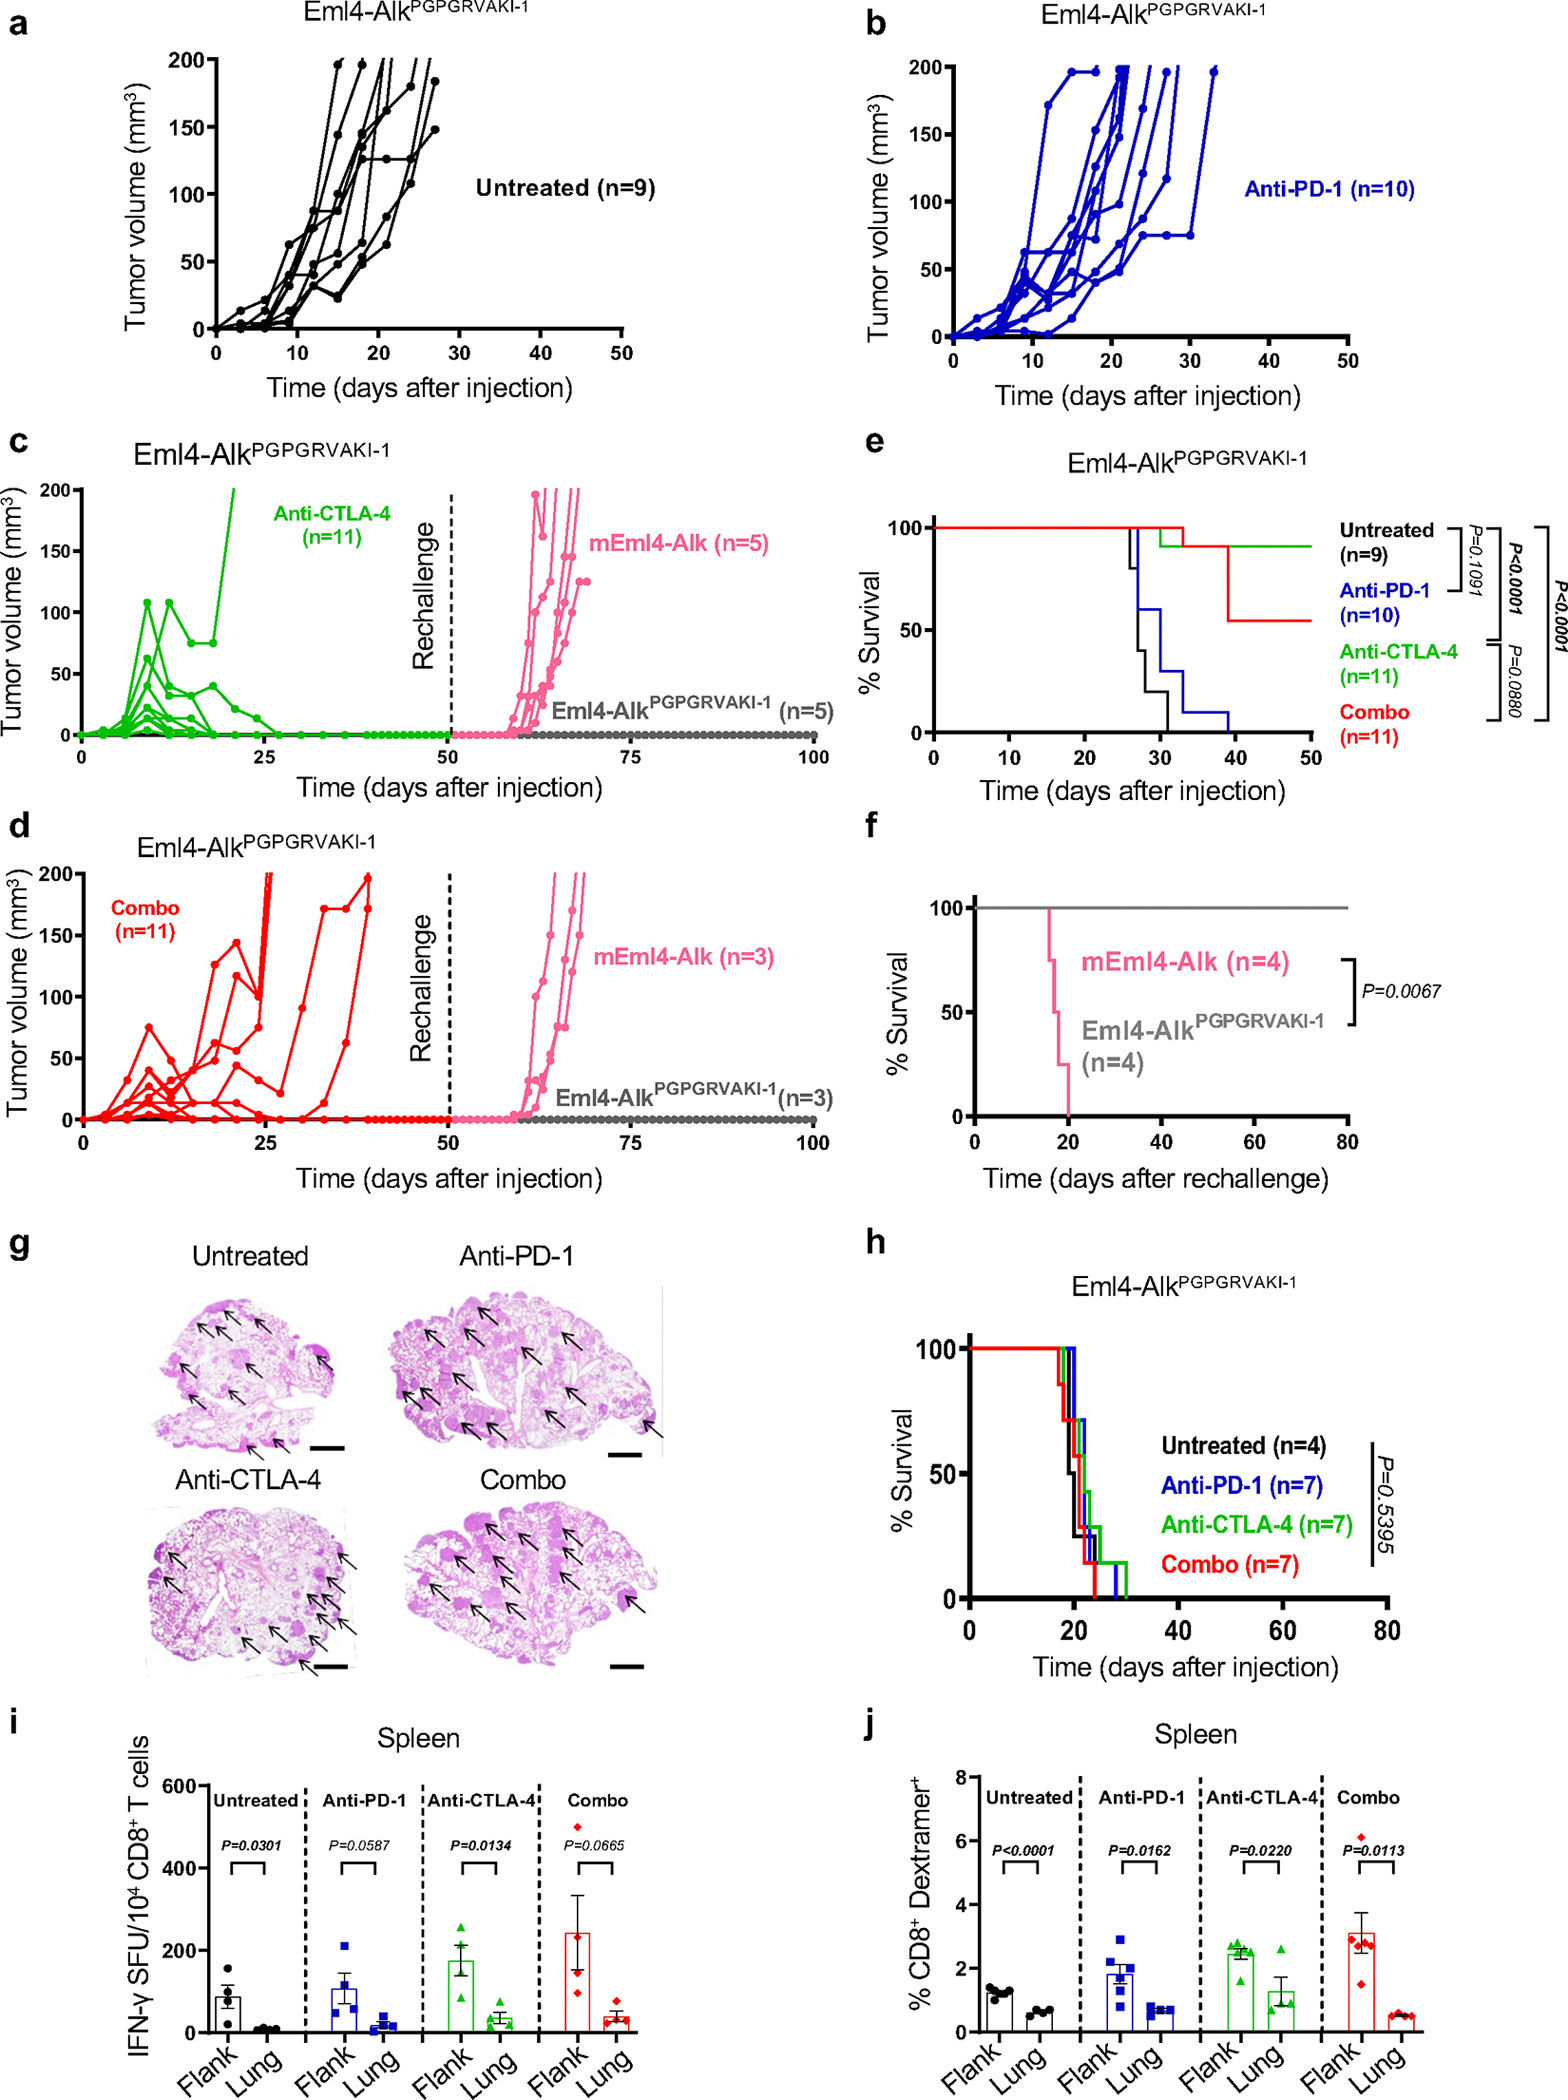
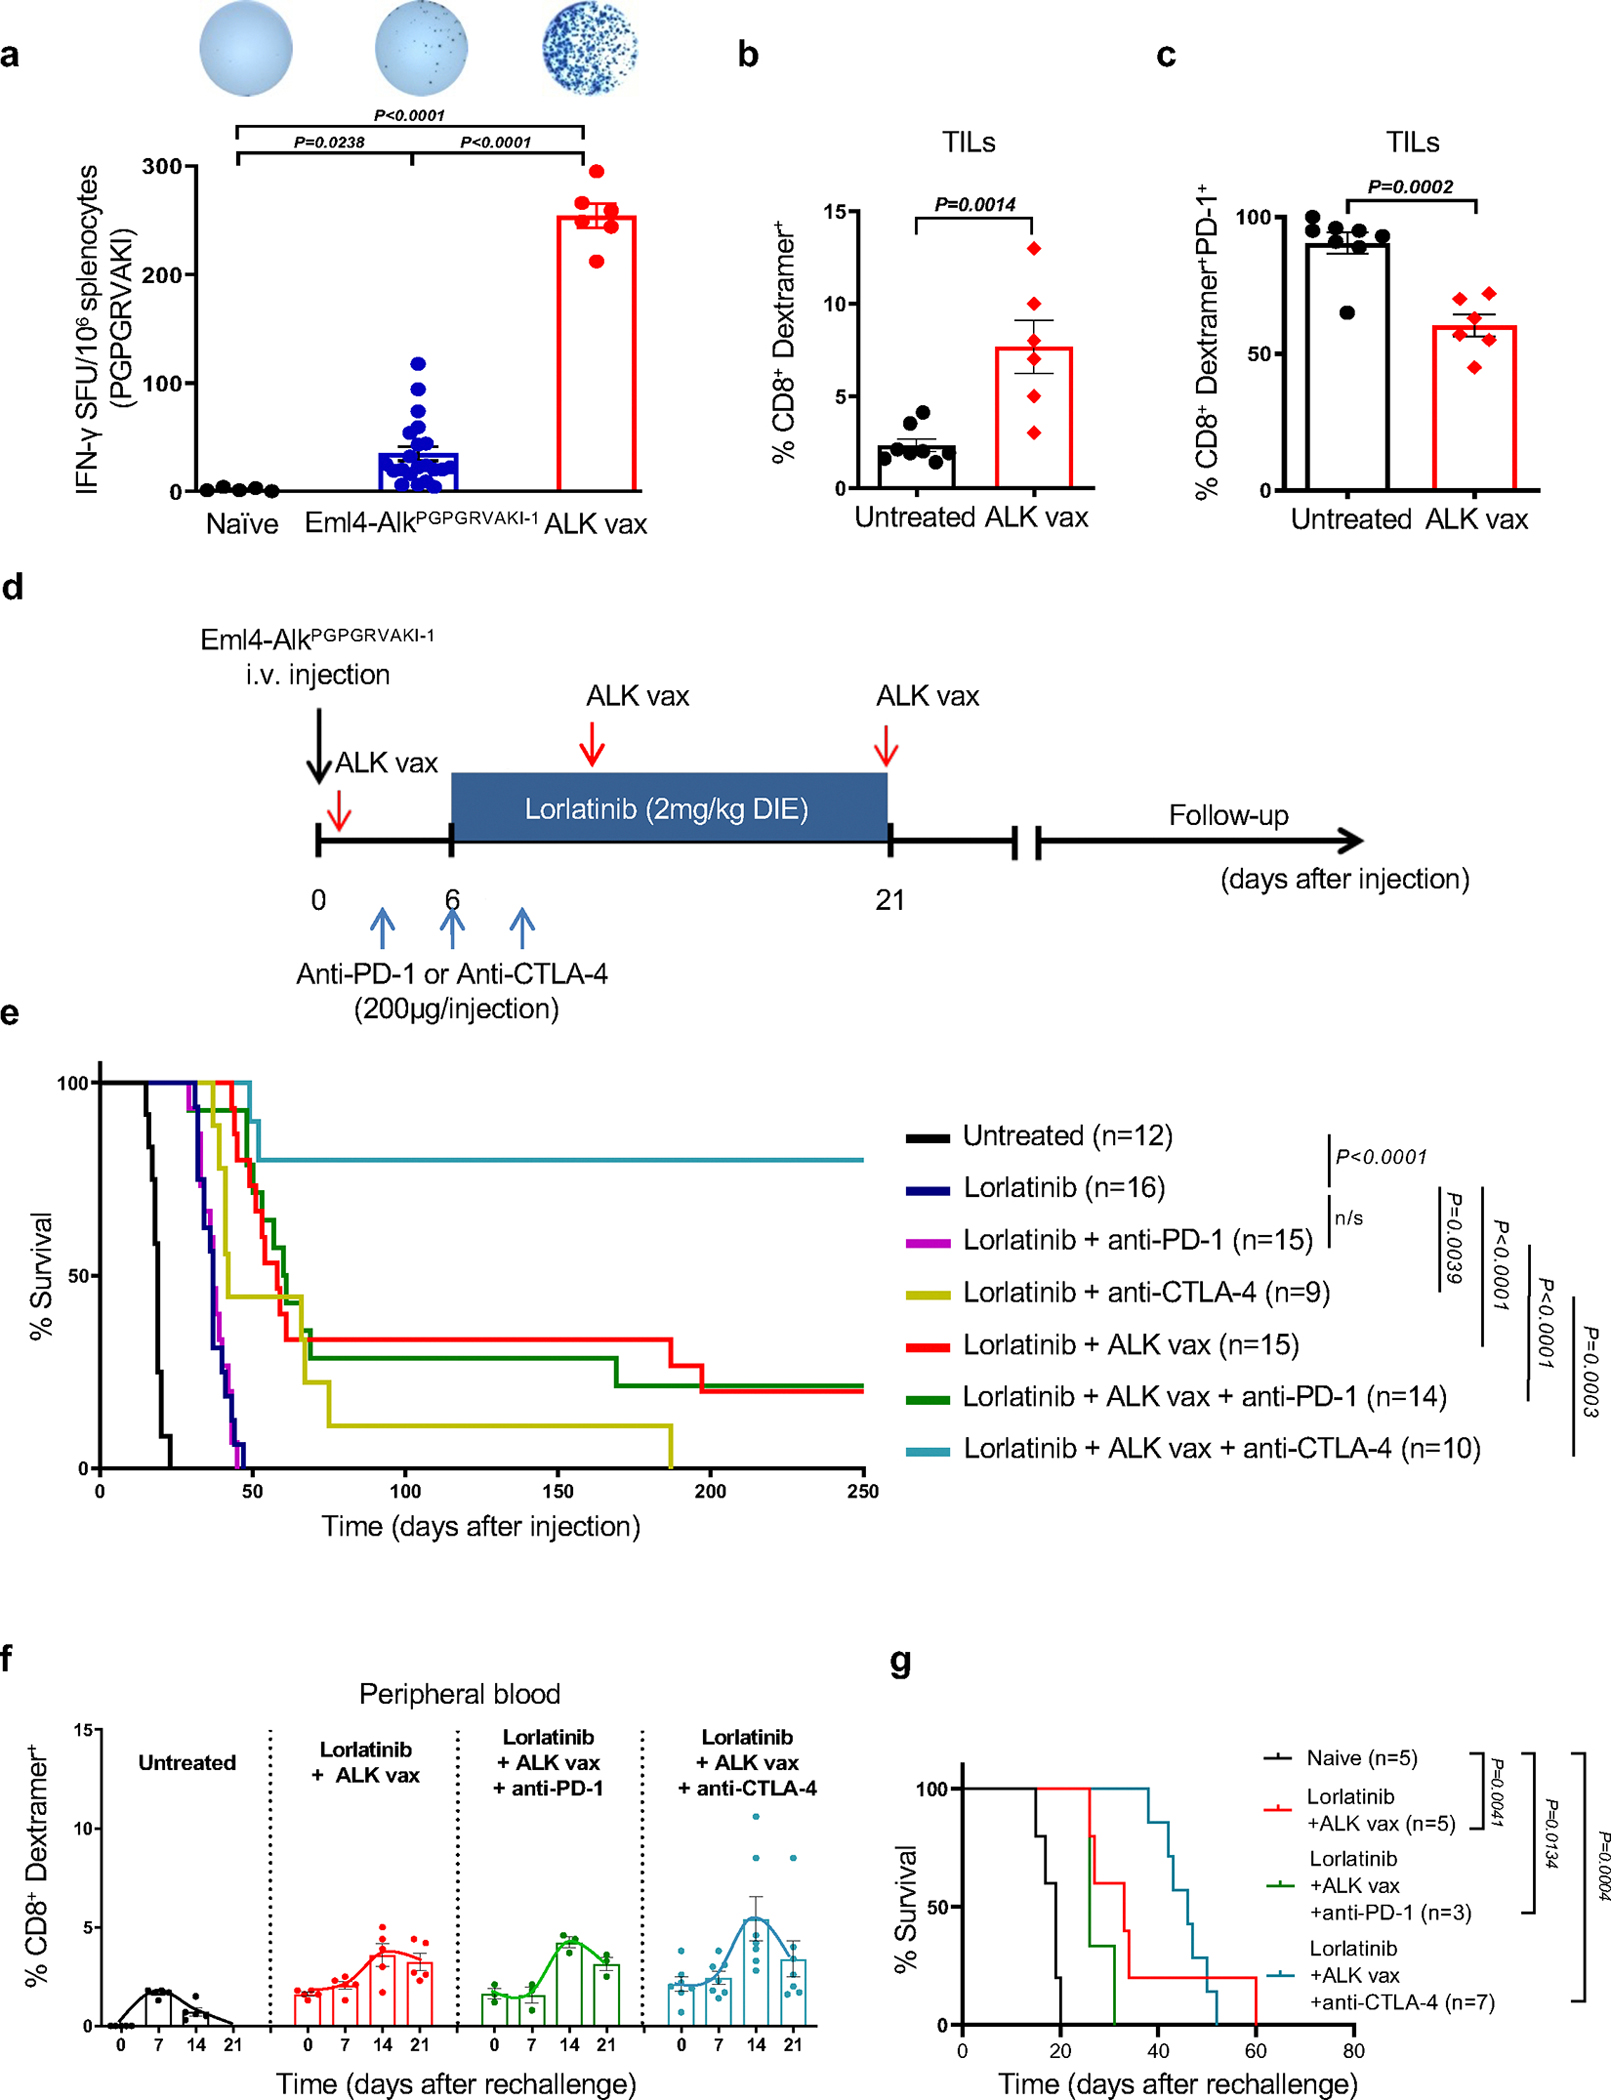
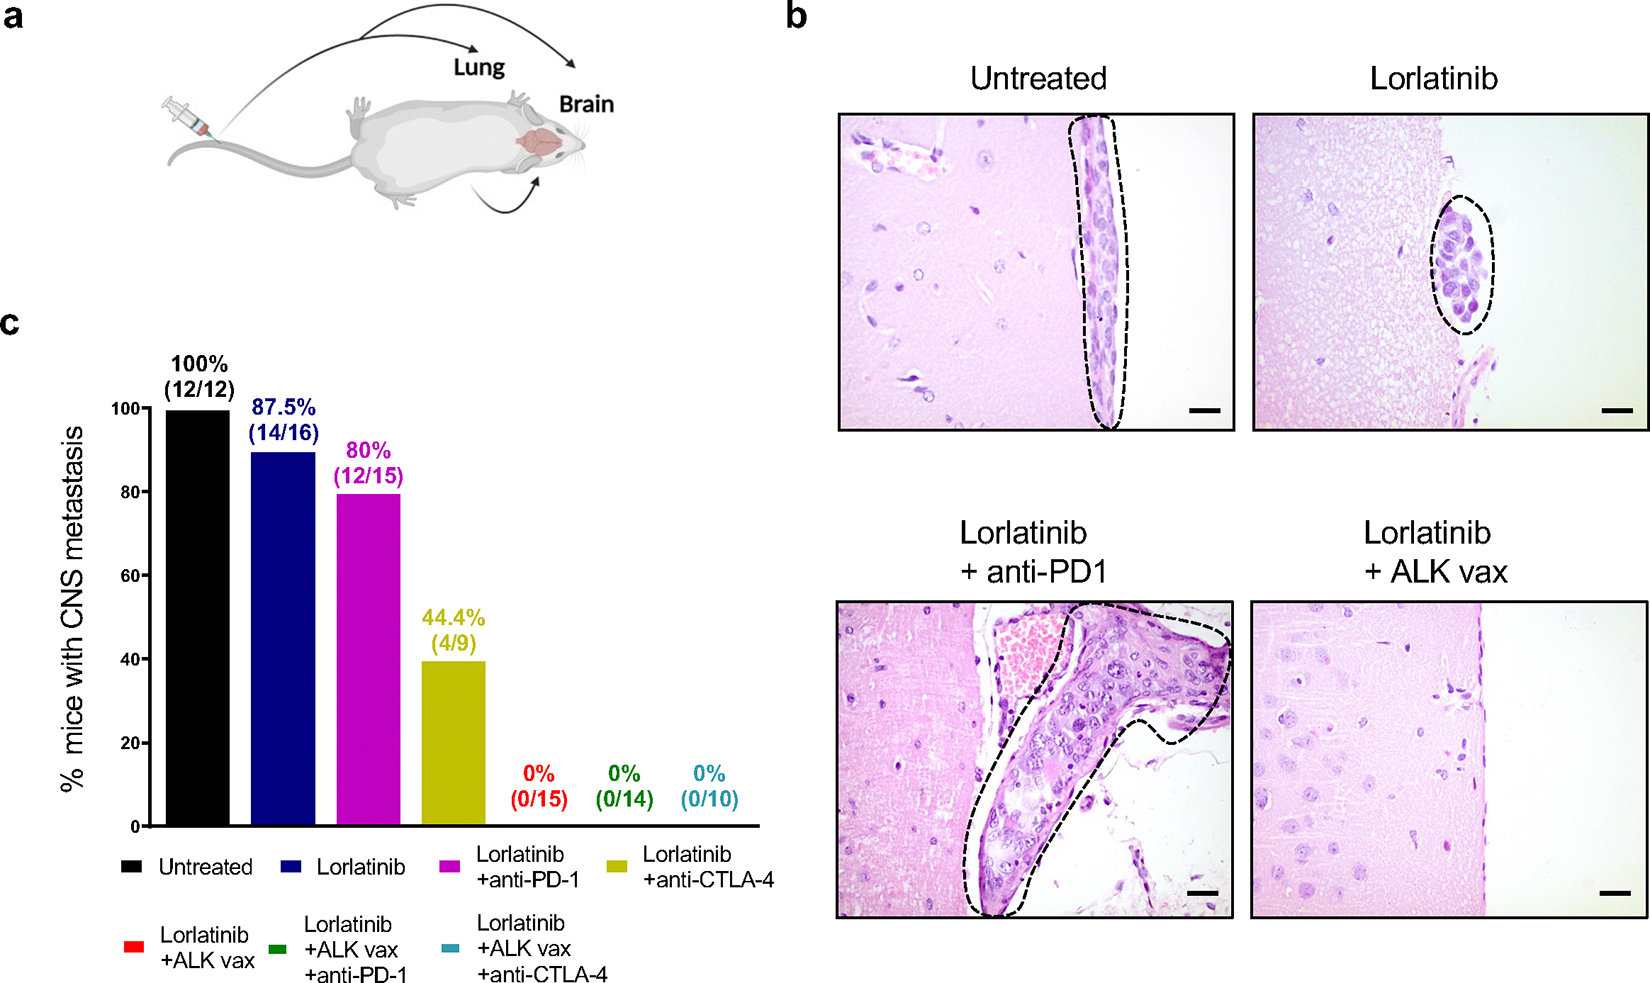
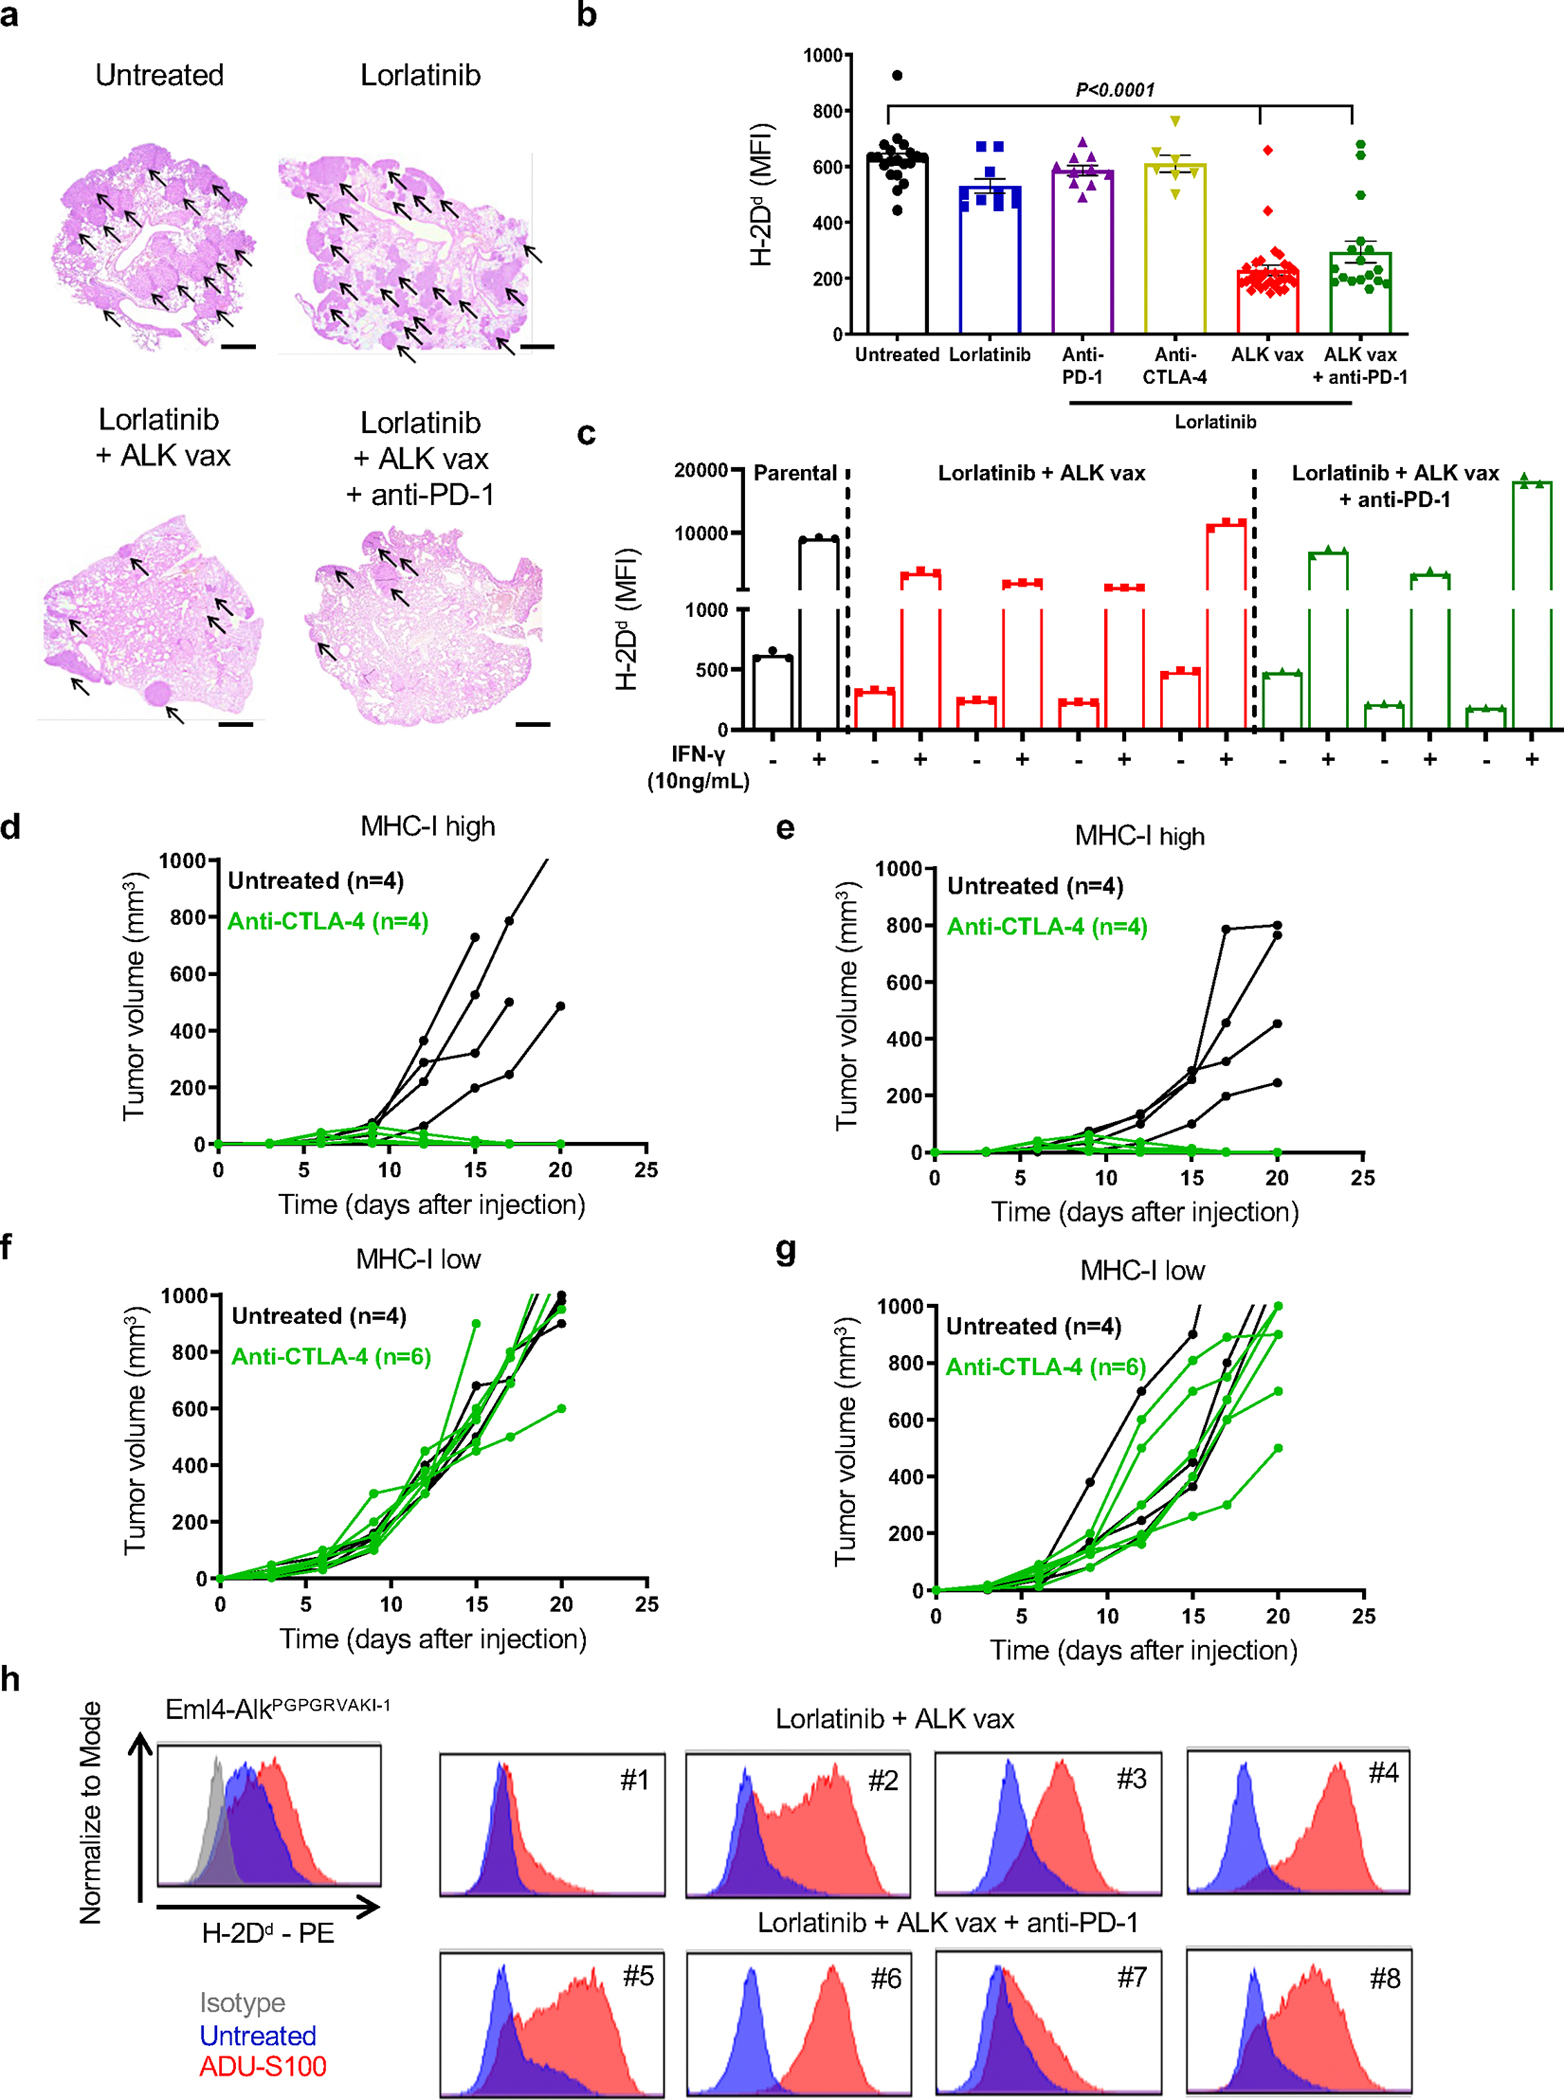
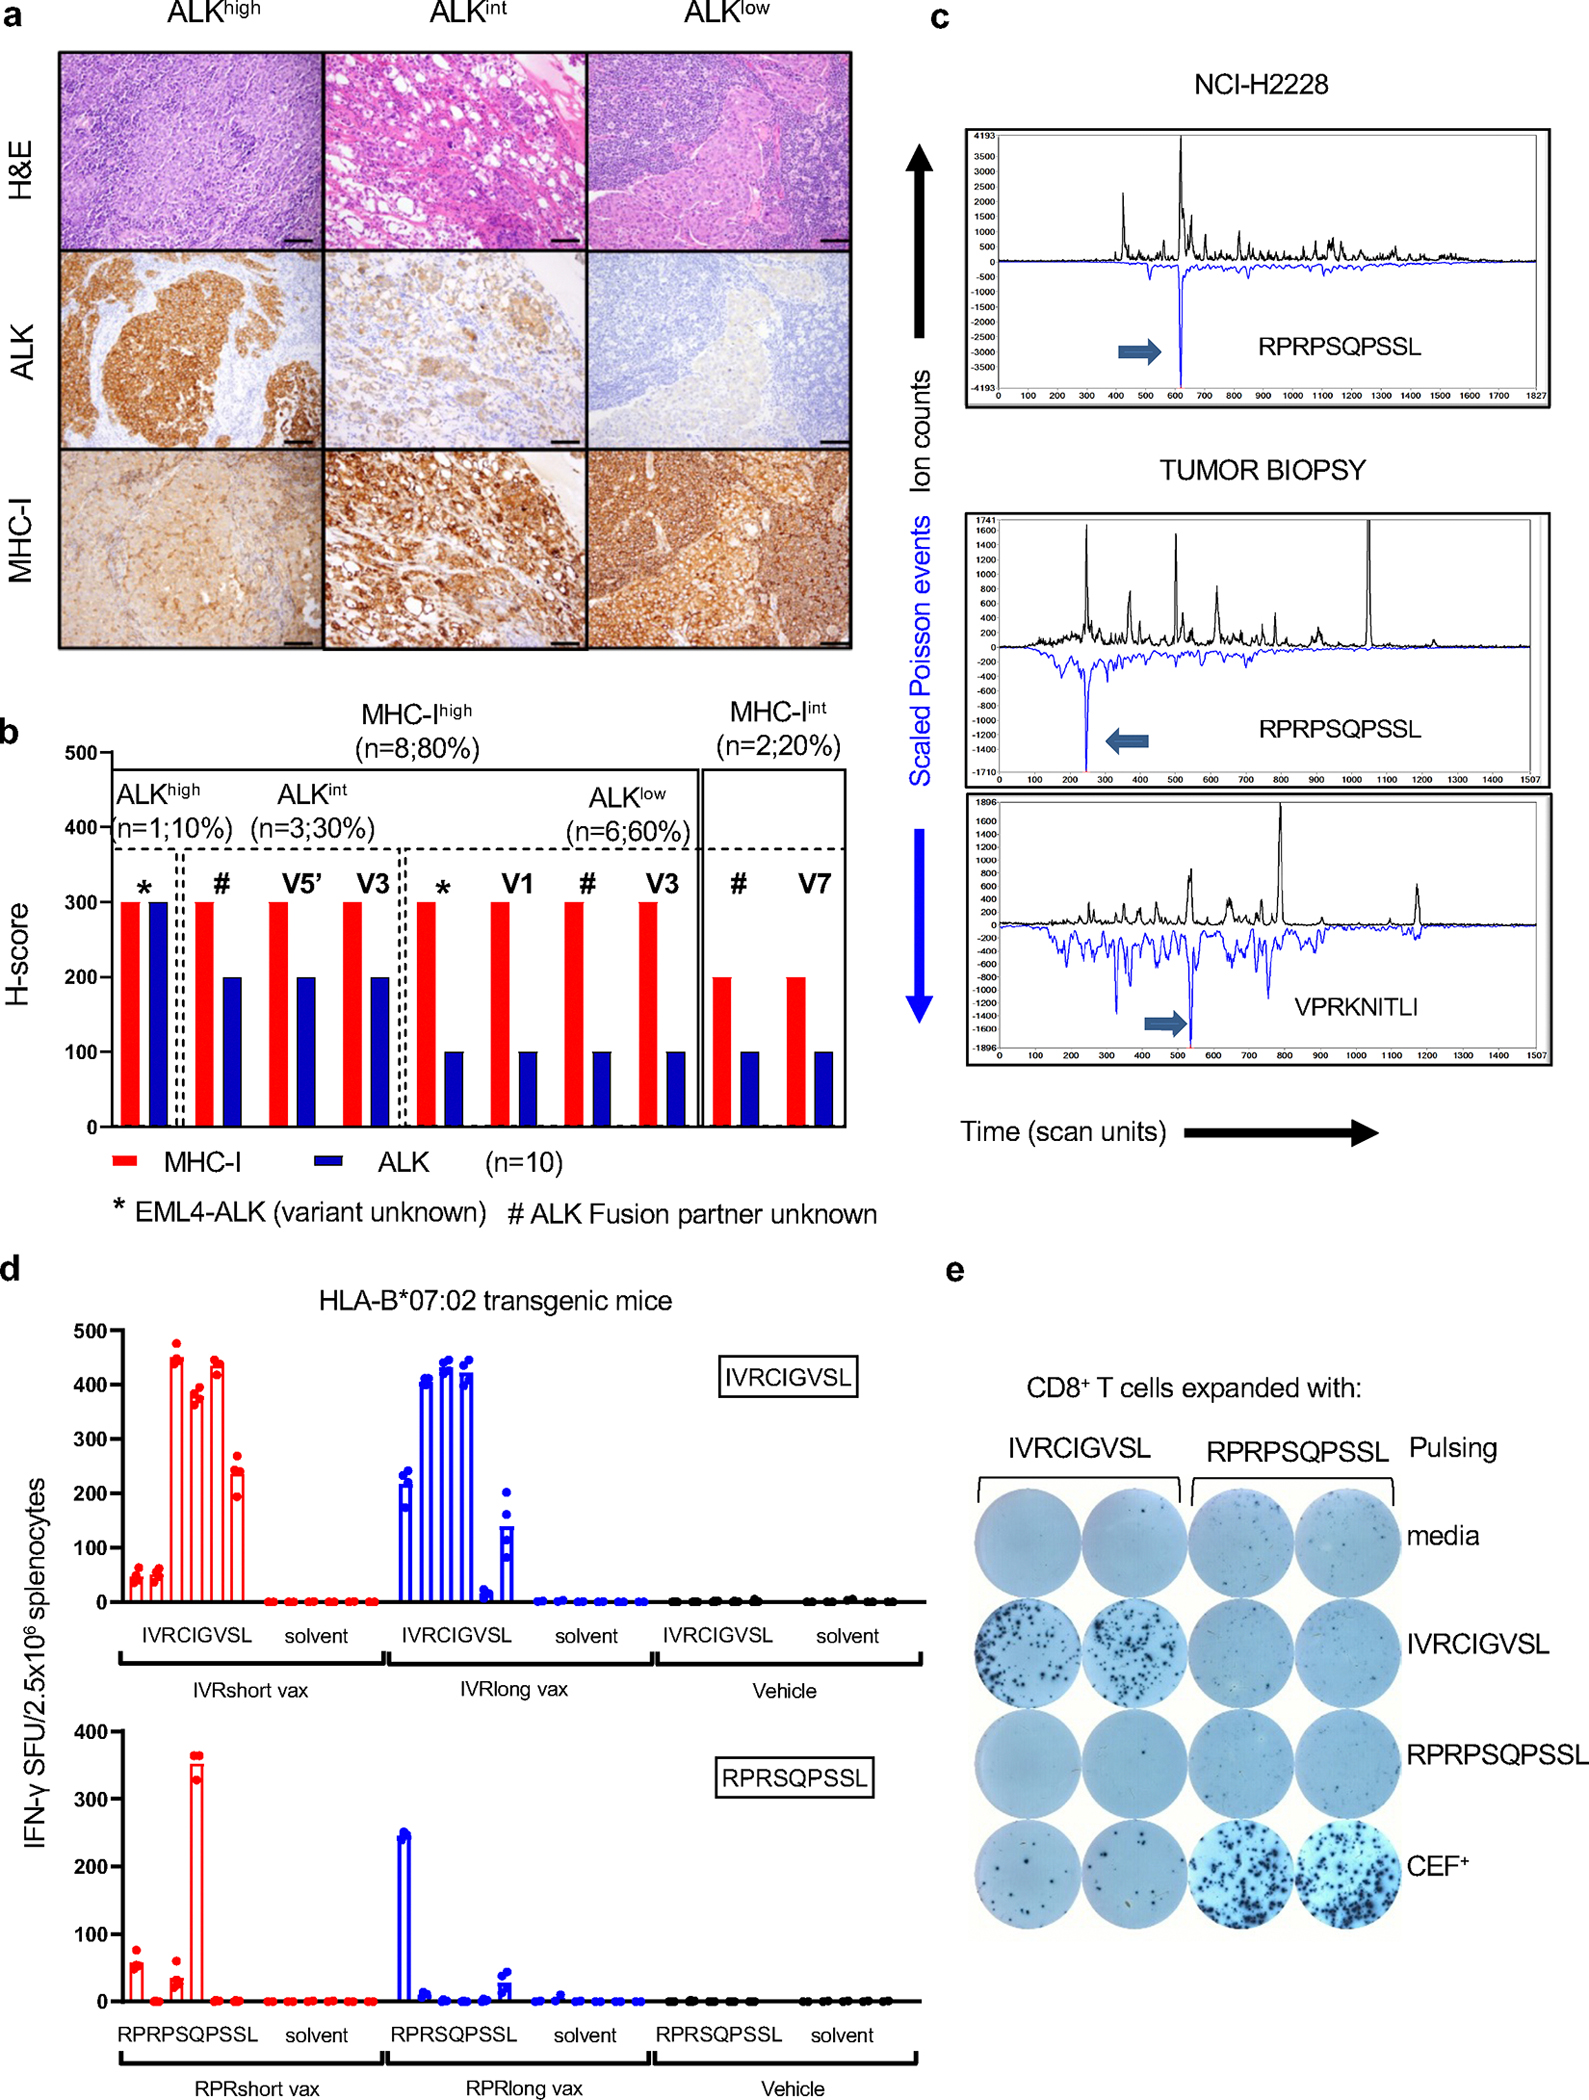
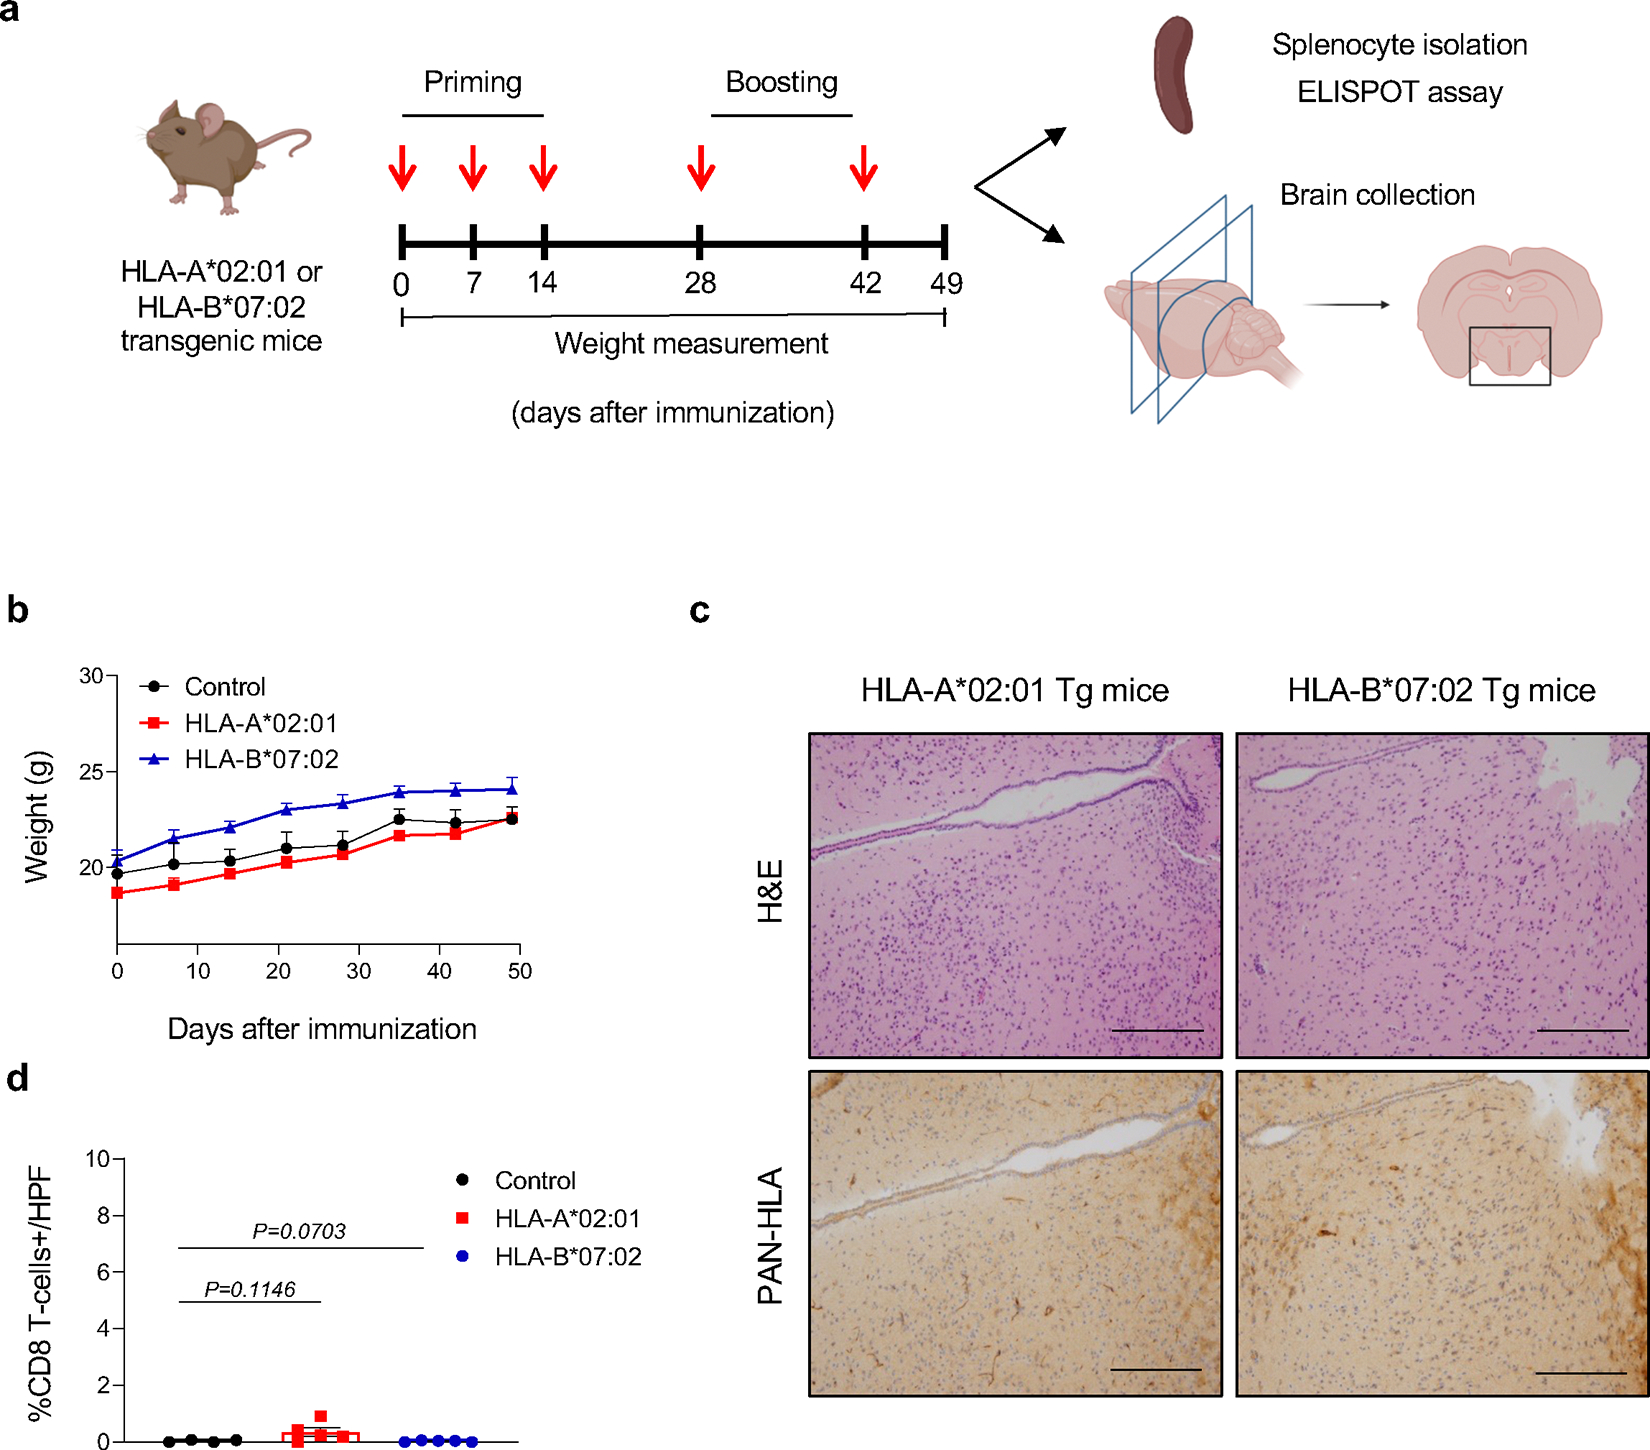
Anaplastic lymphoma kinase (ALK)-rearranged non-small cell lung cancer (NSCLC) is treated with ALK tyrosine kinase inhibitors (TKIs), but the lack of activity of immune checkpoint inhibitors (ICIs) is poorly understood. Here, we identified immunogenic ALK peptides to show that ICIs induced rejection of ALK+ tumors in the flank but not in the lung. A single-peptide vaccination restored priming of ALK-specific CD8+ T cells, eradicated lung tumors in combination with ALK TKIs and prevented metastatic dissemination of tumors to the brain. The poor response of ALK+ NSCLC to ICIs was due to ineffective CD8+ T cell priming against ALK antigens and is circumvented through specific vaccination. Finally, we identified human ALK peptides displayed by HLA-A*02:01 and HLA-B*07:02 molecules. These peptides were immunogenic in HLA-transgenic mice and were recognized by CD8+ T cells from individuals with NSCLC, paving the way for the development of a clinical vaccine to treat ALK+ NSCLC.


Conflict of interest statement

Conflicts of Interest:

R.C. and R.B.B. have filed IP related to human ALK vaccine sequences. R.C. and D.J.I. hold stock options in Elicio Therapeutics. DJI is a consultant to Elicio Therapeutics. R.B.B is a current employee of Moderna Inc. C.J.W. receives research funding from Pharmacyclics and holds equity in BioNTech Inc. D.B.K. is a scientific advisor for Immunitrack and Breakbio. DBK owns equity in Affimed N.V., Agenus, Armata Pharmaceuticals, Breakbio, BioMarin Pharmaceutical, Celldex Therapeutics, Editas Medicine, Gilead Sciences, Immunitybio, ImmunoGen, IMV, Lexicon Pharmaceuticals, Neoleukin Therapeutics. BeiGene, a Chinese biotech company, supported unrelated SARS COV-2 research at TIGL.

The remaining authors declare no competing interests.

Figures

Extended Data Fig. 1 |
Extended Data Fig. 1 |. Immune checkpoint inhibitors (ICIs) do not increase the efficacy of ALK TKIs in ALK+ lung cancer mouse models.
(a) Kaplan-Meier curves showing overall survival of mice described in Fig. 1c. Log-rank test, n/s, not significant (N = 3 mice per group). (b) Kaplan-Meier curves showing overall survival of mice described in Fig. 1d. Log-rank test; n/s, not significant (N = 4 mice per group) (c, d, e) Quantification of volume change compared with baseline tumor volume (change from baseline, % ± SEM) in hEML4-ALK Tg mice treated with higher doses (crizotinib: 100 mg/kg DIE; lorlatinib 10 mg/kg DIE) of ALK inhibitors and ICIs at T0 (c), T4 (d), and T8 (e) (Rat IgG, N = 12; anti-PD-1, N = 8; anti-PD-L1, N = 8; Crizotinib + Rat IgG, N = 13; Crizotinib + anti-PD-1, N = 8; Crizotinib + anti-PD-L1, N = 7; Lorlatinib + Rat IgG, N = 14; Lorlatinib + anti-PD-1, N = 7; Lorlatinib + anti-PD-L1, N = 8 mice). P values were calculated using an ordinary one-way Anova. (f) Kaplan-Meier curves showing overall survival of hEML4-ALK Tg mice treated with higher doses of ALK inhibitors and ICIs. Log-rank test; P values not significant. (Rat IgG, N = 12; anti-PD-1, N = 12; anti-PD-L1, N = 12; Crizotinib + Rat IgG, N = 13; Crizotinib + anti-PD-1, N = 8; Crizotinib + anti-PD-L1, N = 7; Lorlatinib + Rat IgG, N = 14; Lorlatinib + anti-PD-1, N = 9; Lorlatinib + anti-PD-L1, N = 8 mice). (g) Schematic representation of ALK peptide screening. Mice were vaccinated with a DNA encompassing the cytoplasmic portion of ALK, as previously described. A set of 21 synthetic long peptides (SLPs) encompassing the coding region of the ALK-DNA vaccine was synthesized. Peptides A/B were synthetized to cover the cytoplasmic portion of hALK protein that is not represented in the ALK-DNA vaccine. (h-j) Benchmarking MHC-I algorithms for peptide-binding affinity prediction. NetMHC4.0 showing peptide affinity (predicted IC50 values in nM) vs. NetMHCpan4.1 showing the rank of the elution ligand likelihood (%Rank_EL). Computational predictions of peptide binding to MHC-I of SLPA (h), SLP7 (i) and SLP20 and 21 ( j). Each dot represents a peptide. Peptide sequences and their correspondent predicted MHC-I allele can be found in Supplementary Table 3. Peptides represented in red or green indicate the best binder candidates.
Extended Data Fig. 2 |
Extended Data Fig. 2 |. Identification of ALK immunogenic peptides in mouse models.
(a, b) IFN-γ intracellular staining of CD4+-gated (a) and CD8+-gated (b) peripheral mononuclear cells (PBMCs) isolated from mice vaccinated with the indicated peptides and stimulated in vitro with the same peptide (%± SEM). Each dot represents a mouse (ALK1058–1066, n = 3; remaining groups, N = 4 mice). (c) IFN-γ intracellular staining in CD4+ and CD8+ splenocytes isolated from a representative mouse (N = 3 independent mice) vaccinated with SLP7 and pulsed with 10 μg/mL of the same peptide. (d) Representative flow cytometric analysis of H-2Kd and H-2Dd expression on ASB-XIV and ASB-XIVTAP2KO cells. Experiment performed three times. (e) H-2Dd and H-2Kd staining of ASB XIVTAP2KO cells incubated with increasing concentrations of PGPGRVAKI peptide displayed as mean fluorescence intensity (MFI) ( ± SEM) (n = 3 independent experiments). (f) Schematic representation of the generation of the mEml4-Alk immortalized cell lines. (g) Sanger sequencing chromatogram showing the mElm4-Alk inversion. The mouse Eml4-Alk inversion involves exon 14 of Eml4 and exon 20 of mouse Alk. (h) Representative immunoblot analysis (N = 3 independent experiments with similar results) showing mEML4-ALK protein expression in two mEml4-Alk (mEml4-Alk1 and mEml4-Alk2) immortalized cell lines. The K-RasG12D KP1233 cell line was used as a negative control; ALK SP8 antibody recognizes the murine EML4-ALK (arrow); ALK D5F3 antibody recognizes the human EML4-ALK in NCI-H3122. *Indicates a non-specific band recognized by the SP8 antibody. (i) Dose response curves of mElm4-Alk1 cells to different ALK TKIs (crizotinib, N = 2 independent experiments; alectinib, N = 1; ceritinib, N = 1; brigatinib, N = 2 independent experiments; and lorlatinib, N = 2 independent experiments). ( j) Representative immunoblot for the indicated proteins in mEml4-Alk1 cells treated with crizotinib and lorlatinib at the indicated concentrations for 6 h (N = 2 independent experiments with similar results). (k) Subcutaneous tumor growth (mm3 ± SEM) of mEml4-Alk−1 and mEml4-Alk−2 immortalized cell lines in NSG and syngeneic BALB/c mice (N = 4 mice per group). (l) Quantification of volume changes compared with baseline tumor volume (change from baseline, % ± SEM) in syngeneic BALB/c mice injected subcutaneously with a mEml4-Alk cell line and treated as indicated. Red arrow indicates the end of treatment (N = 5 mice per group).
Extended Data Fig. 3 |
Extended Data Fig. 3 |. Generation and immunogenicity of Eml4-AlkPGPGRVAKI immortalized cell lines.
(a) Representative H&E image of lung tumors generated in syngeneic BALB/c mice injected intravenously with mEml4-Alk. 2x magnification (left panel); 40x magnification (right panel) (n = 3 independent mice). Scale bar left = 1.5 mm; Scale bar right= 100 μm. (b) Schematic illustration of mouse and human ALK short peptide 7 sequences differences and CRISPR/Cas9-edited DNA bases (Red). NetMHC4.0 showing peptide affinity (predicted IC50 values in nM) for H-2Dd and NetMHCpan4.1 showing the rank of the elution ligand likelihood (%Rank_EL) for H-2Dd. (c) Sanger sequencing chromatogram showing the cDNA sequence of mEml4-Alk (upper panel), Eml4-AlkPGPGRVAKI-1 (middle panel), and Eml4-AlkPGPGRVAKI-2 (lower panel) of PGPGRVAKI peptide. (d,e) Dose response curves of Eml4-AlkPGPGRVAKI-1 (d) and Eml4-AlkPGPGRVAKI-2 (e) cell lines to different ALK inhibitors (crizotinib, alectinib, ceritinib, brigatinib, and lorlatinib). Two independent experiments were performed for each ALK inhibitor in each cell line. (f) Representative immunoblot for the indicated proteins in Eml4-AlkPGPGRVAKI-1 cells treated with lorlatinib at the indicated concentrations for 6 h (N = 2 independent experiments with similar results). (g) Representative H&E of lung tumors generated in syngeneic BALB/c mice injected intravenously with Eml4-AlkPGPGRVAKI-1. 2x magnification (left panel); 40x magnification (right panel) (n = 3 independent mice). Scale bar left = 1.5 mm; Scale bar right= 100 μm. (h) IFN-γ-ELISPOT analysis of freshly isolated splenocytes from tumor-bearing BALB/c mice 15 days after been injected either subcutaneously (flank) or intravenously (lung) with mEml4-Alk (left panel), Eml4-AlkPGPGRVAKI-1 (middle panel), and Eml4-AlkPGPGRVAKI-2 (right panel) cells. Data is shown as average number of spot forming units (SFU ± SEM). Unpaired two-tailed Student’s t test, not significant, P = 0.2038; **P < 0.005; ***P < 0.001. The N shown on the figure corresponds to the number of mice per group. (i,j) Dextramer staining of PGPGRVAKI-specific CD8+ T cells isolated from splenocytes (i) and PGPGRVAKI-specific tumor infiltrating T lymphocytes (TILs) isolated from lung tumors ( j) at day 15 post subcutaneous (flank) and intravenous (lung) injection. Mice were injected with mElm4-Alk (left panel), with Eml4-AlkPGPGRVAKI-1 (middle panel), and with Eml4-AlkPGPGRVAKI-2 (right panel) cells (%±SEM). Unpaired two-tailed Student’s t test. The N shown on the figure corresponds to the number of mice per group. (k) Tumor growth of mice injected subcutis in the flank with mEml4-Alk1 cells and treated as indicated. Data are shown as average tumor volume (mm3 ± SEM). (l) Kaplan-Meier curves showing overall survival of mice injected intravenously with Eml4-AlkPGPGRVAKI-1 and treated as indicated. Log-rank test), not significant, P = 0.6040).
Extended Data Fig. 4 |
Extended Data Fig. 4 |. Immunogenicity of the ALK vaccine in mice.
(a) Quantification of the number of tumors counted on a histology section taken in the middle of the lungs from mice shown in Fig. 3g. Each dot represents an individual mouse (n = 4 biological independent mice per group). Data are represented as mean ± SEM. Unpaired two-tailed Student’s t test, not significant, P = 0.6790). (b) Schematic representation of treatment protocol of hEML4-ALK Tg mice vaccinated with either an ALK DNA vaccine or an ALK amph-vaccine. (c) In vivo cytotoxic activity represented as % of lysis of target ALK+ cells ( ± SEM) by ALK-specific CD8+ T-cells in mice treated as in b. Each dot represents a mouse (Untreated, N = 7; ALK vax, N = 13, ALK-DNA vax, N = 8 mice). Unpaired two-tailed Student’s t test, not significant, P = 0.0882; ***P = 0.0004; ****P < 0.0001. (d) Tumor volumes indicated as mm3 ( ± SEM) were measured by MRI at the indicated time points in hEML4-ALK Tg mice treated with an ALK peptide vaccine as in b. Unpaired two-tailed Student’s t test, *P = 0.0173; **P = 0.0027. The N shown on the figure corresponds to the number of mice per group. (e) Kaplan-Meier curves showing overall survival of mice injected intravenously with Eml4-AlkPGPGRVAKI-1 and vaccinated with the PGPGRVAKI peptide with CDN adjuvant at days 1, 7, and 14 after tumor injection, alone or in combination with an anti-CTLA-4 antibody (administered at day 3, 6, and 9 after tumor injection). Log-rank test: not significant, P = 0.2985, P = 0.1276; *P = 0.0228; *P = 0.0153. The N shown on the figure corresponds to the number of mice per group. (f) Quantitative analysis of intratumoral CD8+ T cells per high power field (HPF) from mice in indicated treatment regimens (Untreated, N = 7; Lorlatinib, N = 3; Lorlatinib + ALK vax, N = 5 mice). ALK vax: PGPGRVAKI peptide with CDN adjuvant. Data are represented as in average number of four high power field per mouse (% ± SEM). Unpaired two-tailed Student’s t test, not significant, P = 0.1096; ***P = 0.0003; ****P < 0.0001. (g) Representative H&E and paired CD8 immunohistochemistry staining of lung tumors from mice treated as indicated. Scale bars = 50 μm. (h) Dextramer staining of PGPGRVAKI-specific CD8+ T cells isolated from lung tumors, displayed as percentage (% ± SEM). Mice were treated as indicated, and tumors collected upon death. Each dot represents an individual mouse (N = 4 mice per group). Unpaired two-tailed Student’s t test, not significant, P = 0.3545, P = 0.2740, P = 0.1935. (i) Relative normalized expression of Alk mRNA in ex vivo cell lines isolated from lung tumors that escaped the indicated treatments. Normalized expression relative to the parental tumor line ( ± SEM). The N shown on the figure corresponds to the number of ex vivo cell lines isolated and analyzed per group.( j) Representative immunoblot for the indicated proteins from four MHC-Ihigh and four MHC-Ilow cell lines isolated from lung tumors that escaped treatment. Eml4-AlkPGPGRVAKI-1 parental cell line was used as control. Two independent experiments were performed with similar results. (k) Representative chromatogram of Sanger sequencing showing the PGPGRVAKI peptide cDNA sequences in representative cell lines isolated from lung tumors that escaped the indicated treatments lung tumor escapers from each indicated treatment group. mEml4-Alk represents the unedited sequence.
Extended Data Fig. 5 |
Extended Data Fig. 5 |. Characterization of tumors that escaped the ALK vaccine and MHC-I expression in human ALK + NSCLC.
(a) PD-L1 expression of cell lines isolated from lung tumors that escaped the indicated treatment, displayed as mean fluorescence intensity (MFI) ( ± SEM). Each dot represents an individual tumor. (b-i) Relative normalized mRNA expression of Lpm2(b), Lpm7(c), Tap1(d), Tap2(e), B2m (f), Tapasin(g), Mecl1 (h), and Sting (i) genes in tumor lines isolated ex vivo from lung tumors that escaped the indicated treatments. For all samples the values were normalized to the expression levels of the parental Eml4-AlkPGPGRVAKI-1 cell line cultivated in vitro (± SEM). The N shown on the figure corresponds to the number of ex vivo cell lines isolated and analyzed per group. ( j-o) ALK+ NSCLC expresses HLA-A/B mRNA and protein at levels comparable to NSCLC with other oncogenic drivers (CPTAC dataset). Boxplot showing mRNA and protein expression of ALK (j, k), HLA-A (l,m), HLA-B (n, o), from cases of ALK+ NSCLC from the Clinical Proteomic Tumor Analysis Consortium (CPTAC). Fusion variants of the 7 ALK + NSCLC cases: 5 EML4-ALK, 1 ANKRD36B-ALK, 1 HMBOX1-ALK. Number of samples with ALK-fusion: n = 7, KRAS-mutation: n = 32, EGFR-mutation: n = 35, wild type samples not represented on the plot: n = 36. The boxplots show the median (line), and the interquartile range (IQR), and the whiskers represent 1.5× the IQR ± the upper and lower quartiles, respectively.
Extended Data Fig. 6 |
Extended Data Fig. 6 |. Characterization of MHC-I expression in human ALK + NSCLC and identification of MHC-I human ALK peptides in human ALK+ lymphoma cell lines.
(a-b) Boxplot showing mRNA and protein expression of HLA-BC from cases of ALK+ NSCLC from the Clinical Proteomic Tumor Analysis Consortium (CPTAC). (c-f) ALK+ NSCLC express HLA-A/B/C mRNA and protein at levels comparable to NSCLC with other oncogenic drivers (TCGA dataset). Boxplot showing mRNA expression of ALK (c), HLA-A (d), HLA-B (e), and HLA-C (f) from cases of ALK+ NSCLC from The Cancer Genome Atlas (TCGA) LUAD gene expression (http://cancergenome.nih.gov). All 4 ALK+ NSCLC had an EML4-ALK fusion. Number of samples with ALK-fusion: n = 4, KRAS-mutation: n = 155, EGFR-mutation: n = 56, wild type samples not represented on the plot: n = 301. The boxplots show the median (line), and the interquartile range (IQR), and the whiskers represent 1.5× the IQR ± the upper and lower quartiles, respectively. (g) Targeted mass spectrometry from HLA A*02:01 immunoprecipitations of the ALCL cell line DEL. Oxidized and non-oxidized methionine forms of the peptide AMLDLLHVA were monitored. (h) Poisson LC-DIAMS plots from pan-HLA immunoprecipitations of the ALK+ ALCL cell lines DEL. Poisson plots combine an extracted ion chromatogram (XIC) for the peptides’ precursor m/z (black trace) with an inverted, scaled Poisson chromatogram (blue trace, see Methods). Peptide detection (see Methods) at an elution point is associated with coincident precursor and Poisson peaks, here marked by blue arrows The elution position lies near the predicted elution position determined by a retention time peptide set added to the DEL (h, lower panel) samples and, after sample data was collected, the synthetic set of ALK peptides.
Extended Data Fig. 7 |
Extended Data Fig. 7 |. Identification of MHC-I human ALK peptides in human ALK+ cell lines.
(a) Identification of ALK-specific peptides by discovery mass spectrometry from pan-HLA immunoprecipitations of the ALCL cell line Karpas-299. (b) Poisson LC-DIAMS plots from pan-HLA immunoprecipitations of the ALK+ ALCL cell lines Karpas-299. Poisson plots combine an extracted ion chromatogram (XIC) for the peptides’ precursor m/z (black trace) with an inverted, scaled Poisson chromatogram (blue trace, see Methods). Peptide detection (see Methods) at an elution point is associated with coincident precursor and Poisson peaks, here marked by blue arrows The elution position lies near the predicted elution position determined by a retention time peptide set added to the Karpas-299 (b, lower panel) samples and, after sample data was collected, the synthetic set of ALK peptides. (c) Poisson analysis of the same LC-DIAMS datasets detecting AMLDLLHVA in DEL but not in NCI-H2228, using reference information for a set of common HLA-A*02:01 peptides, identifies substantially better A02:01 peptide recovery from NCI-H2228. Hence, that NCI-H2228 cells do not present HLA-A*02:01 peptides from ALK, including the strong binding AMLDLLHVA peptide detected in the ALCL cell line DEL, cannot be associated with poor overall recovery of A*02:01 peptides.
Extended Data Fig. 8 |
Extended Data Fig. 8 |. Identification of MHC-I human ALK peptides and characterization of the immunoproteasome in human ALK+ cell lines.
(a) Cell type specificity in antigen presentation. HLA A*02:01 restricted ALK peptide AMLDLLHVA is displayed in DEL cells (i) but not in H2228 cells (ii). These lines are HLA A*02:01 positive and an abundant display of common HLA-A2 peptides was detected. Both HLA B*07:02 restricted ALK peptides RPRPSQPSSL and VPRKNITLI are displayed in Karpas-299 cells (iii and v) while RPRPSQPSSL is displayed in H2228 cells (iv) and VPRKNITLI is not (vi). Blue arrows mark detection signatures associated with coincident XIC and Poisson peaks. For the negative detections in (ii) and (vi) orange arrows mark the expected elution position as calculated from the elution of added retention time peptides (see Methods). Expected elution positions and detection positions overlap for positive detection, as is the case for the other 4 panels. (b-g) Expression of Tap1, Tap2, B2M, Tapasin, Lmp2 and Lmp7 in ALK+ lung cancer and lymphoma cell lines. Relative normalized mRNA expression of (b)Tap1, (c)Tap2, (d) B2m, (e) Tapasin, (f) Lpm2, (g) Lpm7 genes in NCI-H2228, Karpas-299 and DEL cell lines either at baseline or stimulated for 24 hours with 10 ng/mL IFN-γ. Values are normalized to the expression levels of NCI-H2228 line at baseline. Dots represent technical replicates from a single experiment. (h) Expression of HLA molecules was determined by flow cytometry with a pan-HLA antibody in NCI-H2228, Karpas-299 and DEL cell lines either at baseline or stimulated for 24 hours with 10 ng/mL IFN-γ.
Extended Data Fig. 9 |
Extended Data Fig. 9 |. Immunogenicity of ALK-specific peptides in HLA transgenic mice.
(a) Scheme of vaccination of HLA-A*02:01 and HLA-B*07:02 transgenic mice. (b) Sequence comparison of the ALK peptides between mouse and human. (c) Quantification of IFN-γ ELISPOT assays of splenocytes isolated from HLA-A*02:01 transgenic mice vaccinated with AMLshort or AMLlong peptides with CDN adjuvant. PBS was used as a vaccination control (N = 5 mice per group). Each bar represents spot forming units (SFU) from splenocytes isolated from an individual mouse and incubated with either peptide AMLDLLHV or peptide solvent (DMSO) as a negative control. Two independent experiments were performed. Data are represented as three technical replicates from one experiment. (d) Schematic representation of the expansion protocol for human CD8+ T cells from PBMCs of patients with NSCLC in the presence of ALK-specific peptides. The displayed alternative expansion methods were applied for those patients with lower amount of PBMCs available.
Extended Data Fig. 10 |
Extended Data Fig. 10 |. Physiologic ALK expression is low and limited to certain areas in the brain with low expression of HLA-A, HLA-B and HLA-C.
ALK (a), HLA-A (b), HLA-B (c) and HLA-C (d) mRNA expression in the indicated tissues according to the Genotype-Tissue Expression (GTEx) project (https://gtexportal.org/home/). 1) Amygdala (n = 152); 2) Anterior cingulate cortex (BA24) (n = 176); 3) Caudate (basal ganglia) (n = 246); 4) Cerebellar Hemisphere (n = 215); 5) Cerebellum (n = 241); 6) Cortex (n = 255); 7) Frontal Cortex (BA9) (n = 209); 8) Hippocampus (n = 197); 9) Hypothalamus (n = 202); 10) Nucleus accumbens (basal ganglia) (n = 246); 11) Putamen (basal ganglia) (n = 205); 12) Spinal cord (cervical c-1) (n = 159); 13) Substantia nigra (n = 139); 14) Colon – Sigmoid (n = 373); 15) Colon – Transverse (n = 406); 16) Lung (n = 578); 17) Small Intestine - Terminal Ileum (n = 187); 18) Testis (n = 361); 19) Whole Blood (n = 755). The line inside each box is the median, upper box border represents the 75th quartile, lower box border represents the 25th quartile and whiskers represent the range.
Figure 1.
Figure 1.. Immune checkpoint inhibitors (ICIs) do not increase the efficacy of ALK TKIs in ALK+ lung cancer mouse models.
(a) Representative H&E staining of hEML4-ALK rearranged lung tumor in hEML4-ALK transgenic (Tg; N=5 mice) mice (left panel) and adenovirus CRISPR/Cas9 system-induced mEml4-Alk rearrangement in vivo (Ad-EA mice, right panel) (N=5 mice). Scale bars indicate 100 μm. (b) Coronal T2-weighted MRI lung sections of a representative Ad-EA mouse enrolled in 15 days treatment of lorlatinib combined with anti-PD-1. Yellow arrows indicate tumor lesions. (c, d) Schematic representation of treatment protocol in hEML4-ALK Tg mice (c) and Ad-EA mice (d). (e, f, g) Quantification of volume changes compared with baseline tumor volume (change from baseline, % ± SEM) in hEML4-ALK Tg mice treated as in c at T0 (e), T4 (f), and T8 (g) (N=3 mice per group). (h, i, j) Quantification of volume changes compared with baseline tumor volume (change from baseline, % ± SEM) of Ad-EA mice treated as in d at T0 (h), T4 (i), and T8 (j) (n=4 mice per group. Pre: pre-treatment; T0: end of treatment; T4: 4 weeks after treatment suspension; T8: 8 weeks after treatment suspension. Each dot represents an individual mouse. n/s, not significant. All P values displayed were calculated using an Ordinary one-way Anova.
Figure 2.
Figure 2.. Identification of ALK immunogenic peptides in mouse models.
(a) IFN-γ-ELISPOT assay of splenocytes isolated from mice vaccinated with an ALK DNA vaccine as schematically represented in Extended Data Fig. 1g. Data from three technical replicates. Two independent biological experiments were performed. A cut-off value of 100 IFN-γ spot forming units (SFU) was applied to provide a threshold of responsiveness. One out of two independent experiments is shown. (b) IFN-γ ELISPOT analysis of splenocytes isolated from naïve and mice vaccinated with ALK-short peptide 7 (PGPGRVAKI) with CDN adjuvant. Data is shown as average number of spot forming units (SFU± SEM). Each dot represents a mouse (naïve N=5 mice; vaccinated N== 6 mice). (c) Representative PGPGRVAKI-specific dextramer staining of splenocytes from naïve and mice vaccinated with ALK-short peptide 7 (PGPGRVAKI). Cells were gated from viable CD8+ T-cells. (d) Quantification by dextramer staining of PGPGRVAKI-specific CD8+ T cells isolated from naïve and PGPGRVAKI-vaccinated mice splenocytes displayed as percentage (%± SEM). Each dot represents an individual mouse (naïve N=10 mice; vaccinated N= 5 mice) (unpaired two-tailed Student’s t test) ***P<0.001. (e) Quantification by dextramer staining of PGPGRVAKI-specific CD8+ T cells in splenocytes or lung tumor infiltrating T lymphocytes (TILs) from 12-week-old hEML4-ALK Tg mice displayed as percentage (%± SEM). Each dot represents a mouse (N=6 t mice per group).
Figure 3.
Figure 3.. Tumor localization dictates the strength of the anti-ALK spontaneous immune response and determines the response to ICIs.
(a) Eml4-AlkPGPGRVAKI−1 cells were injected subcutaneously in the flank of syngeneic BALB/c mice and spontaneous tumor growth was measured. Two independent experiments are shown (N=9 mice). (b) Eml4-AlkPGPGRVAKI−1 cells were injected as in a and mice treated as indicated with anti-PD1. Tumor growth was measured. Two independent experiments are shown (N=10 mice). (c-d) Eml4-AlkPGPGRVAKI−1 cells were injected as in a and mice treated as indicated (N=11 mice). Tumor-free mice were subcutaneously rechallenged at day 50 after initial tumor injection with either mEml4-Alk (N=5 mice) orEml4-AlkPGPGRVAKI−1 cells (N=5 mice) and tumor volume monitored. (e) Kaplan-Meier curves showing overall survival of mice described in a-d (non-significant, P=0.1091; P=0.0880; ****P<0.001 by Log-rank test). Rechallenged mice are not shown. (f) Kaplan-Meier curves showing overall survival of mice subjected to tumor rechallenge through intravenous injection with either mEml4-Alk or Eml4-AlkPGPGRVAKI−1 cells at day 100 post initial challenge (**P<0.01 by Log-rank test). (g) Representative H&E staining of lung adenocarcinomas from BALB/c mice injected intravenously with Eml4-AlkPGPGRVAKI−1 cell line and treated as indicated (N=4 mice per group). Black arrows indicate lung tumors. Scale bars indicate 1.5mm. (h) Kaplan-Meier curves showing overall survival of mice described in g (not significant, P=0.5395 by Log-rank test) (Untreated, N=4 mice; anti-PD-1, N=7 mice; anti-CTLA-4; n=7 mice; combo, N=7 mice). (i) IFN-γ-ELISPOT analysis of isolated splenocytes after 15 days post subcutaneous (flank) and intravenous (lung) injection of mice treated as in e and h. Data is shown as average number of spot forming units (SFU± SEM). Each dot represents a mouse (N=4 mice per group). Statistics were performed by unpaired two-tailed Student’s t test (not significant: P=0.0587; P=0.0665; *P=0.0134; *P=0.0301). (j) Dextramer staining PGPGRVAKI-specific CD8+ T-cells isolated splenocytes after 15 days post subcutaneous (flank; N=6 mice per group) and intravenous (lung; N=4 mice per group) injection of mice treated as in e and i. Data is displayed as percentage (% ± SEM). Each dot represents a mouse. Statistics were performed by unpaired two-tailed Student’s t test (*P=0.022; *P=0.0162; *P=0.0113; ****P<0.0001).
Figure 4.
Figure 4.. Enhancement of the anti-ALK immune responses by vaccination leads to rejection of ALK+ lung tumors in combination with an ALK TKI.
(a) IFN-γ-ELISPOT analysis of isolated splenocytes from BALB/c mice intravenously injected with Eml4-AlkPGPGRVAKI−1 cells (N=21 mice) compared to tumor-free mice vaccinated with the ALK vaccine (N=6 mice). Naïve mice (N=5 mice) were used as negative control. Data is shown as average number of spot forming units (SFU± SEM). Each dot represents a mouse. Unpaired two-tailed Student’s t test, *P<0.05; ****P<0.0001. (b) Dextramer staining of PGPGRVAKI-specific CD8+ T-cells isolated from lung TILs of untreated lung tumor-bearing mice (N= 8 mice) and lung tumor-bearing mice vaccinated with PGPGRVAKI peptide with CDN adjuvant (N=6 mice) (% ± SEM). Unpaired two-tailed Student’s t test, **P<0.005. (c) PD-1 staining displayed as percentage (% ± SEM) within the CD8+/ALK-Dextramer+ populations isolated from lung TILs of untreated (N= 8 mice) and ALK vaccinated mice (N= 6 mice). Unpaired two-tailed Student’s t test, ***P<0.001. (d) Schematic representation of treatment protocol in therapeutic experiment to combine the ALK vaccine (PGPGRVAKI peptide with CDN adjuvant) with ALK TKI and ICIs. DIE, once a day. (e) Kaplan-Meier curves showing the overall survival of mice treated as indicated in d. Data are combined from two independent experiments. Log-rank test, **P<0.005; ***P<0.001; ****P<0.0001; n/s, not significant. (f) ALK-dextramer staining of PGPGRVAKI-specific CD8+ T cells isolated from the peripheral blood of surviving mice (for more than 250 days) from the experiment shown in e and rechallenged intravenously with Eml4-AlkPGPGRVAKI−1 cells. Each dot represents a mouse and data are displayed as percentage (% ± SEM; number of mice per group is shown in g). (g) Kaplan-Meier curves showing overall survival of mice rechallenged intravenously with Eml4-AlkPGPGRVAKI−1 cells as in f. Log-rank test, *P<0.05; **P<0.005; ***P<0.001.
Figure 5.
Figure 5.. ALK vaccine prevents metastatic spread to the central nervous system (CNS) in combination with an ALK TKI.
(a) Schematic representation of the metastatic assay to the CNS by intravenous injection of Eml4-AlkPGPGRVAKI−1 cells. (b) Representative H&E staining of the meninges and the brain tissue from BALB/c mice enrolled in the brain metastasis assay and treated as indicated. ALK vax: PGPGRVAKI peptide with CDN adjuvant. Lorlatinib and ICI were given as in Fig. 4d. Scale bars = 50μm. Number of mice per treatment group is shown in c. (c) Incidence of CNS metastases in mice treated with the indicated combination therapies. Number of mice per treatment group is shown on the graph.
Figure 6.
Figure 6.. Tumor escape in vaccinated mice is due to reversible MHC-I downregulation.
(a) Representative H&E staining of lung adenocarcinomas from syngeneic BALB/c mice treated as described in Fig. 4d. Black arrows indicate lung tumors (N=4 mice per group). Scale bars indicate 1.5mm. (b) H-2Dd staining by flow cytometry of cell lines isolated from lung tumors that escaped the indicated treatment displayed as mean fluorescence intensity (MFI) (± SEM) from mice described in Fig. 4d. Each dot represents a cell line isolated from a different tumor (Untreated, n= 20; Lorlatinib, n= 10; Lorlatinib + anti-PD-1, n=10; Lorlatinib + anti-CTLA-4, n= 7; Lorlatinib + ALK vax, n=30; Lorlatinib + ALK vax + anti-PD1, n= 17 biological independent ex vivo cell lines). Unpaired two-tailed Student’s t test, ****P<0.0001. (c) H-2Dd staining displayed as MFI of MHC-Ilow cell lines isolated from lung tumors that escaped the indicated treatment and treated for 24 hours with IFN-γ. Each dot represents a technical replicate and paired columns (±IFN-γ) represent individual cell lines (parental cell line; ex vivo cell lines isolated from mice treated with lorlatinib + ALK vax [N= 4 ex vivo cell lines], and treated with lorlatinib + ALK vax + anti-PD-1 [N=3 ex vivo cell lines]). (d-g) Growth curves of tumors generated by two independent MHC-Ihigh (d and e) and MHC-Ilow (f and g) cell lines that were injected subcutaneously into naïve BALB/c mice and treated as indicated. Each line represents a mouse. (h) H-2Dd staining of eight independent MHC-Ilow cell lines isolated from lung tumors that escaped the indicated treatment treated with a STING agonist (ADU-S100).
Figure 7.
Figure 7.. Identification of immunogenic ALK peptides in ALK+ NSCLC patients
(a) H&E stainings and immunohistochemistry for ALK and MHC-I expression from representative tumors from patients with ALK+ NSCLC (N= 10 patient samples). Scale bars = 100 μm. (b) Expression of human MHC-I and ALK in 10 treatment-naive tumors from patients with ALK+ NSCLC as determined by immunohistochemistry and H-score. H-score ≥200: high level of protein expression; H-score ≥100 and <200: intermediate level of protein expression; H-score <100: low level of protein expression. The ALK fusion variants, including EML4-ALK V1, V3, V5’, V7, are indicated for each case. (c) Poisson LC-DIAMS plots from pan-HLA immunoprecipitations of the ALK+ cell line NCI-H2228 (upper panel) and a lung tumor biopsy from a patient with ALK+ rearranged NSCLC (middle and lower panel). Poisson plots combine an extracted ion chromatogram (XIC) for the peptides’ precursor m/z (black trace) with an inverted, scaled Poisson chromatogram (blue trace). Peptide detection at an elution point is associated with coincident precursor and Poisson peaks, here marked by blue arrows. (d) Quantification of IFN-γ ELISPOT assays from splenocytes isolated from HLA-B*07:02 transgenic mice vaccinated with peptides IVRshort (N=6 mice) or IVRlong (N=6 mice) (upper panel) or RPRshort 9 (N=6 mice) or RPRlong (N=6 mice) (lower panel) with CDN adjuvant. Each bar represents spots forming units (SFU) obtained from splenocytes isolated from an individual mouse and stimulated with either the corresponding peptide (IVRCIGVSL or RPRSQPSSL) or the peptide solvent (H2O). Two independent experiments were performed. Data are represented as three technical replicates from one experiment. (e) Representative IFN-γ ELISPOT assay of CD8+ T cells isolated from patient #6 (Supplementary Table 10) and expanded in the presence of either IVRCIGVSL or RPRSQPSSL peptides with the protocol represented in Extended Data Fig. 9d. CD8+ T cells were incubated with autologous B cells (25.000 cells, ratio 1:1) that were pulsed with the indicated peptides. Unpulsed B cells (media) and B cells pulsed CEF-MHC Class I Control Peptide Pool “plus” (CEF+) were used respectively as negative and positive controls. Peptide IVRCIGVSL tested in 6 patients PBMCs (N=6); Peptide RPRSQPSSL tested in 8 patients PBMCs (N=8).
Figure 8.
Figure 8.. Lack of detectable toxicity of the ALK vaccine.
(a) Schematic representation of HLA-A*02:01 and HLA-B*07:02 transgenic mice vaccinated with with either AMLDLLHVA or IVRCIGVSL peptides, respectively, and CDN adjuvant. (b) Average mouse weight over time. Data are represented as mean ± SEM (Control, N= 6; HLA-A*02:01, N= 12; HLA-B*07:01, N=12 mice ). (c) Representative H&E and pan-HLA immunohistochemistry staining of the hypothalamus region from HLA-A*02:01 and HLA-B*07:02 transgenic mice vaccinated as in (a). 40x magnification. Scale bars = 100μm. (d) Quantitative analysis of infiltrating CD8+ T cells per high power field (HPF) in the hypothalamus region from HLA-A*02:01 (N=5 mice) and HLA-B*07:02 (N=5 mice) transgenic mice vaccinated as in a. Naïve mice (control, N=4 mice) were used as negative control. Data are represented as in average number of four high power field per mouse (% ± SEM). Unpaired two-tailed Student’s t test (not significant, P=0.1146, P=0.0703)

Comment in

Similar articles

Cited by

References

    1. Shaw AT et al. Ceritinib versus chemotherapy in patients with ALK-rearranged non-small-cell lung cancer previously given chemotherapy and crizotinib (ASCEND-5): a randomised, controlled, open-label, phase 3 trial. The Lancet. Oncology 18, 874–886, doi: 10.1016/S1470-2045(17)30339-X (2017). - DOI - PubMed
    1. Peters S et al. Alectinib versus Crizotinib in Untreated ALK-Positive Non-Small-Cell Lung Cancer. The New England journal of medicine 377, 829–838, doi: 10.1056/NEJMoa1704795 (2017). - DOI - PubMed
    1. Kwak EL et al. Anaplastic lymphoma kinase inhibition in non-small-cell lung cancer. The New England journal of medicine 363, 1693–1703, doi: 10.1056/NEJMoa1006448 (2010). - DOI - PMC - PubMed
    1. Shaw AT et al. First-Line Lorlatinib or Crizotinib in Advanced ALK-Positive Lung Cancer. The New England journal of medicine 383, 2018–2029, doi: 10.1056/NEJMoa2027187 (2020). - DOI - PubMed
    1. Camidge DR et al. Brigatinib versus Crizotinib in ALK-Positive Non-Small-Cell Lung Cancer. The New England journal of medicine 379, 2027–2039, doi: 10.1056/NEJMoa1810171 (2018). - DOI - PubMed

Methods-Only References

    1. Reynisson B, Alvarez B, Paul S, Peters B & Nielsen M NetMHCpan-4.1 and NetMHCIIpan-4.0: improved predictions of MHC antigen presentation by concurrent motif deconvolution and integration of MS MHC eluted ligand data. Nucleic acids research 48, W449–W454, doi: 10.1093/nar/gkaa379 (2020). - DOI - PMC - PubMed
    1. Andreatta M & Nielsen M Gapped sequence alignment using artificial neural networks: application to the MHC class I system. Bioinformatics 32, 511–517, doi: 10.1093/bioinformatics/btv639 (2016). - DOI - PMC - PubMed
    1. Voena C et al. Efficacy of a Cancer Vaccine against ALK-Rearranged Lung Tumors. Cancer immunology research 3, 1333–1343, doi: 10.1158/2326-6066.CIR-15-0089 (2015). - DOI - PMC - PubMed
    1. Liu H et al. Structure-based programming of lymph-node targeting in molecular vaccines. Nature 507, 519–522, doi: 10.1038/nature12978 (2014). - DOI - PMC - PubMed
    1. Schultze JL et al. Follicular lymphomas can be induced to present alloantigen efficiently: a conceptual model to improve their tumor immunogenicity. Proceedings of the National Academy of Sciences of the United States of America 92, 8200–8204, doi: 10.1073/pnas.92.18.8200 (1995). - DOI - PMC - PubMed

Publication types

MeSH terms