. 2024 Apr;42(4):617-627.
doi: 10.1038/s41587-023-01846-0. Epub 2023 Jul 10.

Whole-body cellular mapping in mouse using standard IgG antibodies

Affiliations

Whole-body cellular mapping in mouse using standard IgG antibodies

Hongcheng Mai et al. Nat Biotechnol. 2024 Apr.

Abstract

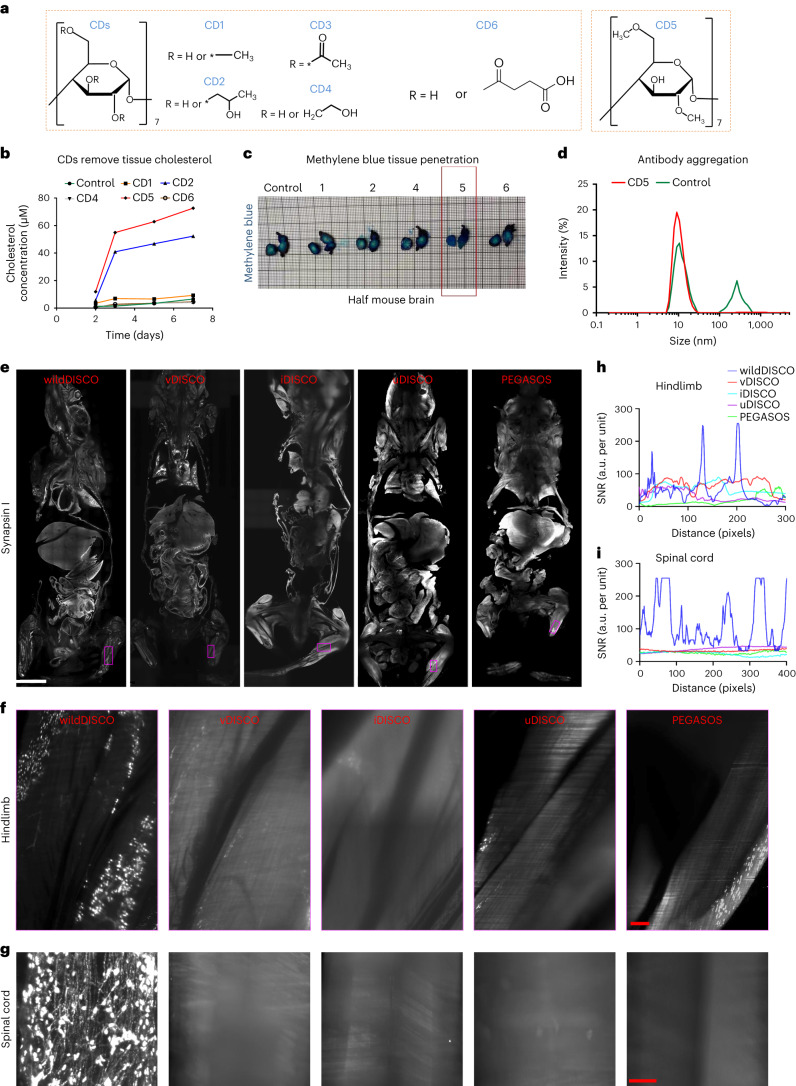
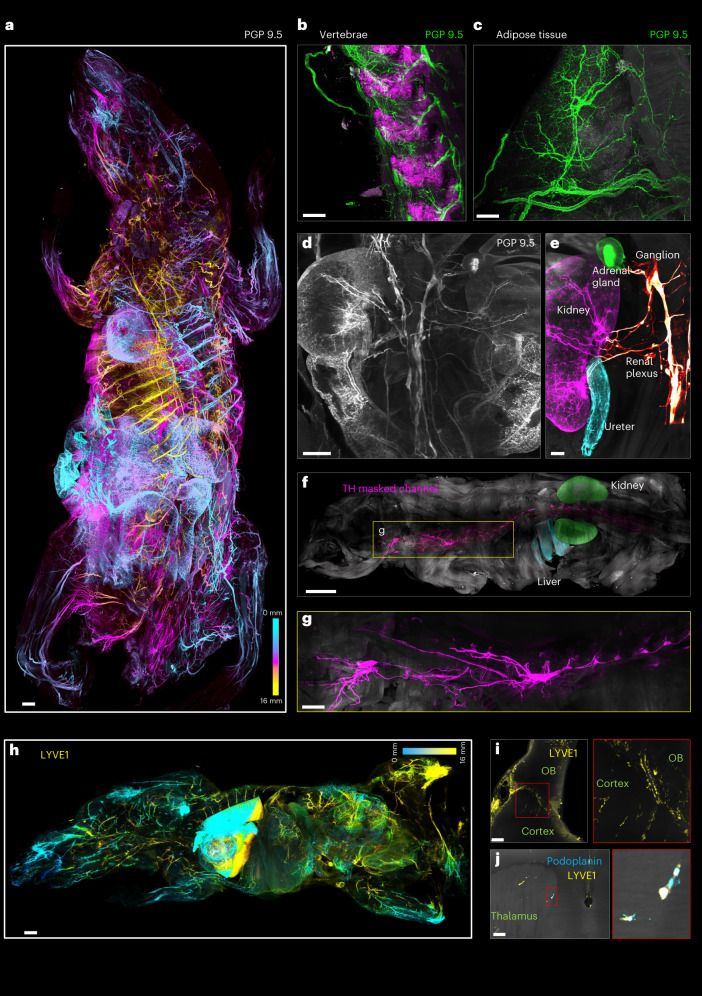
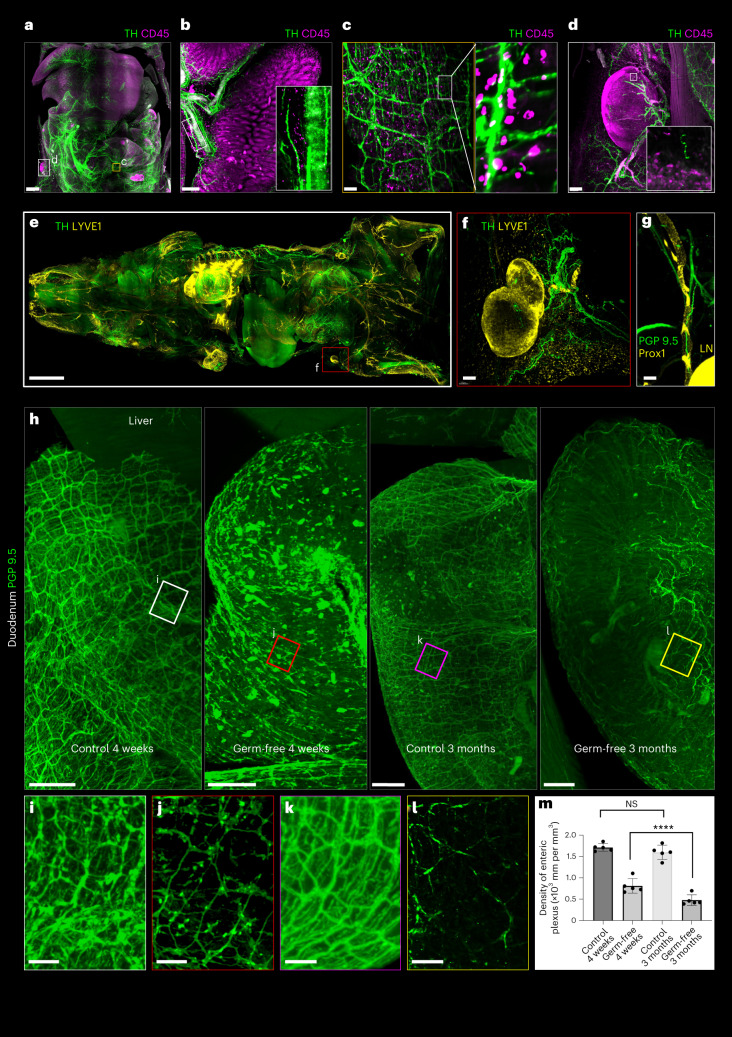
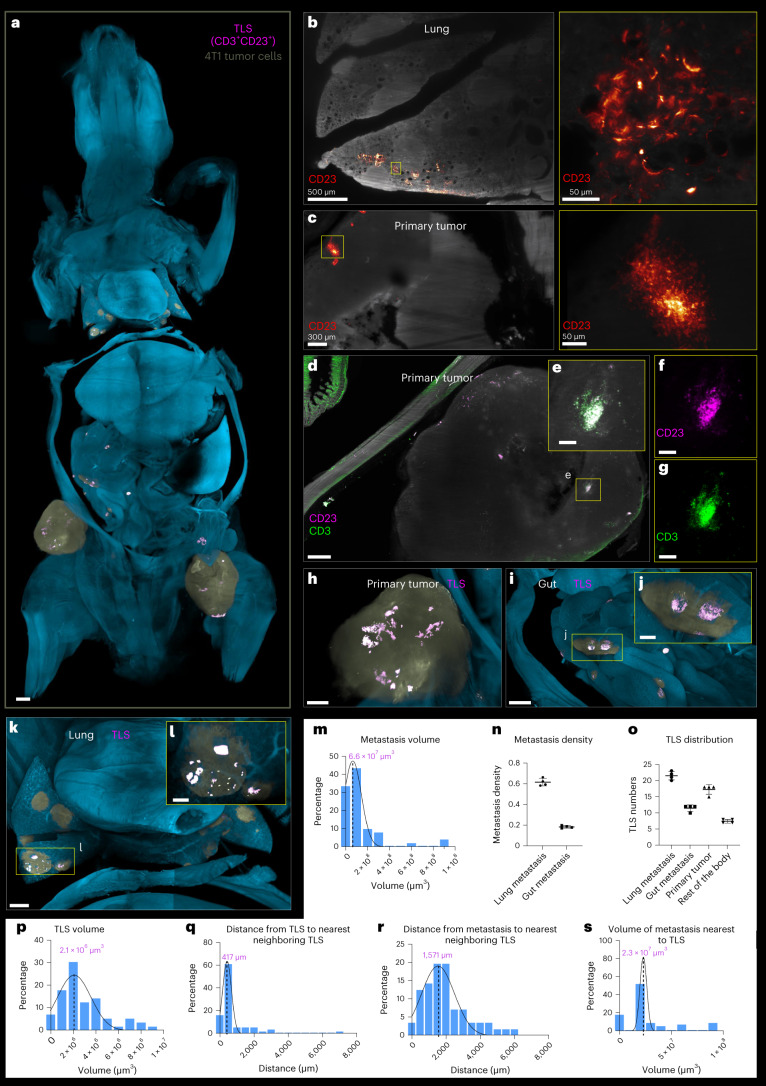
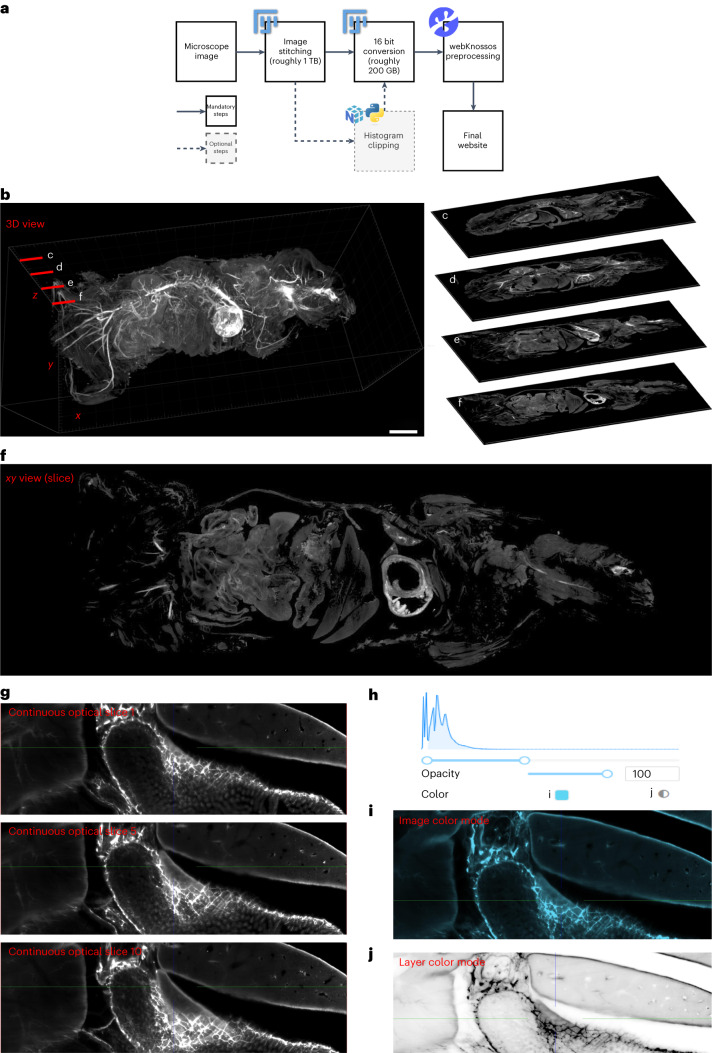
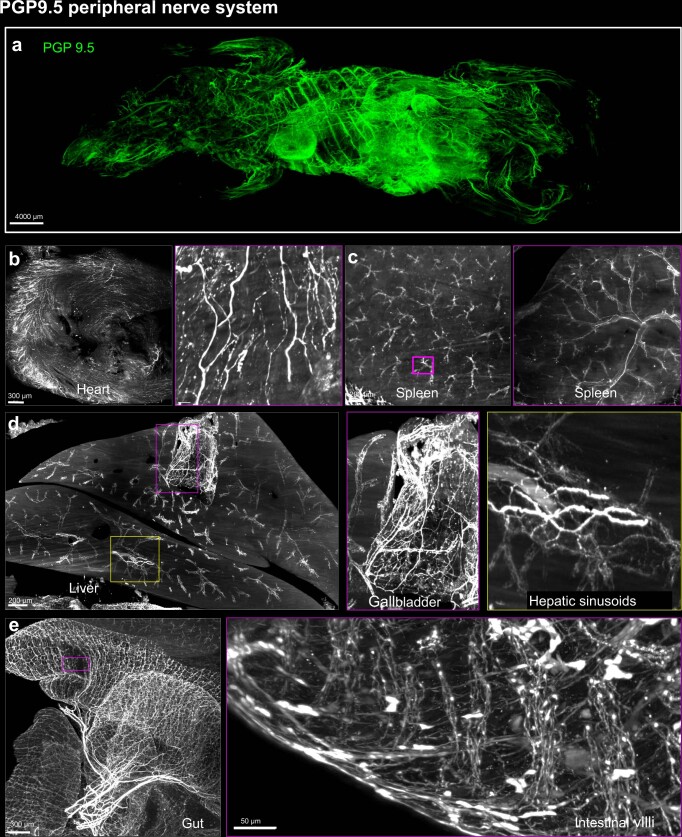
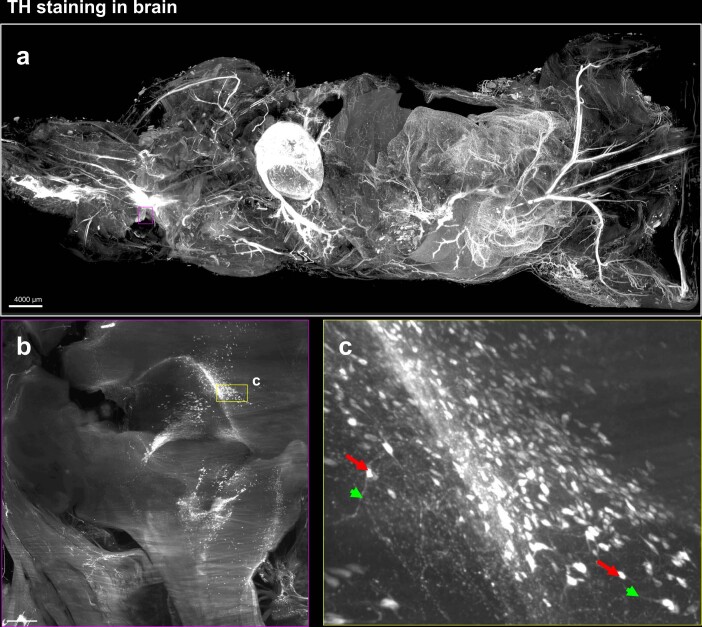
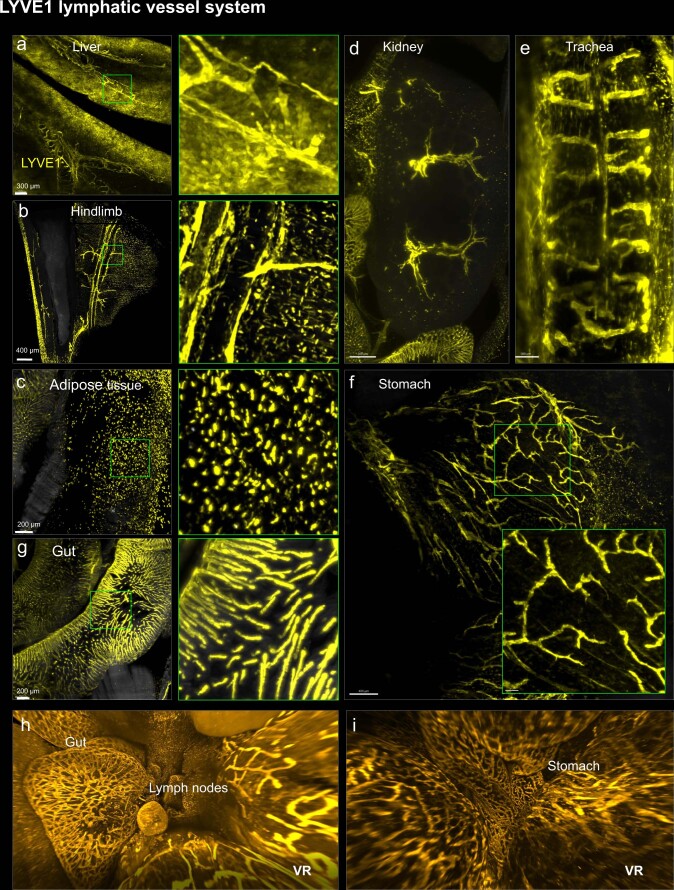
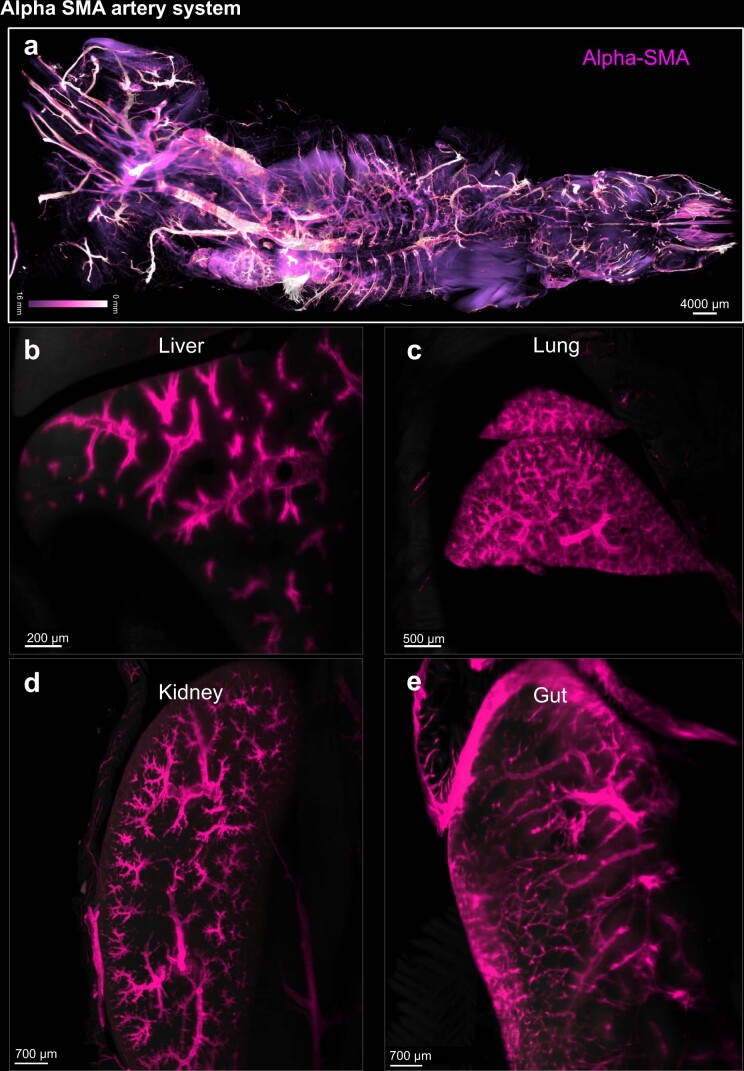
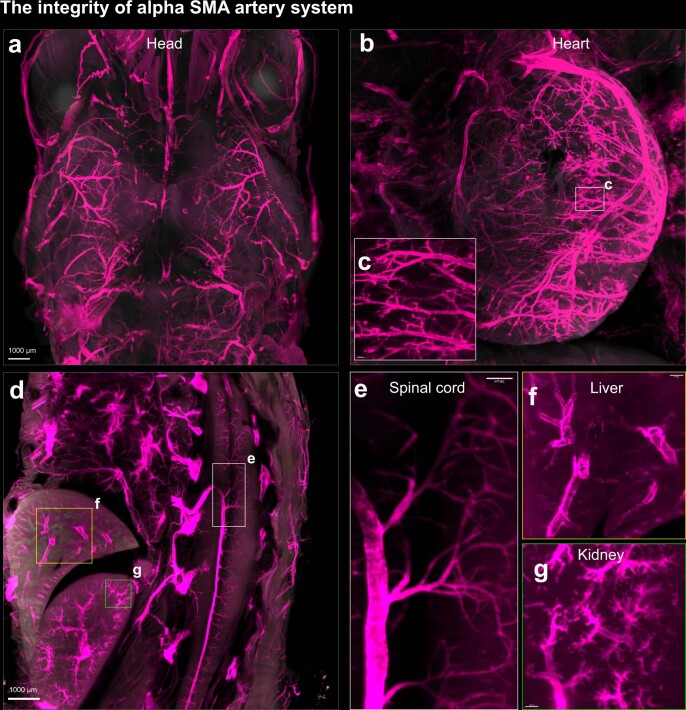
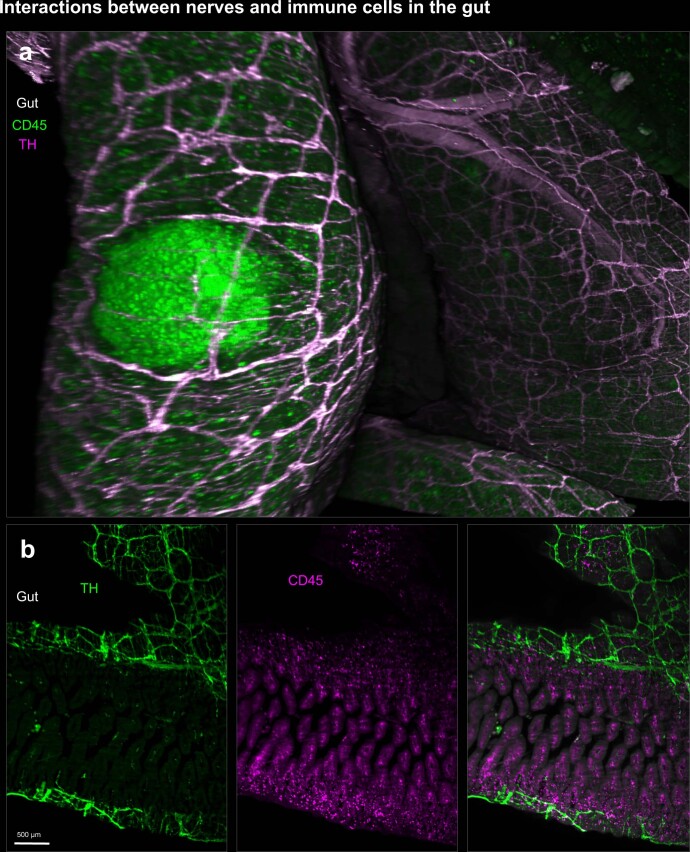
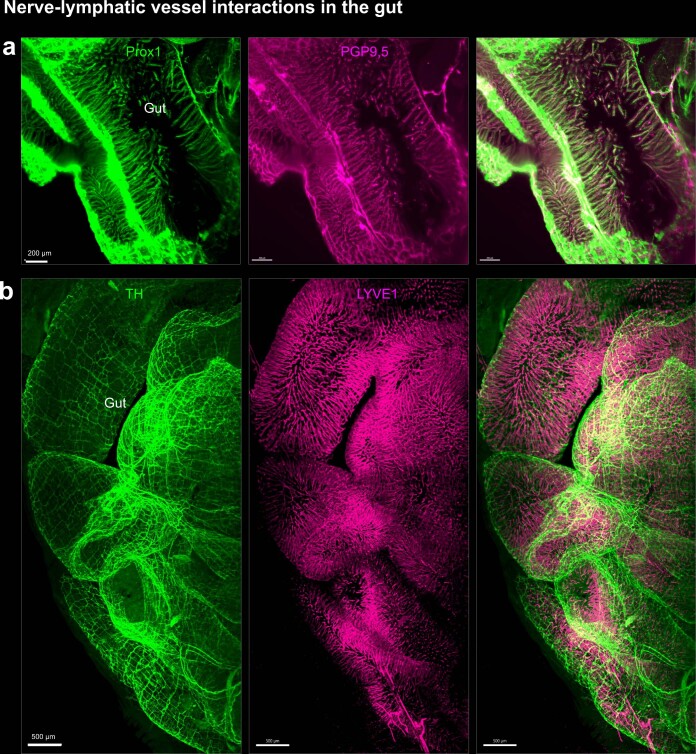
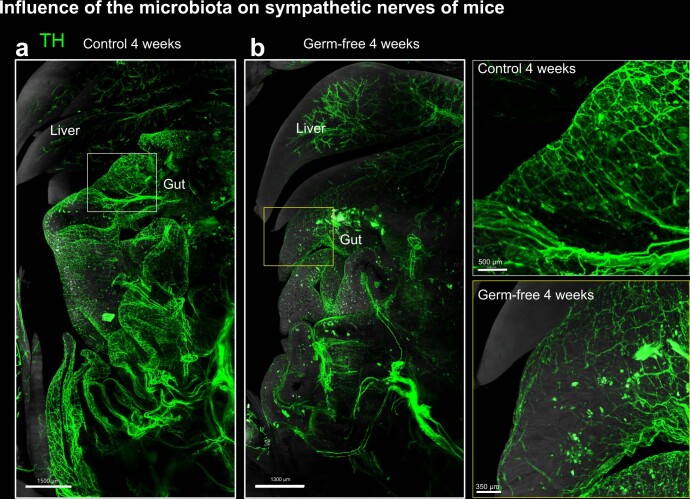
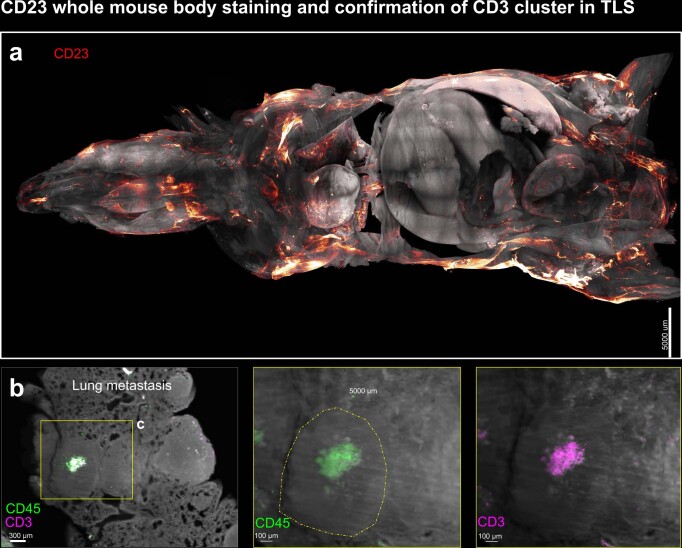
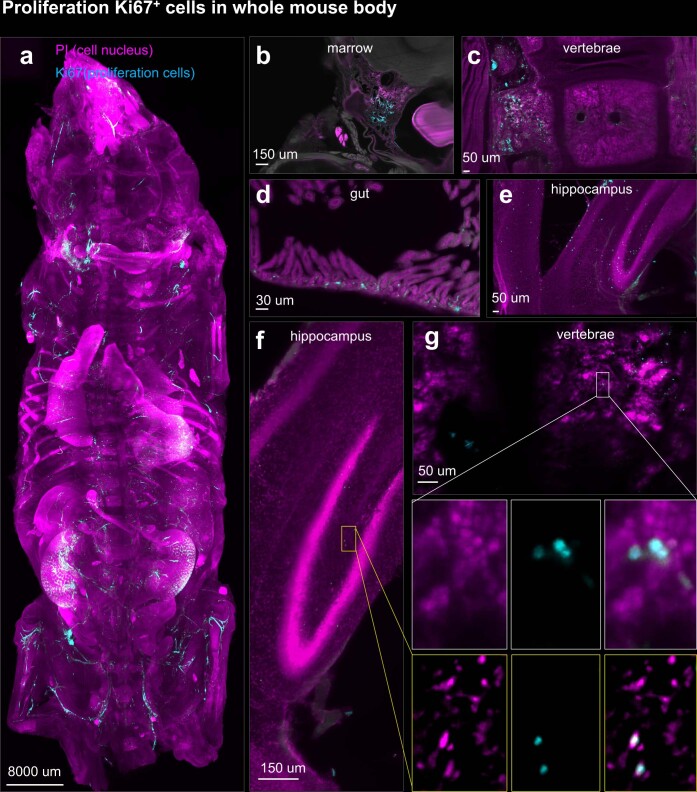
Whole-body imaging techniques play a vital role in exploring the interplay of physiological systems in maintaining health and driving disease. We introduce wildDISCO, a new approach for whole-body immunolabeling, optical clearing and imaging in mice, circumventing the need for transgenic reporter animals or nanobody labeling and so overcoming existing technical limitations. We identified heptakis(2,6-di-O-methyl)-β-cyclodextrin as a potent enhancer of cholesterol extraction and membrane permeabilization, enabling deep, homogeneous penetration of standard antibodies without aggregation. WildDISCO facilitates imaging of peripheral nervous systems, lymphatic vessels and immune cells in whole mice at cellular resolution by labeling diverse endogenous proteins. Additionally, we examined rare proliferating cells and the effects of biological perturbations, as demonstrated in germ-free mice. We applied wildDISCO to map tertiary lymphoid structures in the context of breast cancer, considering both primary tumor and metastases throughout the mouse body. An atlas of high-resolution images showcasing mouse nervous, lymphatic and vascular systems is accessible at http://discotechnologies.org/wildDISCO/atlas/index.php .


Conflict of interest statement

A.E., H.M. and J.L. are also employees of Deep Piction. A.E., H.M. and J.L. filed an intellectual property on technologies described here. The remaining authors declare no competing interests.

Figures

Fig. 1
Fig. 1. Exploring cyclodextrins as whole-body conventional IgG antibody staining chemicals and comparison of different clearing methods for whole mouse antibody staining.
a, The structure of cyclodextrin (CD) with different substituent groups: CD1 (methyl-β-cyclodextrin), CD2 (2-hydroxypropyl-β-cyclodextrin), CD3 (triacetyl-β-cyclodextrin), CD4 ((2-hydroxyethyl)-β-cyclodextrin), CD5 (heptakis(2,6-di-O-methyl)-β-cyclodextrin) and CD6 (succinyl-β-cyclodextrin). b, Measurements of supernatant cholesterol concentration after different CD-containing buffer incubation on the seventh day for 25 mg mouse liver sections. c, Methylene blue staining of a single hemisphere of mouse brains after permeabilization with different CD-containing solutions. CD5 is shown to greatly enhance tissue permeabilization compared to others. d, DLS for size distribution of TH antibody in solutions with and without CD5. ei, Comparison of different clearing methods for whole mouse body antibody staining. e, Optical 2D light-sheet microscopy images of the whole mouse body stained with synapsin 1 antibody by wildDISCO, vDISCO, iDISCO, uDISCO and PEGASOS methods, respectively. Scale bar, 5,000 μm. f,g, Representative 2D optical images of mouse hindlimb (f) and spinal cord (g) by wildDISCO, vDISCO, iDISCO, uDISCO and PEGASOS methods. Scale bars: f, 200 μm; g, 300 μm. n = 3. h,i, Quantification of antibody penetration depth into the hindlimb (h) and spinal cord (i) of mice by wildDISCO, vDISCO, iDISCO, uDISCO and PEGASOS methods. Source data
Fig. 2
Fig. 2. Comprehensive neuroanatomical and lymphatic mapping of the whole mouse body using wildDISCO.
a, Depth color coding shows the pan-neuronal marker PGP 9.5+ neuronal projections at different z levels in the 2.0 cm-thick whole mouse body. Scale bar, 2,000 μm. b,c, Details of innervation throughout hard (vertebrae) (b) and soft tissues (adipose tissue) (c). Scale bars, 200 μm. d, Optical 2D section showed the PGP 9.5+ nerve innervation into multiple organs. Scale bar, 1,200 μm. e, Segmented vagus nerves innervating the kidney (magenta), adrenal gland (green), ureter (cyan), highlighted with specific pseudo-colors. Scale bar, 800 μm. f, Tracing of the TH+ vagus nerve over several organs. A single traced vagus nerve masked in magenta from the bottom of the spinal cord to the neck, kidney masked in green and liver masked in cyan. Scale bar, 4,000 μm. g, Higher magnification of the trajectories of the vagus nerve in the mouse can be determined. Scale bar, 1,500 μm. h, A whole mouse stained with a lymphatic vessel marker LYVE1 (yellow). Scale bar, 2,000 μm. i, Lymphoid elements (LYVE1) staining was detected in the brain parenchyma of the mouse. Scale bar, 150 μm. j, Mouse brains stained with two different lymphatic vessel markers (LYVE1 and podoplanin) to identify lymphatic endothelial cells found in the brain regions. Scale bar, 100 μm. bj, n = 3.
Fig. 3
Fig. 3. Different physiological system staining using wildDISCO.
a, Maximum intensity projection of a mouse stained with antibodies against the TH (green) and the immune cell marker CD45 (magenta), showing the landscape of neuro-immune interactions in internal organs. Scale bar, 1,000 μm. b, The branches of the sympathetic nervous system (TH, green) connect different regions of the intestine. CD45+ cells (magenta) accumulate along parts of the sympathetic nerve, especially at the inferior mesenteric plexus. Scale bar, 200 μm. c, High-magnification views of the labeled regions in a, showing the colocalization of the sympathetic nerve fibers and immune cells on the intestinal wall. Scale bar, 200 μm. d, Representative 2D optical sections of peripheral nerves with immunomodulatory in lymph node (LN) stained with TH and CD45. Scale bar, 100 μm. e, Maximum intensity projections of a whole mouse stained with TH (green) and LYVE1 (yellow). Scale bar, 3,000 μm. f,g, Representative 2D optical sections of hindlimb LNs stained with TH and LYVE1 (f) and PGP 9.5 and Prox1 (g) as indicated in the images to show the LNs are innervated by peripheral nerves with immunomodulatory potential. Scale bars, 150 μm. h, 3D representation of the enteric nerve lattice network of wildtype mice and germ-free mice by immunostaining with antibodies against PGP 9.5. Scale bars, 500 μm. il, Higher-magnification views of the regions marked by the white (i), red (j), magenta (k) and yellow (l) boxes. Scale bars, 300 μm. al, n = 3. In the germ-free mice, the enteric nerve lattice network appears disorganized, with fewer ganglia. m, The density of the PGP 9.5 enteric plexus was quantified. n = 5; mean ± s.d.; ****P = 3.27 × 10−10, NS, P > 0.05 (one-way analysis of variance). Source data
Fig. 4
Fig. 4. Visualization and analysis of tumor-associated TLS in a tumor metastasis model using wildDISCO and Deep Learning.
a, 3D rendering of a mouse with 4T1 cell metastases using light-sheet microscopy imaging in ventral view. The TLS are detected and masked in magenta, the tumor cells masked in yellow and the background color is cyan. A higher magnification view shows details of the TLS. Scale bar, 2,000 μm. bl, Example images of TLS in a mouse with tumors, stained with CD23 in red (b,c) and CD3 in green and CD23 in magenta (dg). TLS masked in magenta in the primary tumor (h), gut (i,j) and lung (k,l). Scale bars: 500 μm (d,h,k); 150 μm (e,f,g,j); 400 μm (i) and 200 μm (l). ms, Quantification of the spatial correlation between TLS and metastases throughout the mouse. m, Quantification of the metastasis volume across the mouse. n, Quantification of the metastasis density in lung and gut. n = 4 mice. mean ± s.d. o, Quantification of the distribution of TLS throughout the mouse. n = 4 mice. mean ± s.d. p, Quantification of the TLS volume across the mouse. q,r, Quantification of the distance to nearest neighboring TLS (q), and between metastases and the nearest TLS (r). s, The metastasis volume to the nearest TLS. Source data
Fig. 5
Fig. 5. Whole mouse body atlas website and its features.
a, Flowchart outlining the process of creating a whole mouse atlas website. bf, The representative sections of a whole-body atlas in a 3D view. Scale bar, 5,000 μm (b). The images represent exemplary slices of an entire mouse taken at different depths and viewed from a dorsal perspective. For example, slices contain the spinal cord (c), the liver and the lung (d), the gut and the heart (e) and the spleen (f). g, Continued optical sections and a representative image of the continued view from slices 1 to 10. hj, Different display models. h, Opacity and color. i,j, Selection of cyan image in image color mode (i) and selection of monochrome image in layer color mode (j).
Extended Data Fig. 1
Extended Data Fig. 1. PGP9.5 peripheral nerve system.
wildDISCO immunostaining of PGP9.5 throughout the mouse body (a) Maximum projection of the peripheral nervous system of a 4-week-old mouse stained with PGP 9.5 antibody using light sheet microscopy. (b–e) Examples of positive PGP 9.5 staining in different organs (heart, spleen, liver, and intestine) with more magnified areas. n = 3.
Extended Data Fig. 2
Extended Data Fig. 2. TH staining in brain.
(a) Representative image of a 4-week-old mouse stained with TH antibody using lightsheet microscopy. (b–c) Examples of positive TH staining in the expected brain regions (b) with higher magnification areas showing TH-positive neuron axon (c), the red long arrow indicates neuron cell bodies, while the green short arrow indicates neuron filaments. n = 3.
Extended Data Fig. 3
Extended Data Fig. 3. LYVE1 lymphatic vessel system.
wildDISCO enables immunostaining of LYVE1 throughout the mouse body. Examples of optical sections of whole mouse staining with LYVE1 antibody in different organs, liver (a), hindlimbs (b), adipose tissue (c), kidney (d), trachea (e), stomach (f), and intestine (g) with higher magnified regions. (a-g), n = 3. (h-i) 3D reconstruction view of the intestinal lymphatic network using Syglass software.
Extended Data Fig. 4
Extended Data Fig. 4. alpha-SMA artery system.
(a) depth color map of the entire mouse body stained with alpha-SMA. Examples of optical sections of whole mouse staining with alpha-SMA antibody in different organs, liver (b), lung (c), kidney (d), and gut (e). n = 3.
Extended Data Fig. 5
Extended Data Fig. 5. The integrity of alpha SMA artery system.
(a) Examples of optical sections of whole mice stained with alpha-SMA to show the integrity of the vasculature in various organs: head (a), heart (b), higher magnification of heart regions (c), multiple connected internal organs (d) with higher magnification regions: spinal cord (e), liver (f), and kidney (g). n = 3.
Extended Data Fig. 6
Extended Data Fig. 6. Interactions between nerves and immune cells in the gut.
(a) 3D reconstruction view of a Peyer’s patch in the gut stained with CD45 (green) and innervated by TH + sympathetic nerve (magenta) visualized with Syglass software. (b) Sympathetic nerve marker TH (green) and immune cell marker CD45 (magenta) on the intestinal wall visualized with Imaris software.
Extended Data Fig. 7
Extended Data Fig. 7. Nerve-lymphatic vessel interactions in the gut.
(a) PGP9.5 nerve fibers (magenta) interacted with Prox1 lymphatic vessel (green). (b) TH sympathetic nerve (green) and LYVE1 lymphatic vessel (magenta). n = 3.
Extended Data Fig. 8
Extended Data Fig. 8. Influence of the microbiota on sympathetic nerves of mice.
(a–b) The enteric nerve lattice network of WT mice and germ-free mice by immunostaining with antibodies against TH. Higher magnification views of the regions marked by the white and yellow boxes, respectively. n = 3.
Extended Data Fig. 9
Extended Data Fig. 9. CD23 whole mouse body staining and confirmation of CD3 cluster in TLS structure.
(a) wildDISCO immunostaining of mature TLS marker CD23 in the whole mouse body of 4T1 cancer metastasis. (b) Representative 2D optical image of lung metastasis with immune cell marker CD45 in red and T cell marker CD3 in magenta to confirm TLS structure. n = 3.
Extended Data Fig. 10
Extended Data Fig. 10. Proliferation Ki67+ cells in whole mouse body.
(a) wildDISCO immunostaining of cell proliferation marker Ki67 (cyan) and PI (magenta) in the whole mouse. (b) Representative 2D optical image of Ki67-positive proliferation cells (cyan) as rare cells compared to nuclear staining (propidium iodide, PI) in the bone marrow (b), vertebrate (c), gut (d) and hippocampus (e). (f–g) Single proliferation cells identified in brain (f) and vertebrate (g) by whole-body light-sheet microscopy scans. Higher magnification images show colocalization of proliferation cells with a single nucleus. n = 3.

References

    1. Richardson DS, et al. Tissue clearing. Nat. Rev. Meth. Primers. 2021;1:85. doi: 10.1038/s43586-021-00080-9. - DOI - PMC - PubMed
    1. Ueda HR, et al. Tissue clearing and its applications in neuroscience. Nat. Rev. Neurosci. 2020;21:61–79. doi: 10.1038/s41583-019-0250-1. - DOI - PubMed
    1. Chung K, et al. Structural and molecular interrogation of intact biological systems. Nature. 2013;497:332–337. doi: 10.1038/nature12107. - DOI - PMC - PubMed
    1. Livet J, et al. Transgenic strategies for combinatorial expression of fluorescent proteins in the nervous system. Nature. 2007;450:56–62. doi: 10.1038/nature06293. - DOI - PubMed
    1. Cai R, et al. Panoptic imaging of transparent mice reveals whole-body neuronal projections and skull–meninges connections. Nat. Neurosci. 2019;22:317–327. doi: 10.1038/s41593-018-0301-3. - DOI - PMC - PubMed

Substances