. 2023 Aug;55(8):1370-1380.
doi: 10.1038/s41588-023-01442-7. Epub 2023 Jul 10.

RNA polymerase II dynamics shape enhancer-promoter interactions

Affiliations

RNA polymerase II dynamics shape enhancer-promoter interactions

Gilad Barshad et al. Nat Genet. 2023 Aug.

Abstract

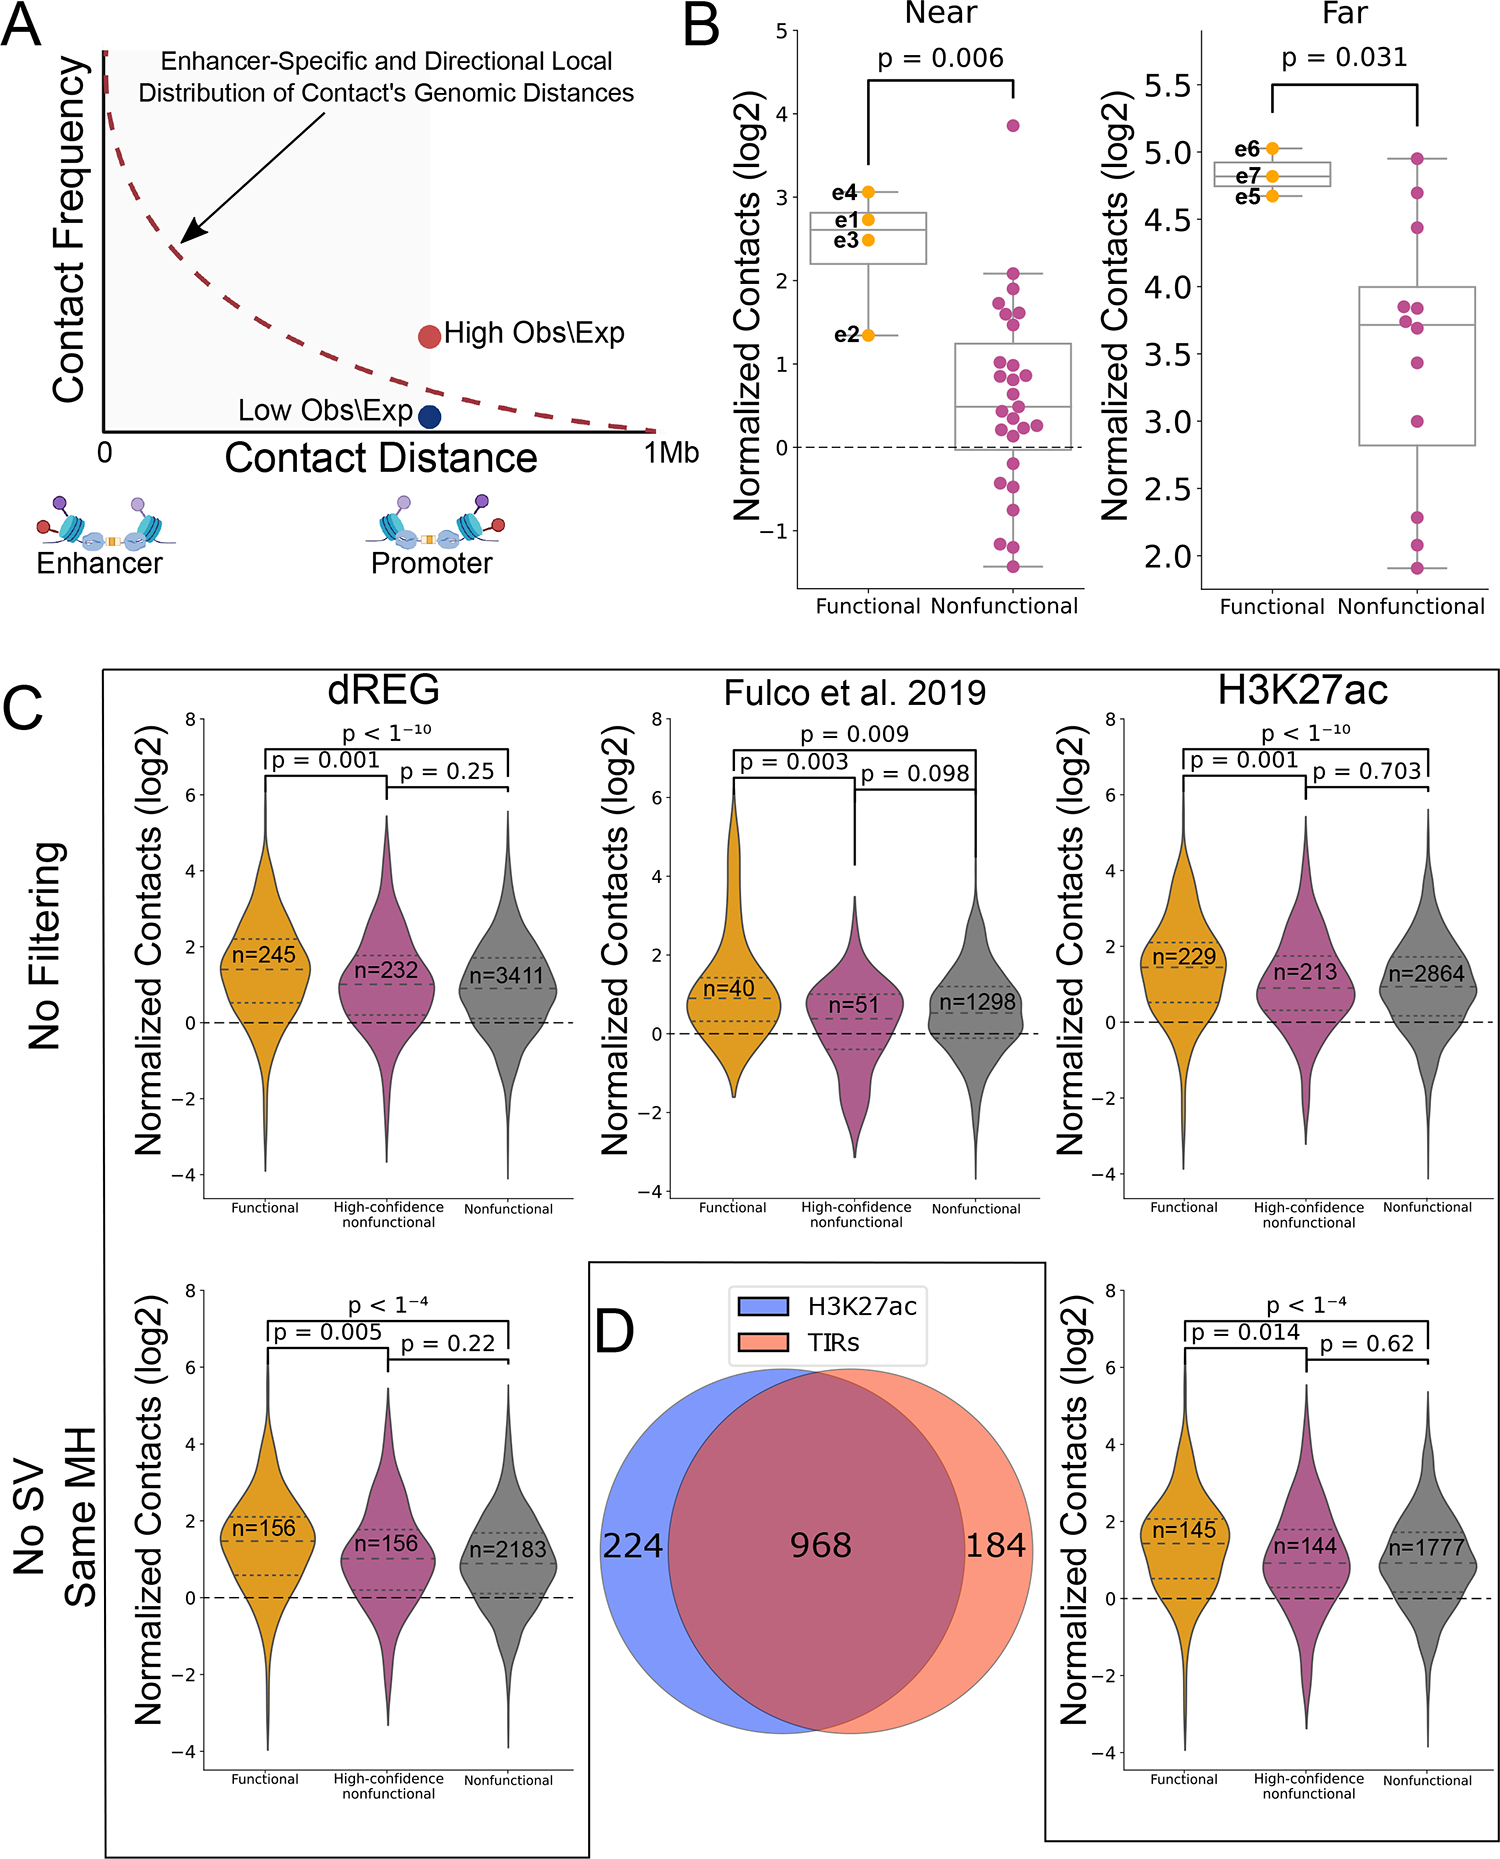
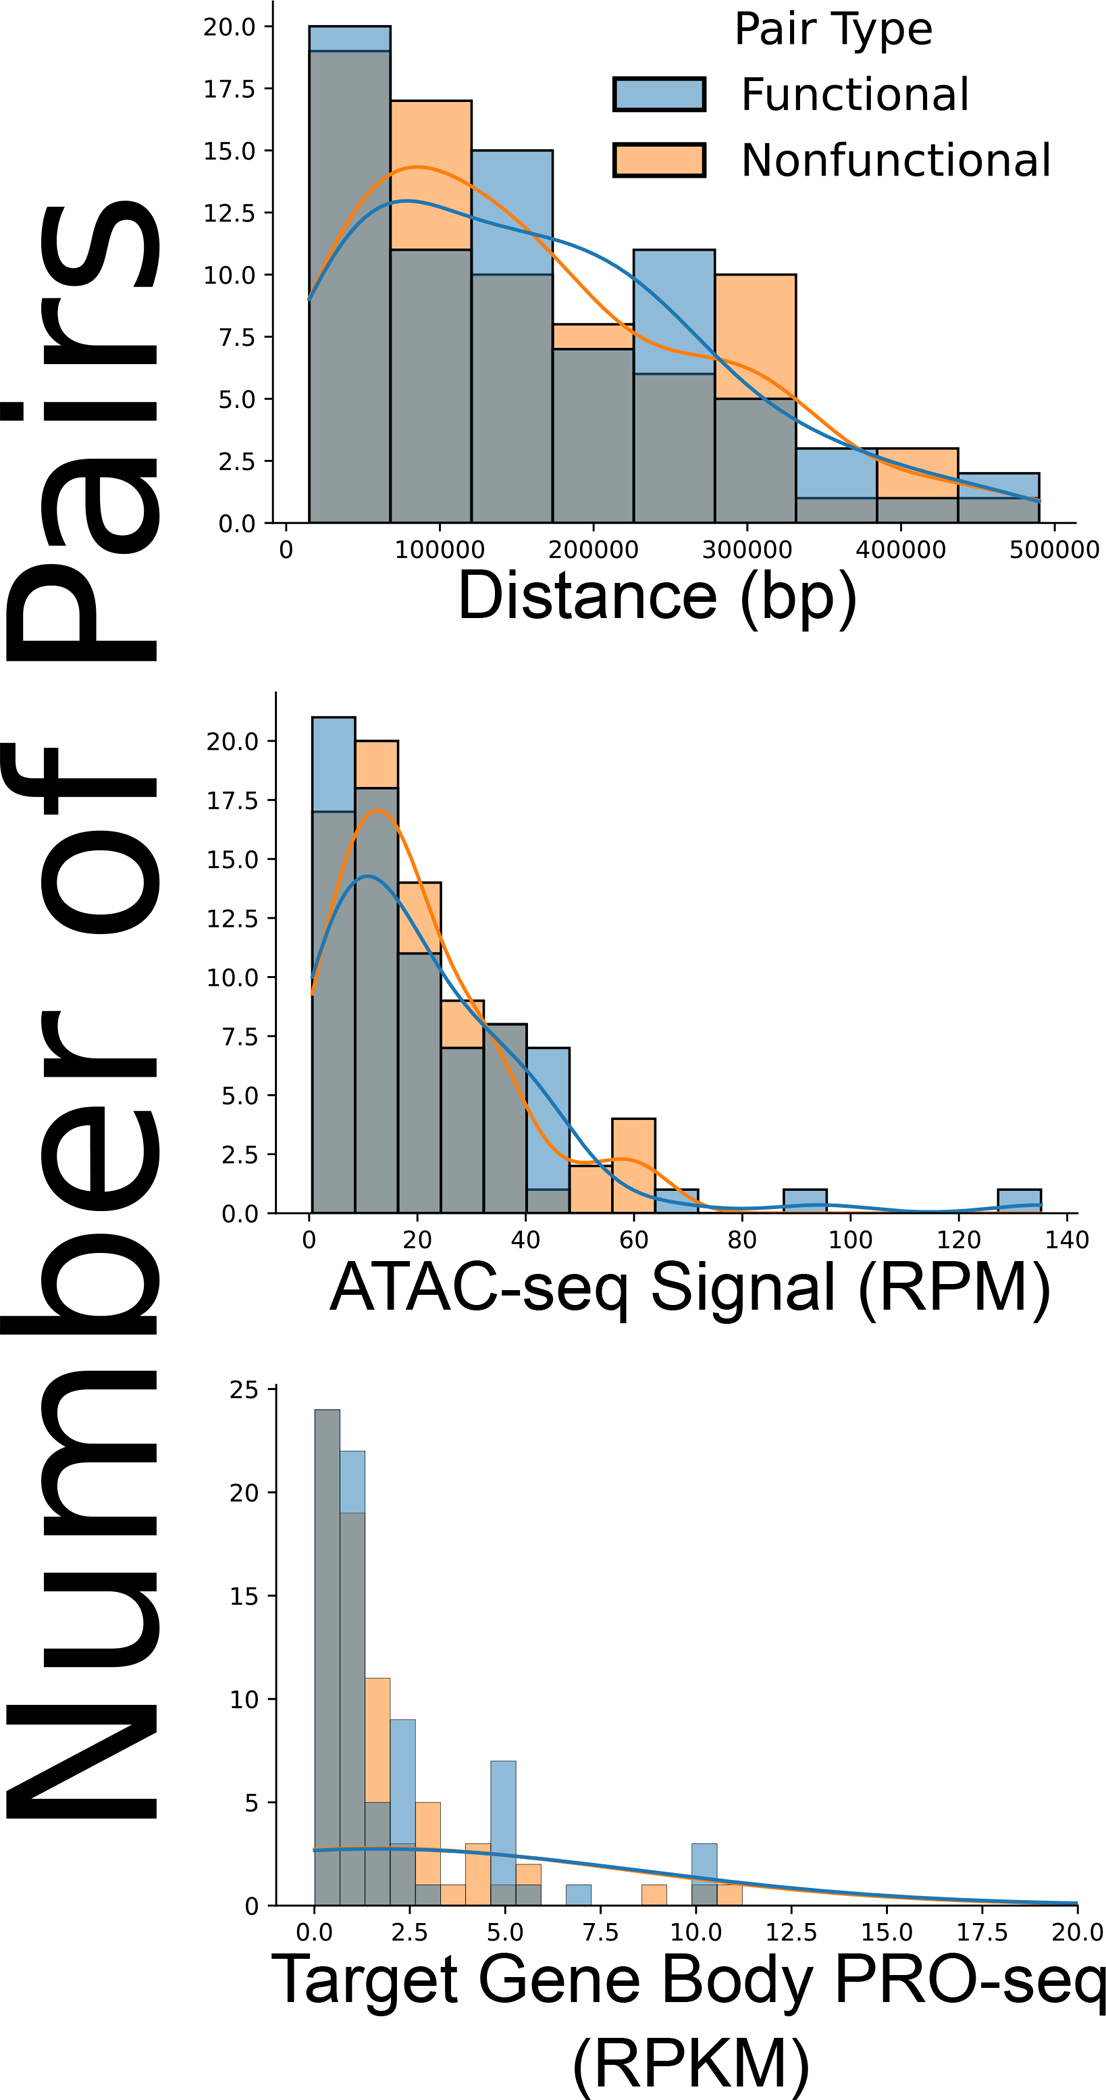
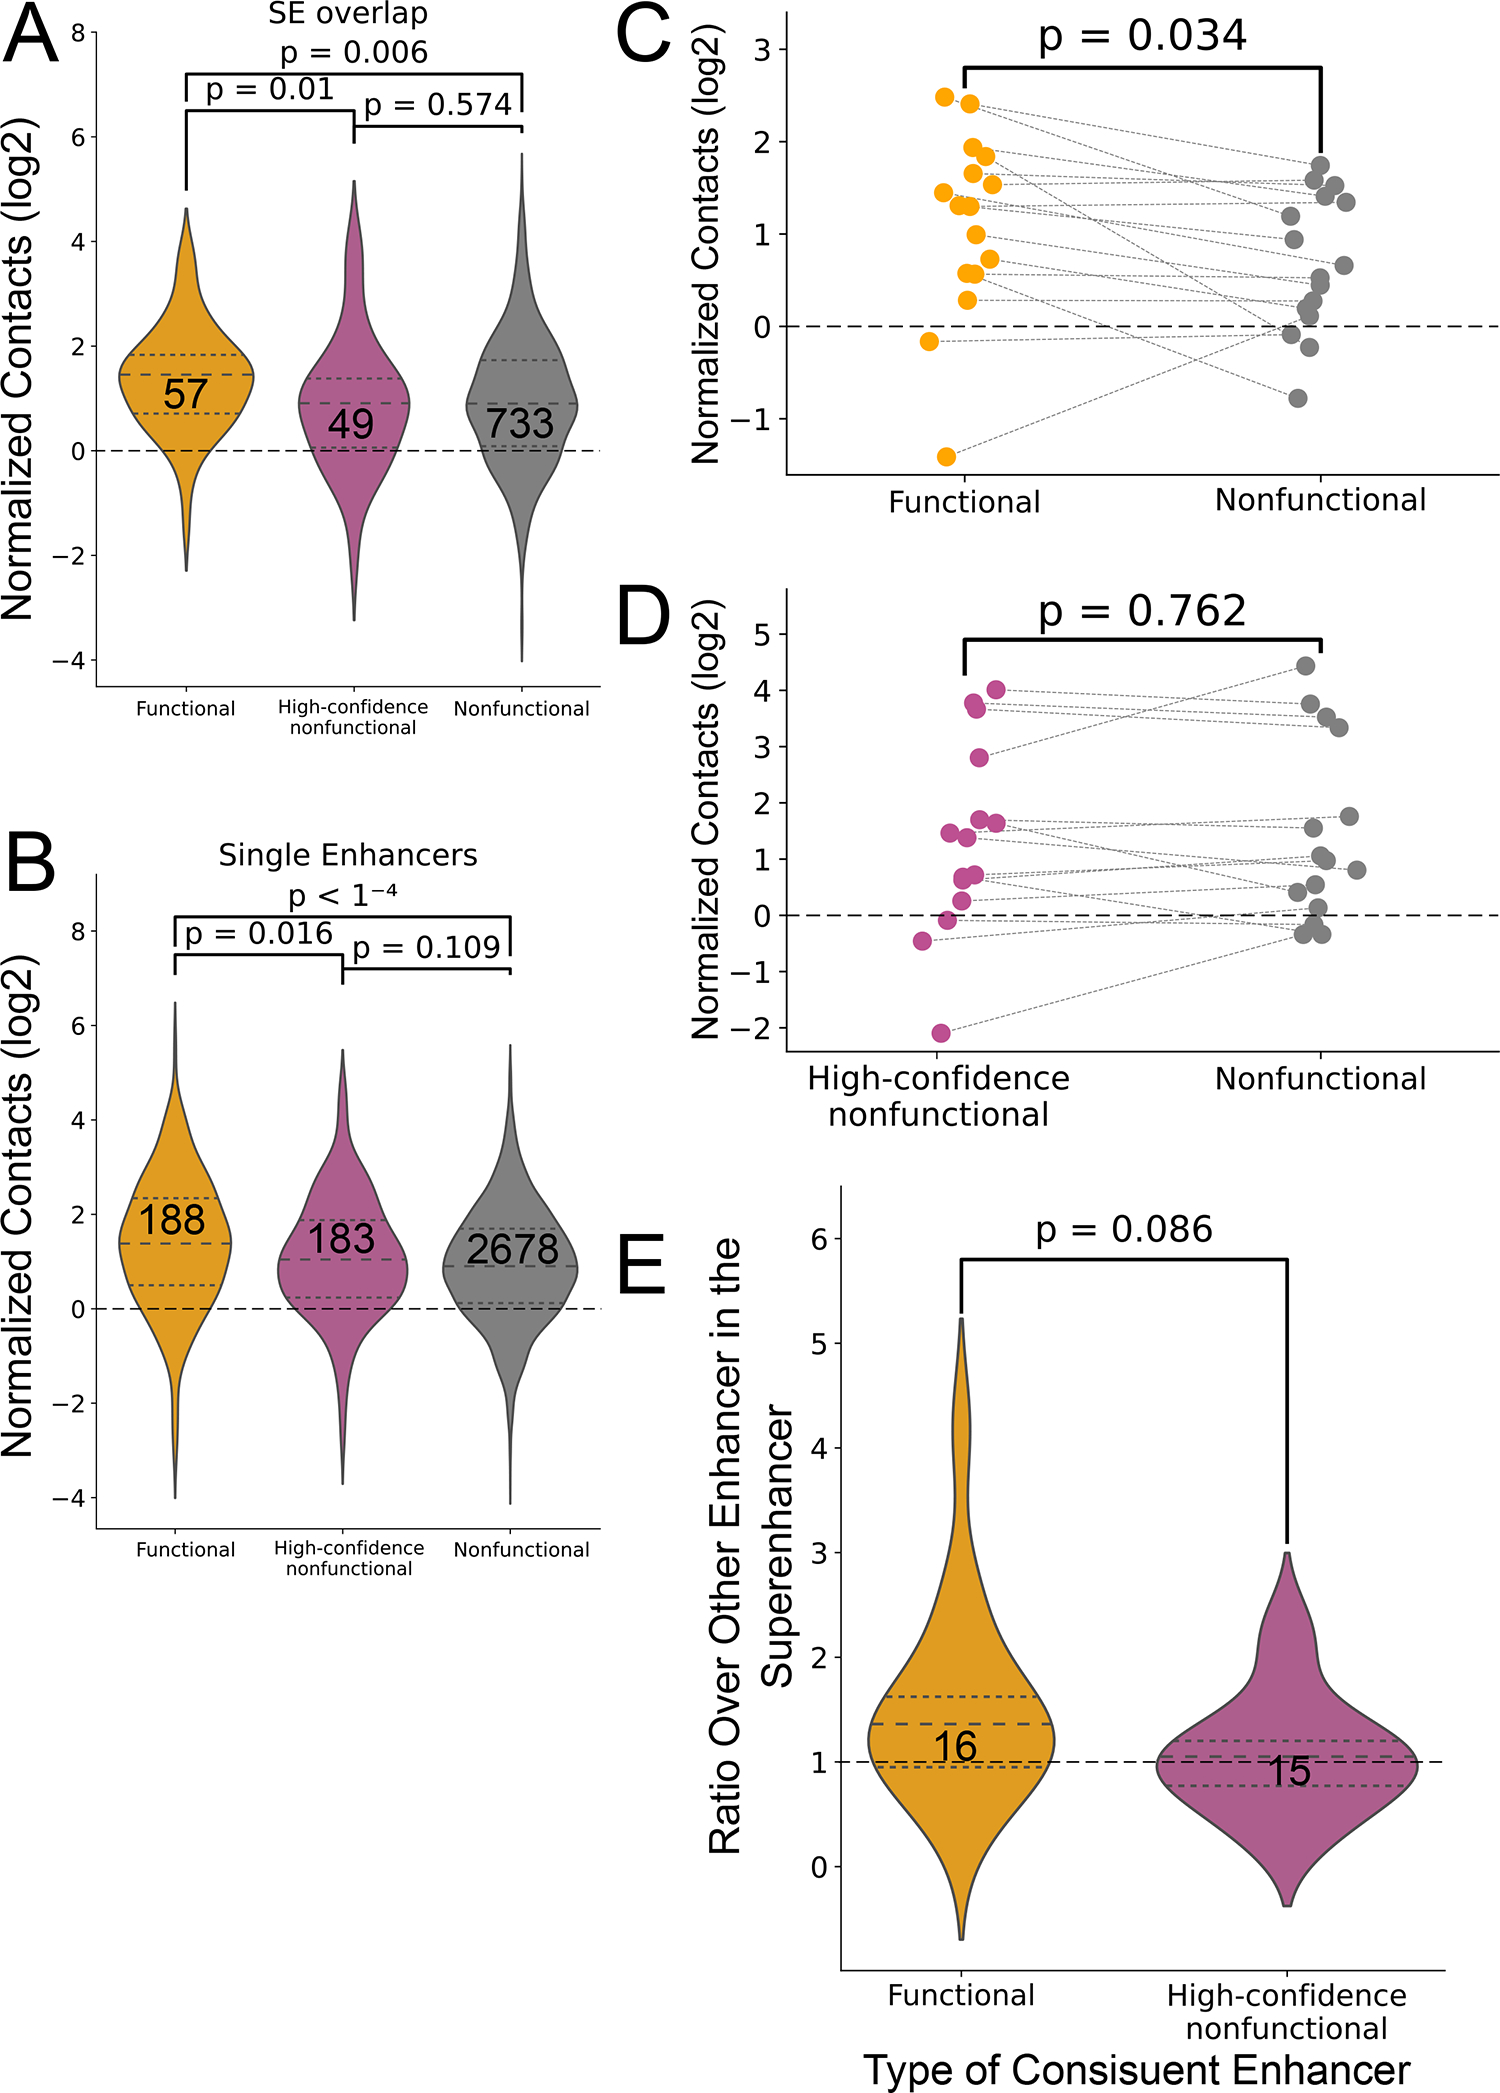
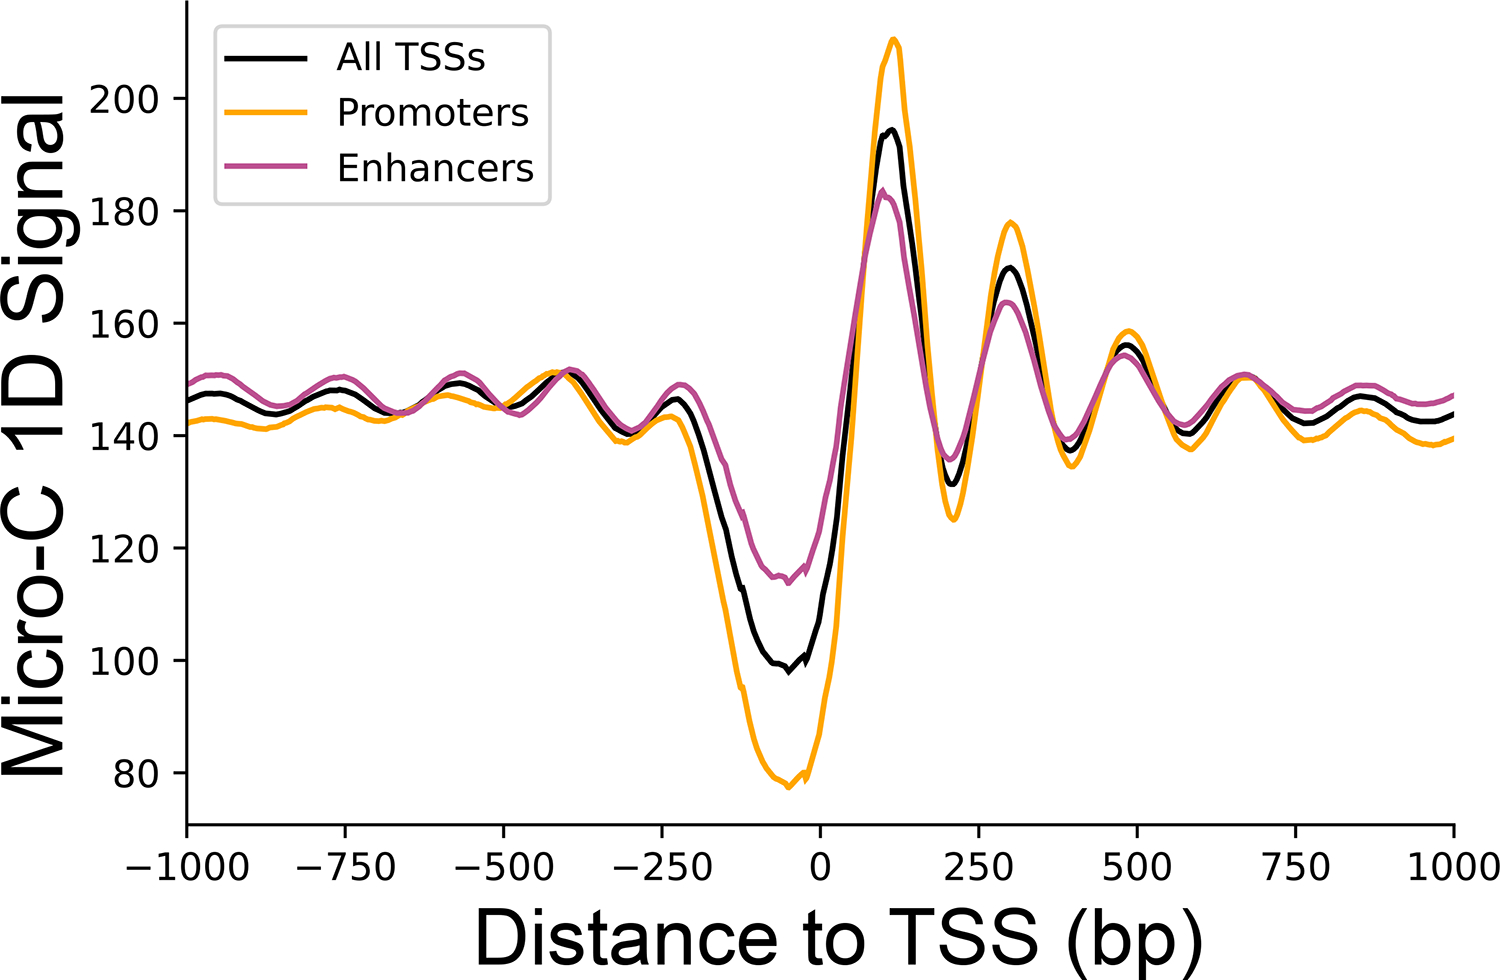
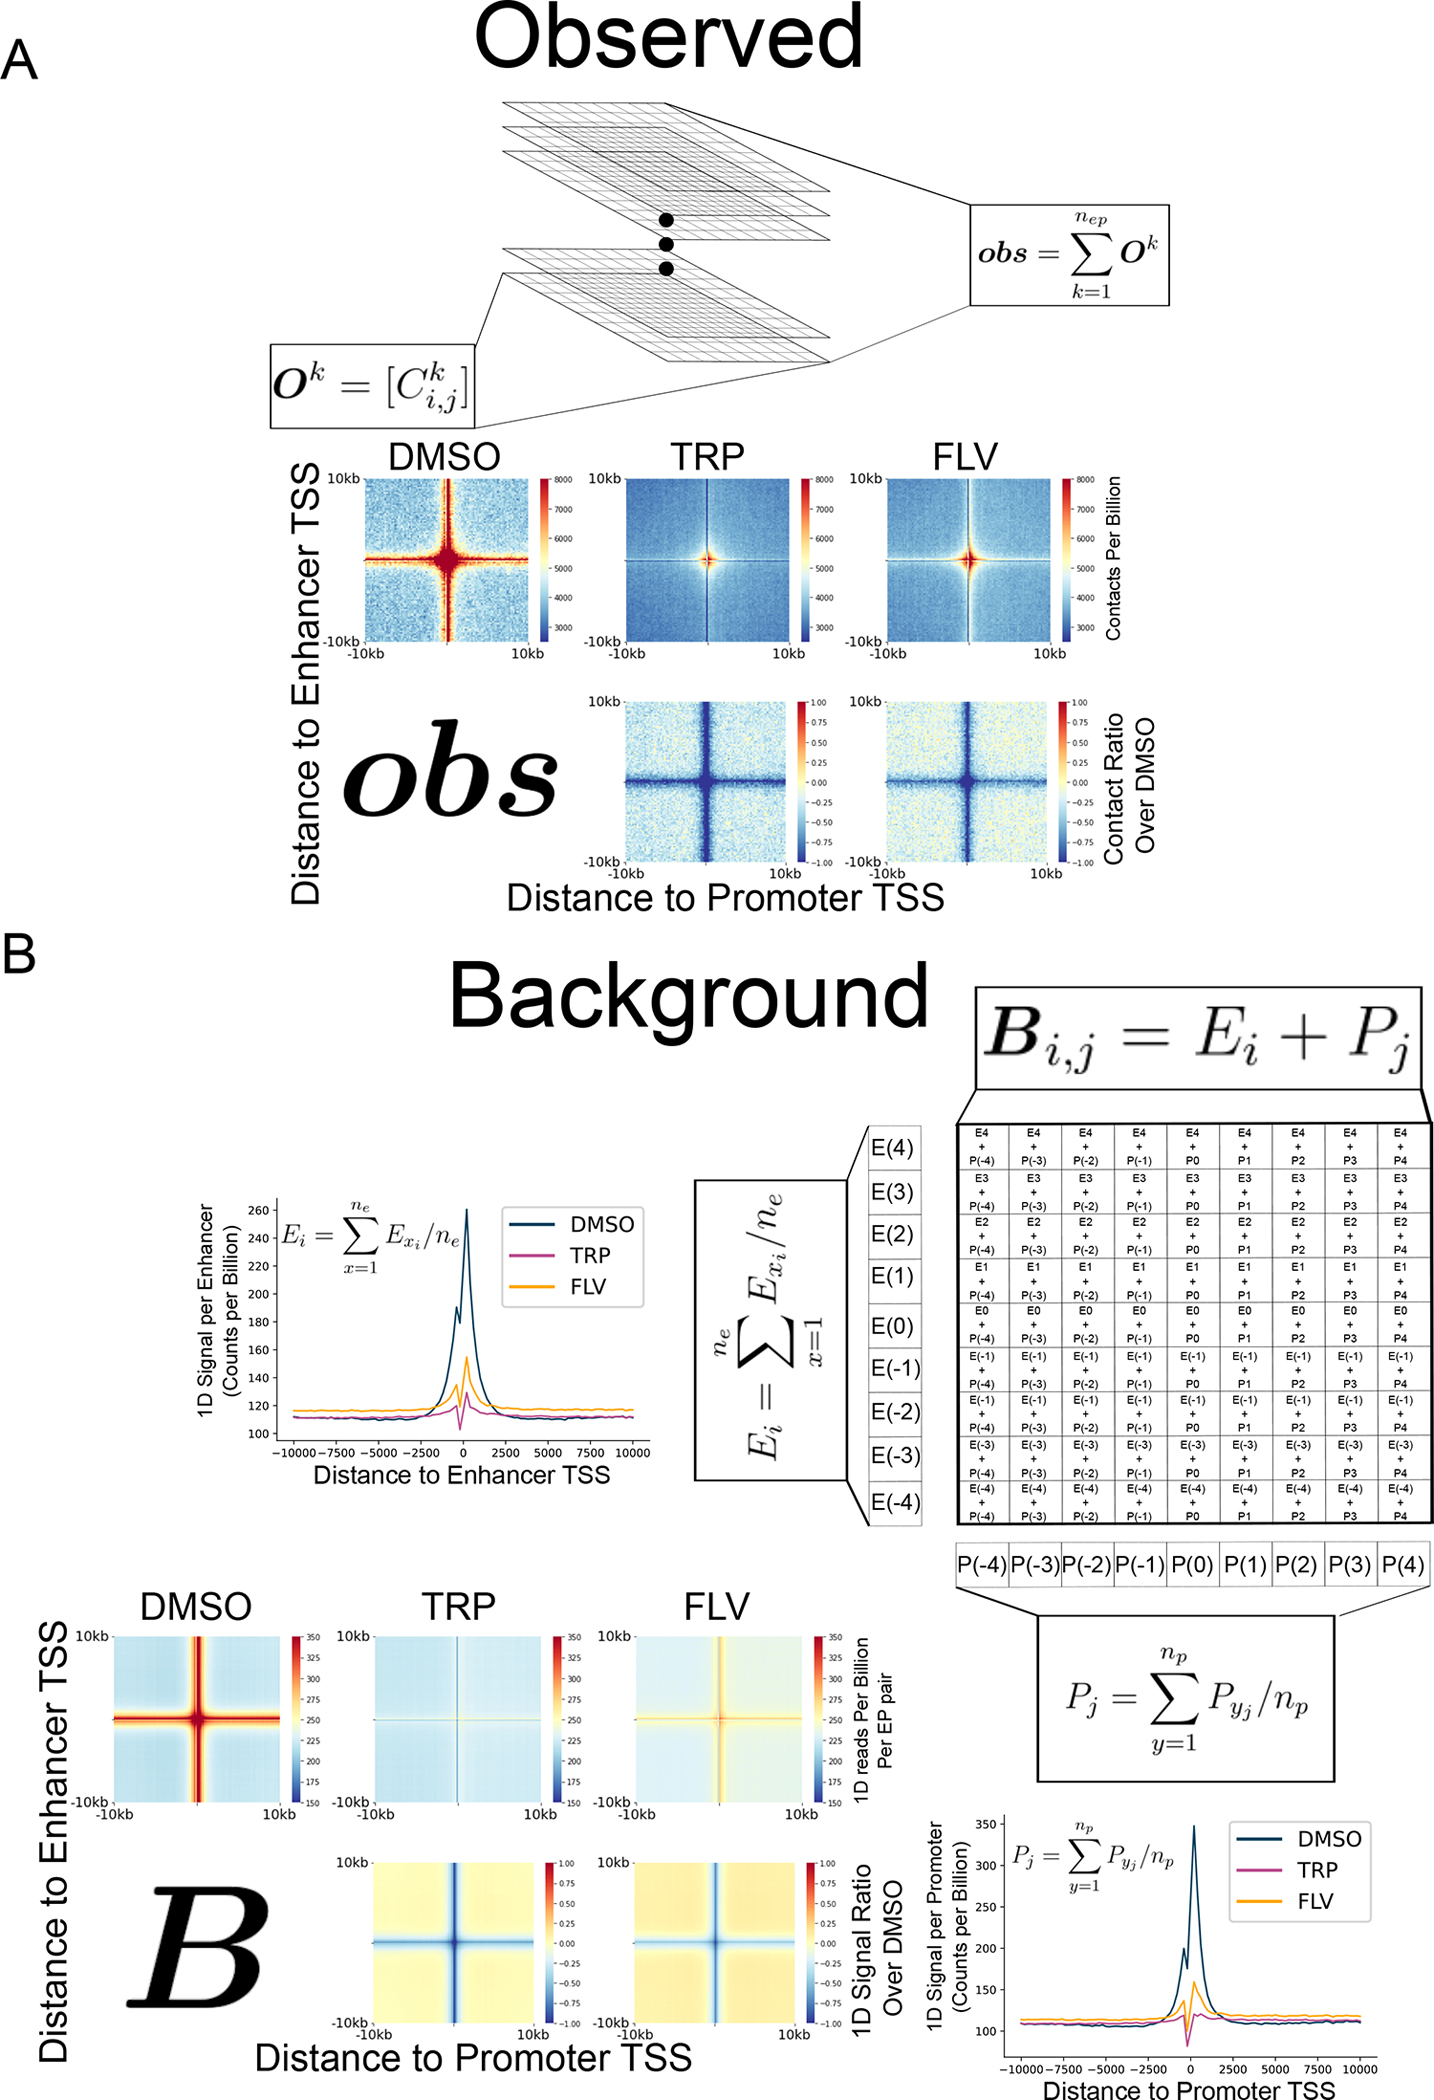
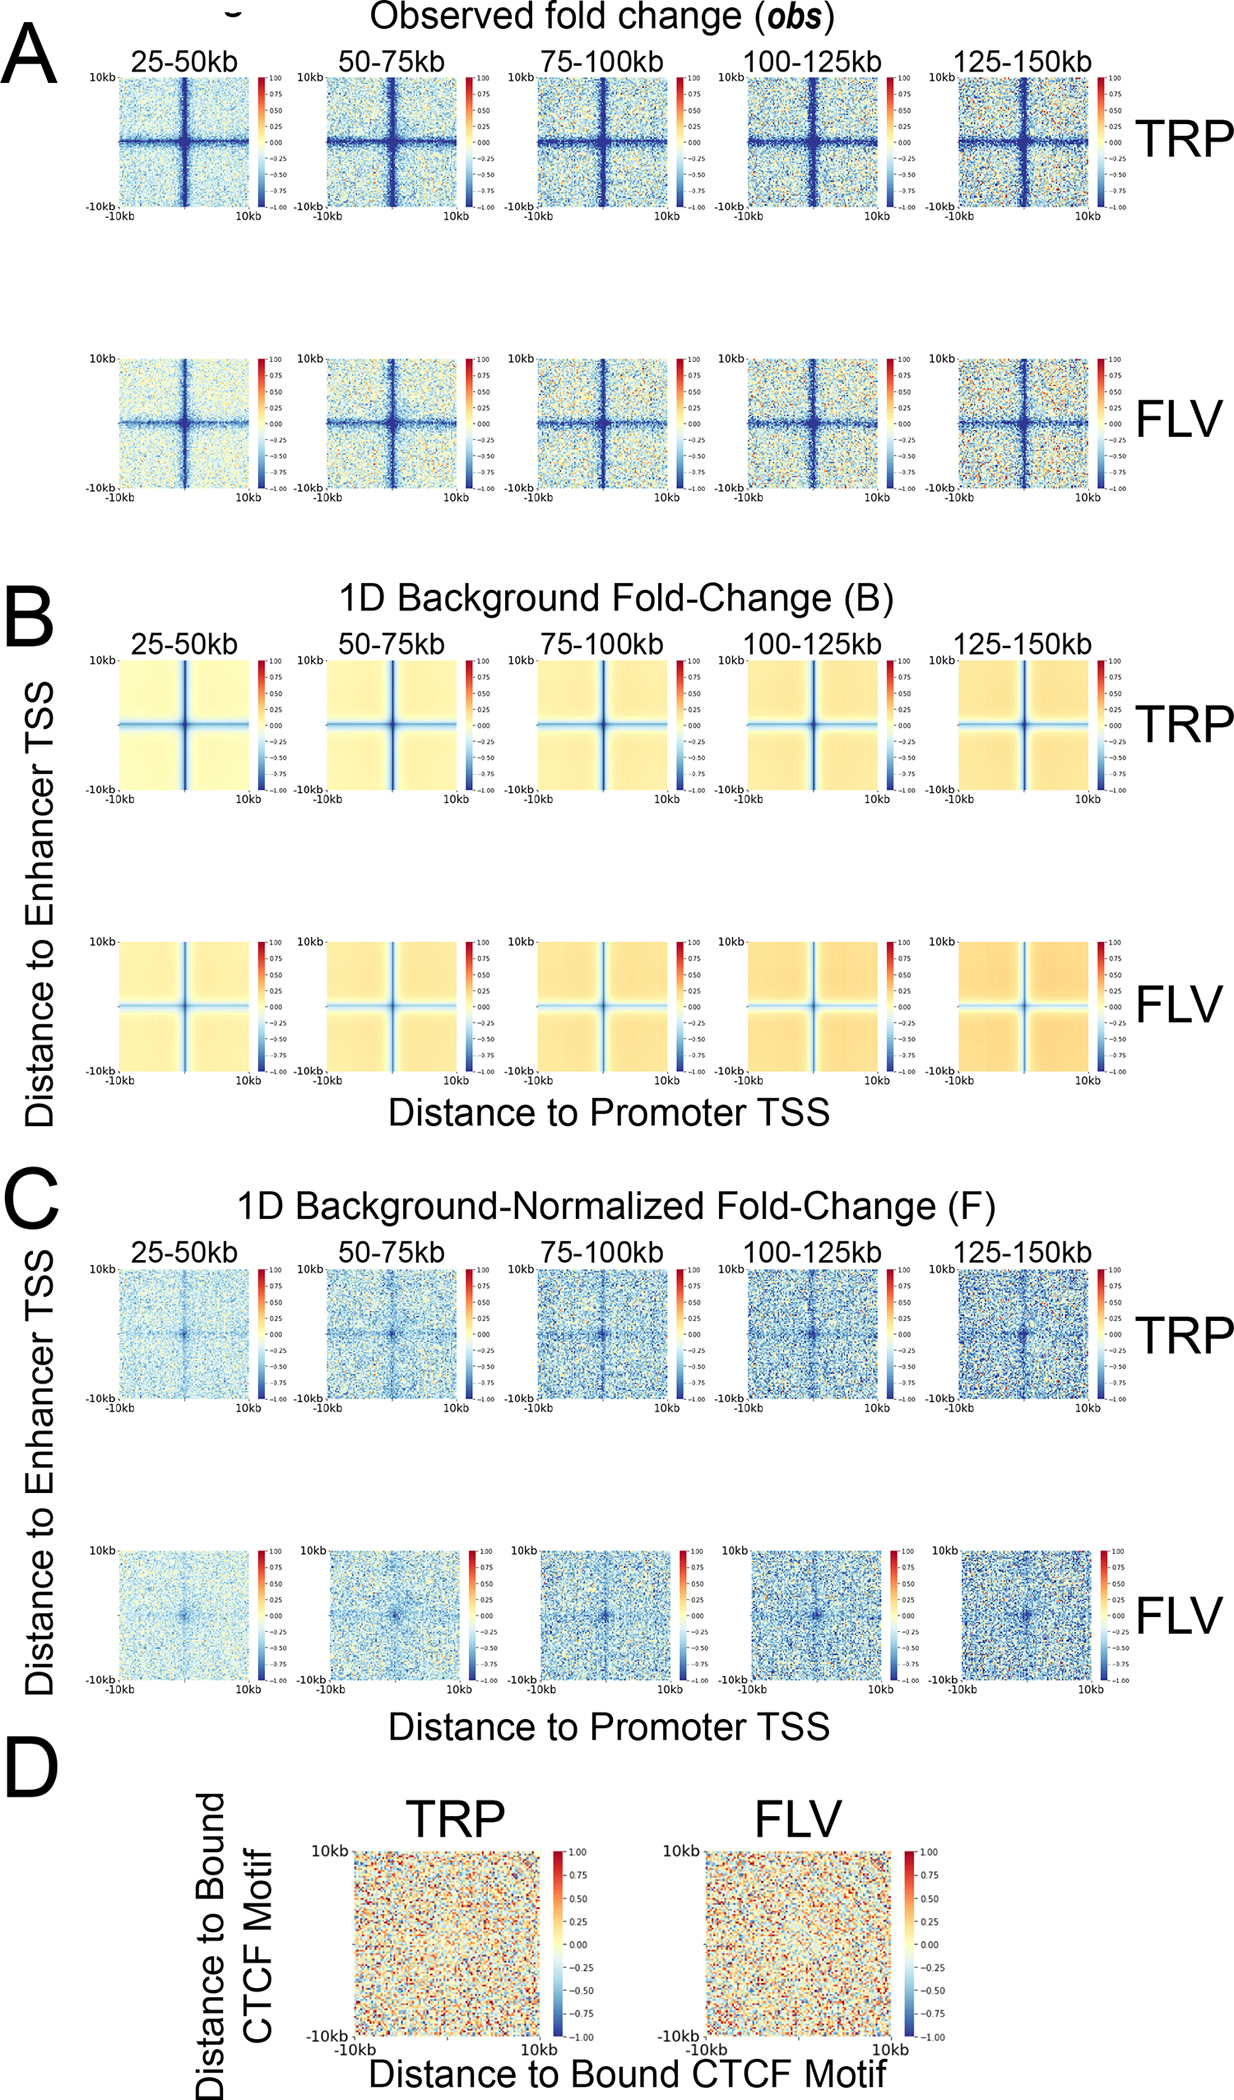
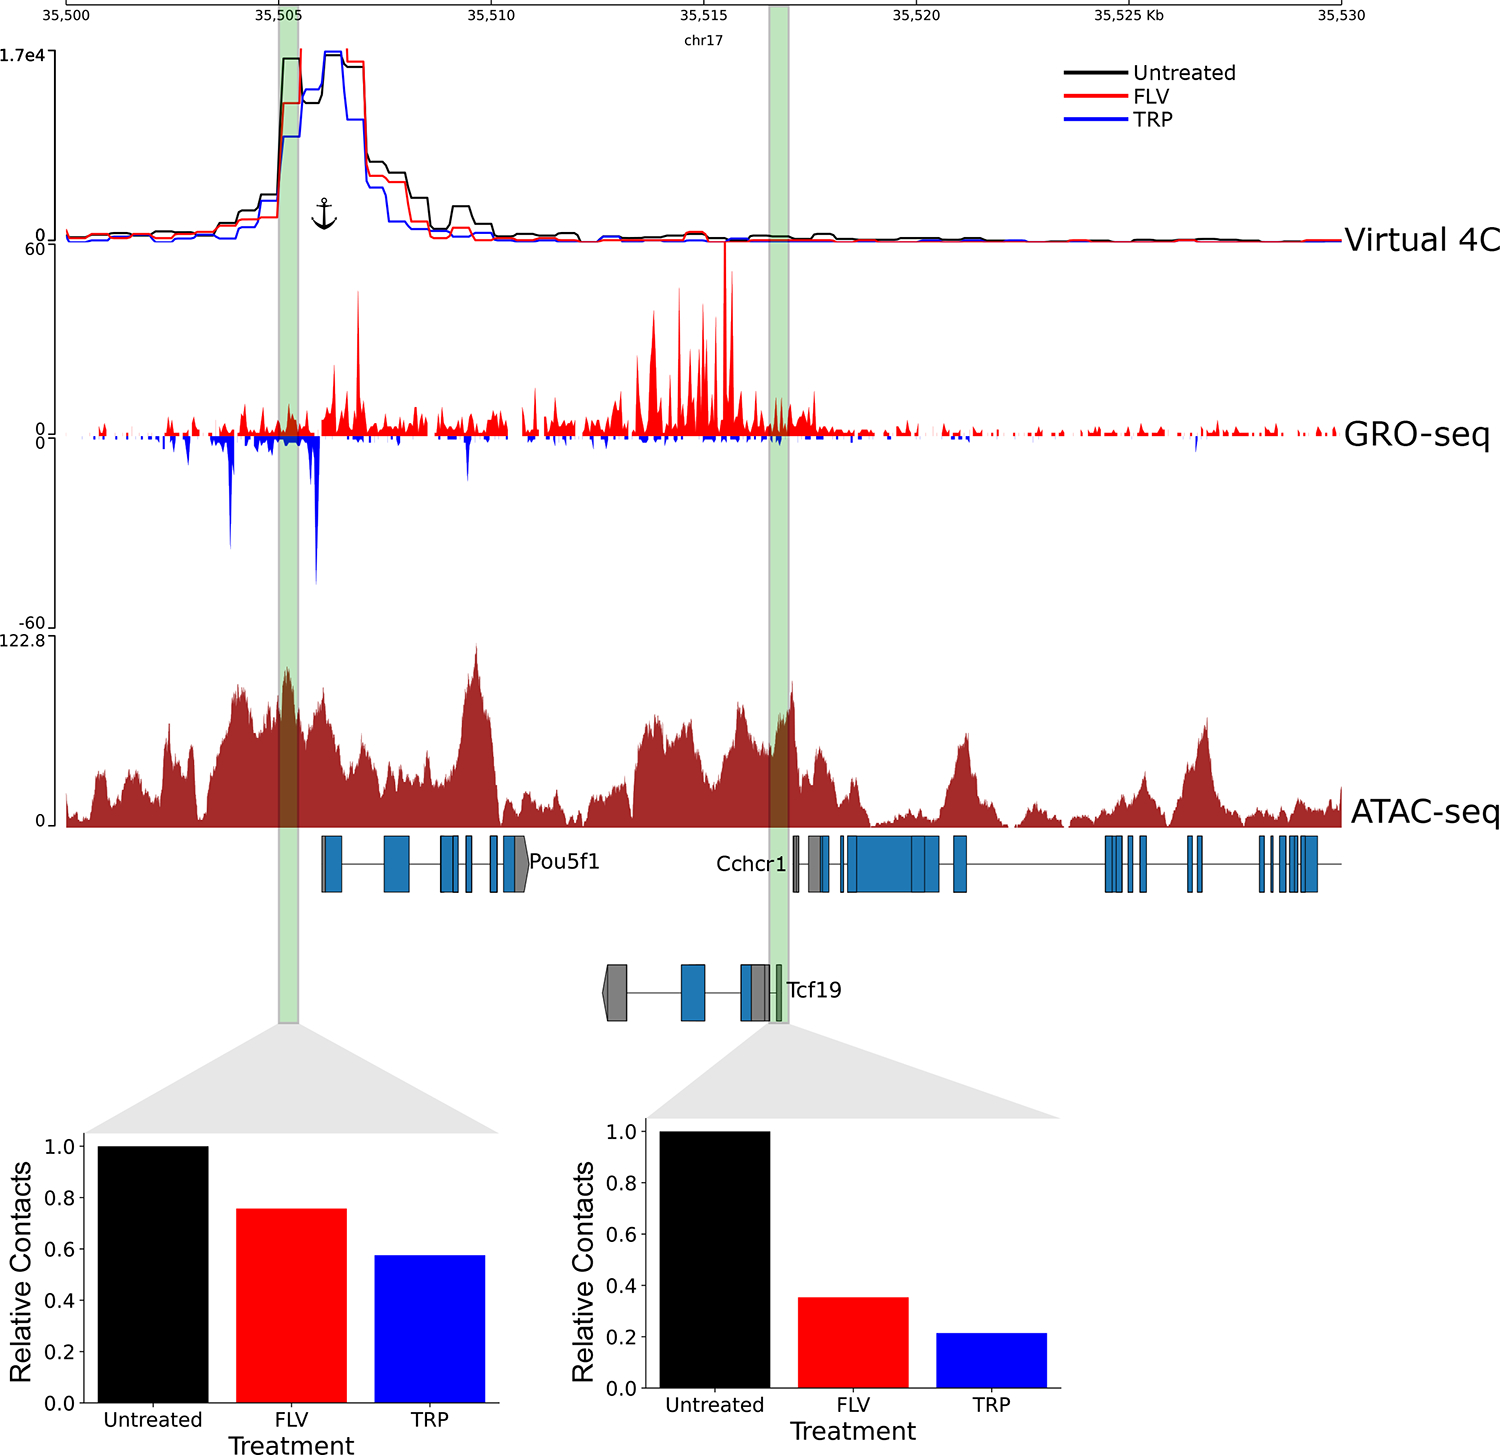
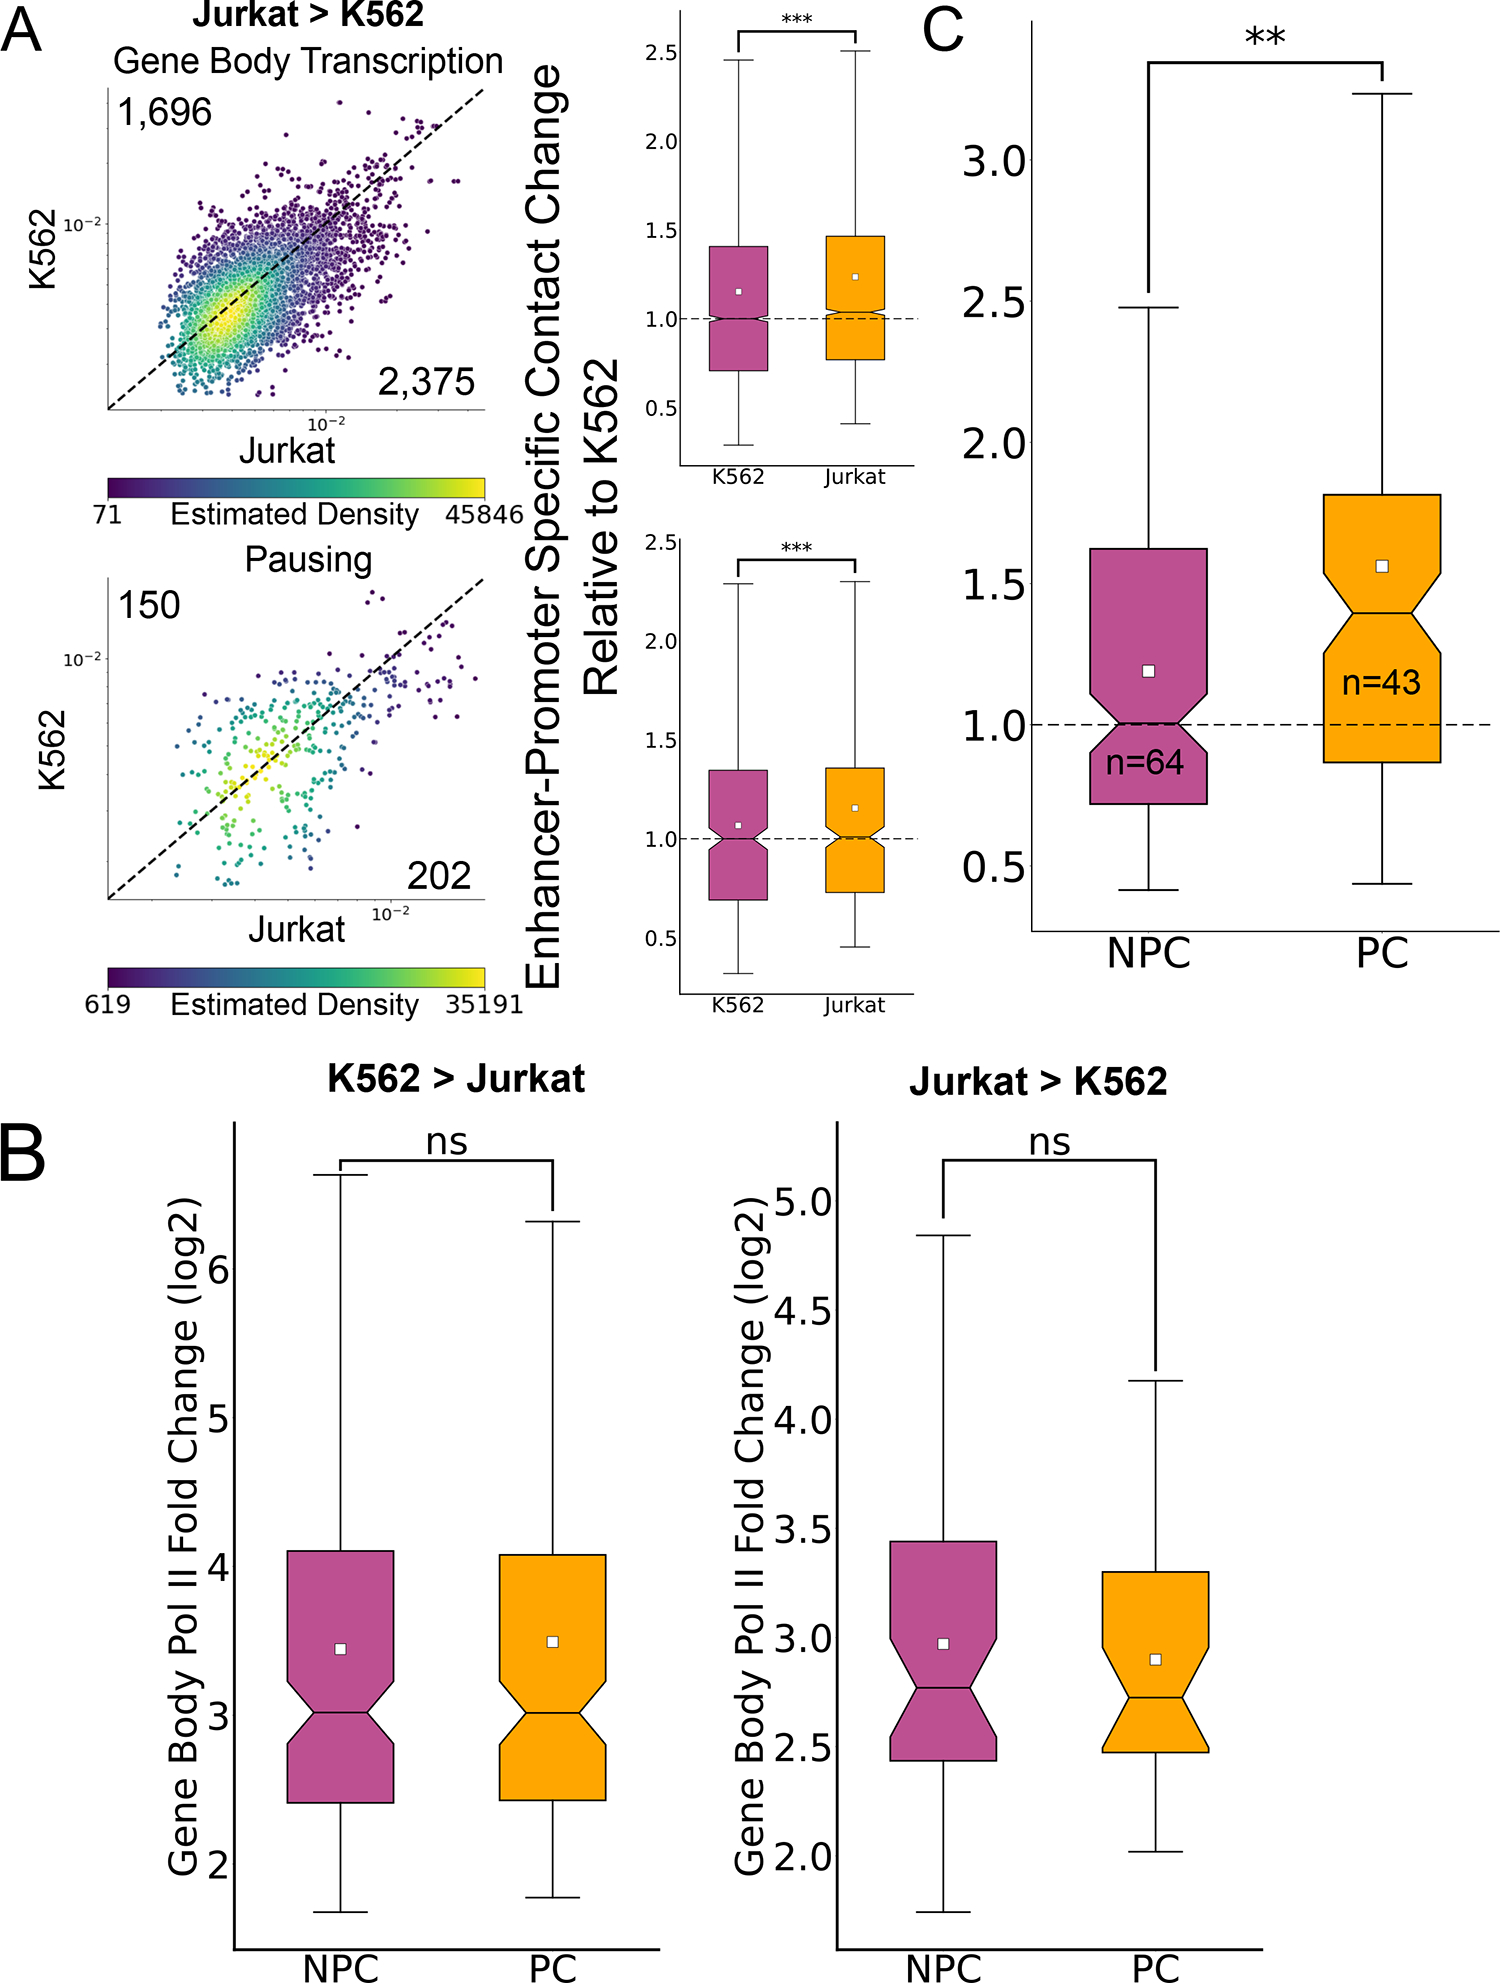
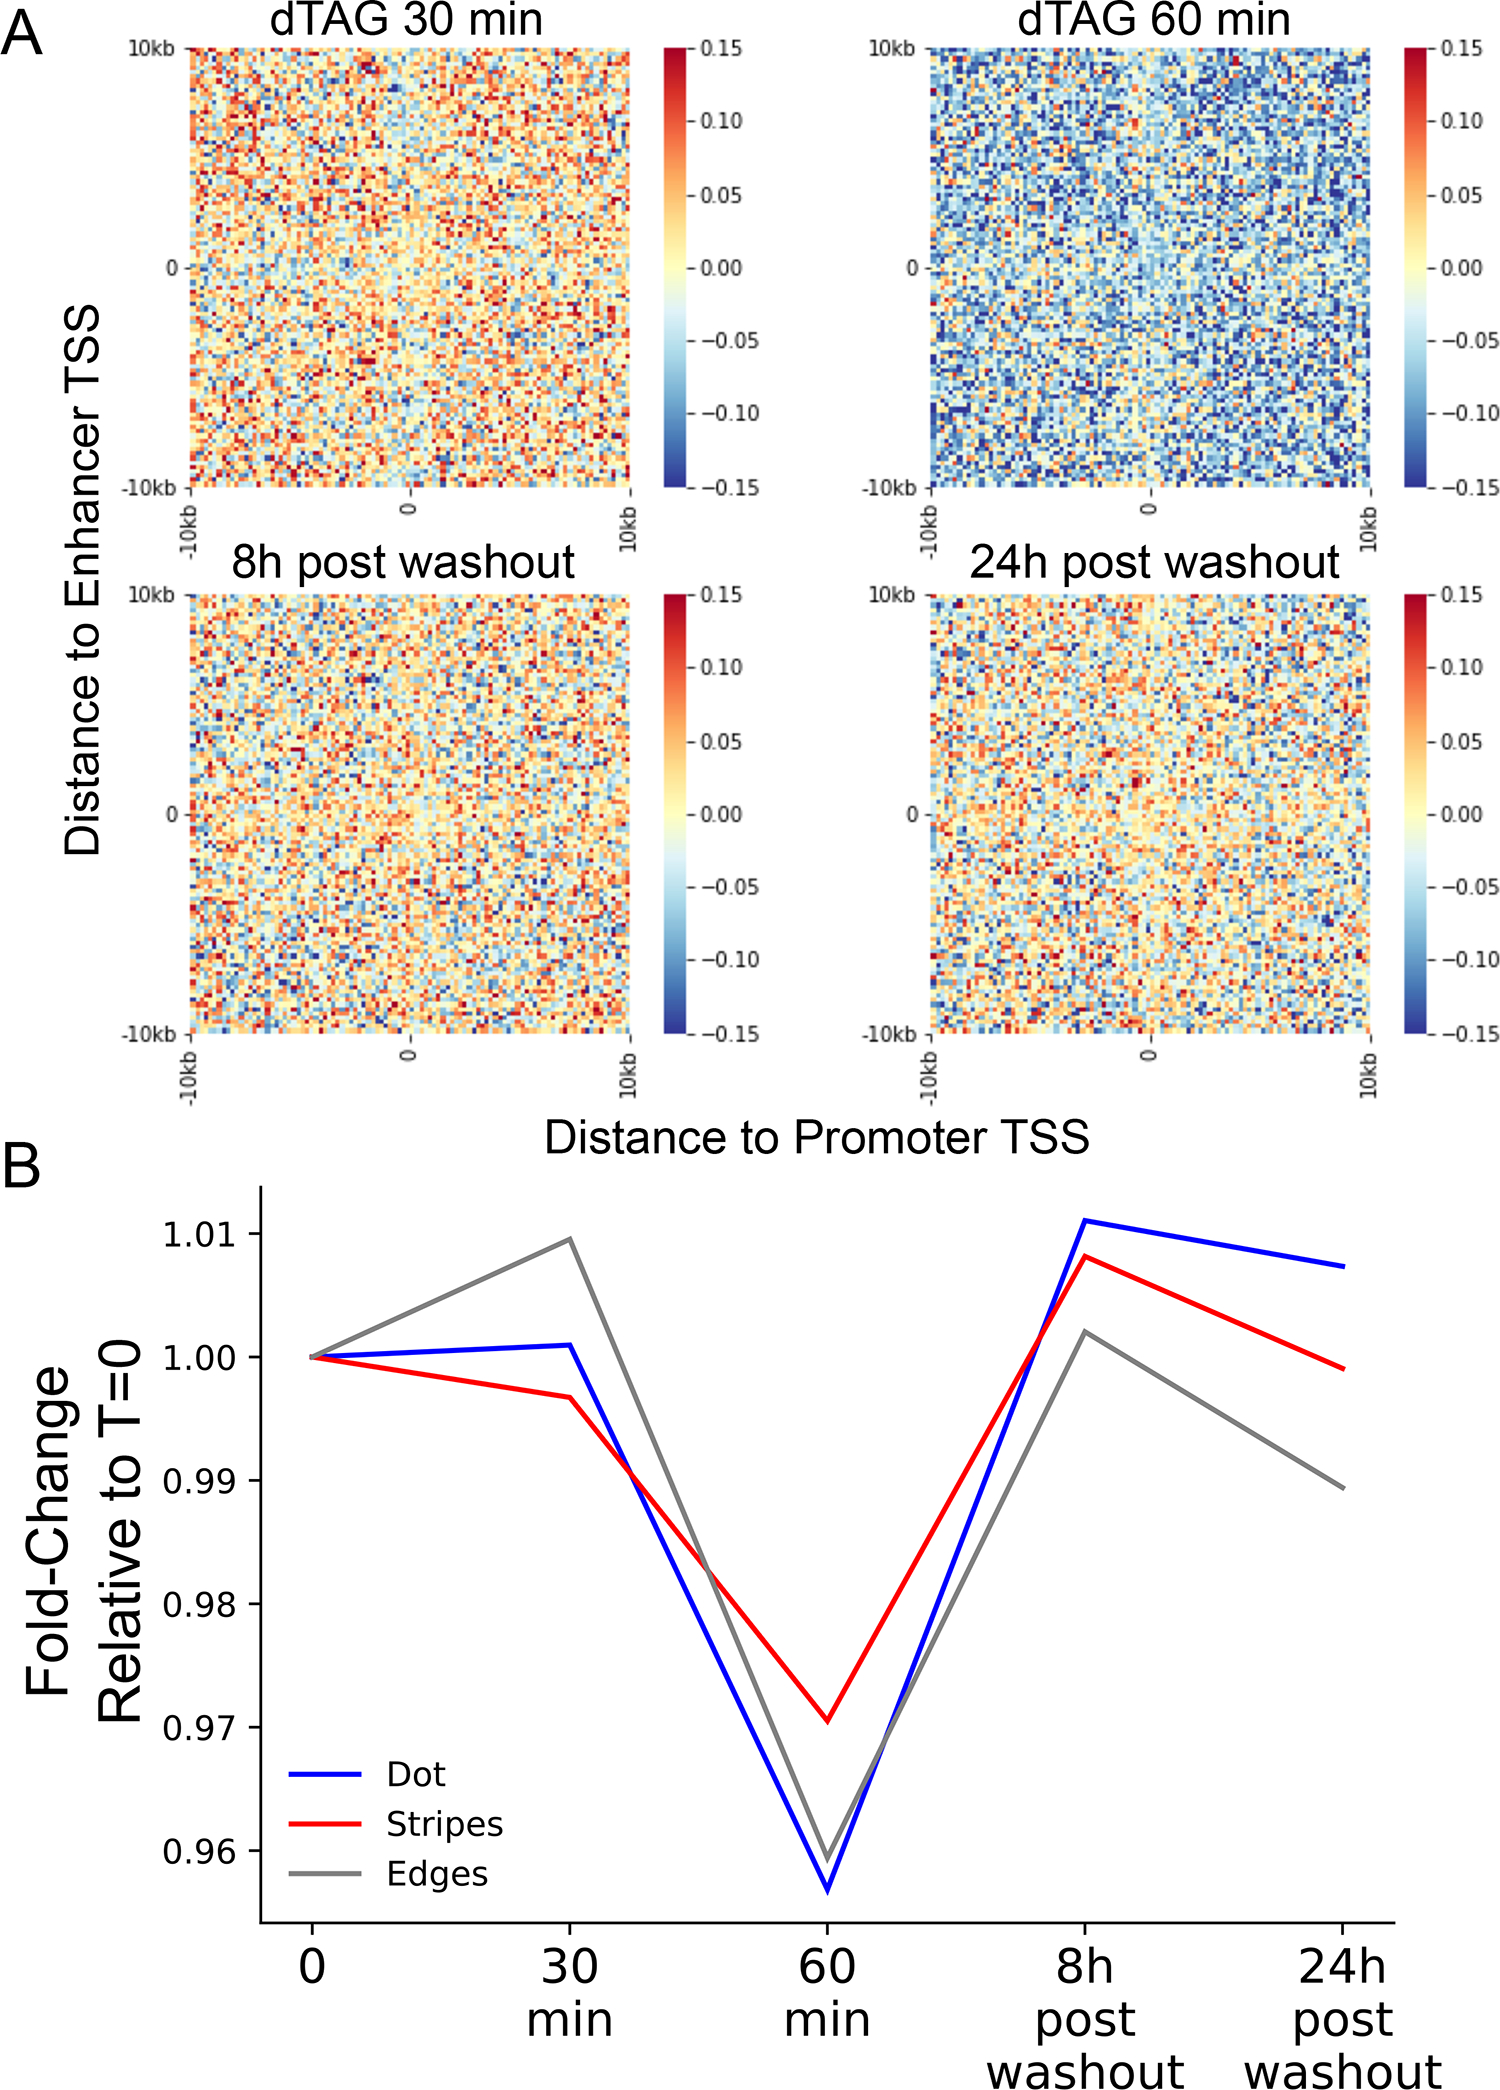
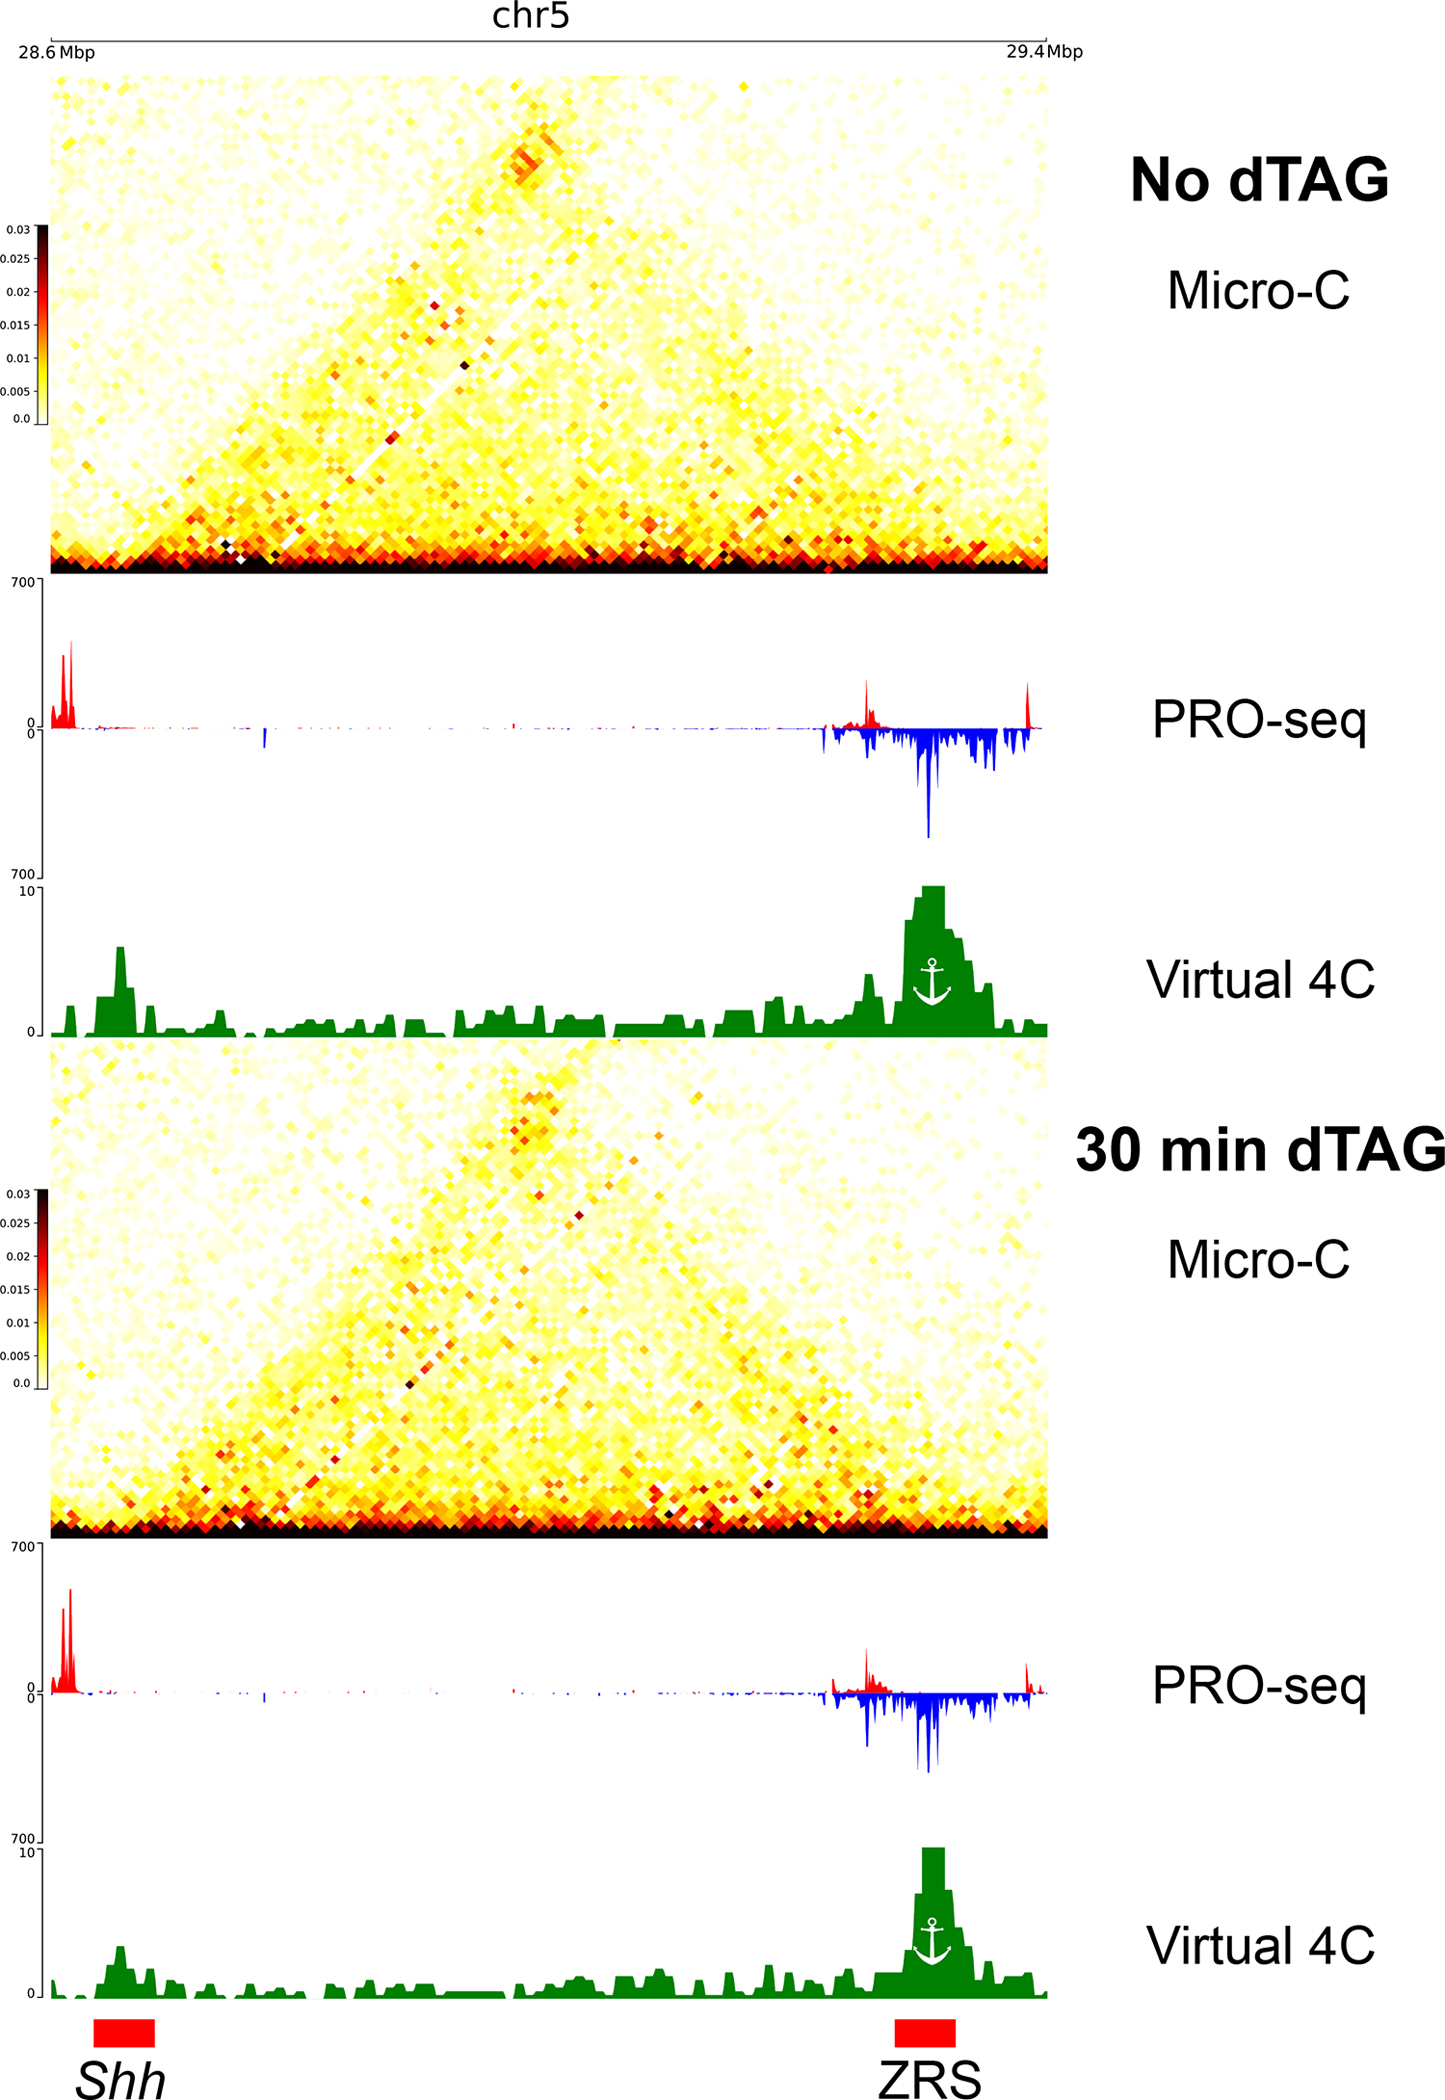
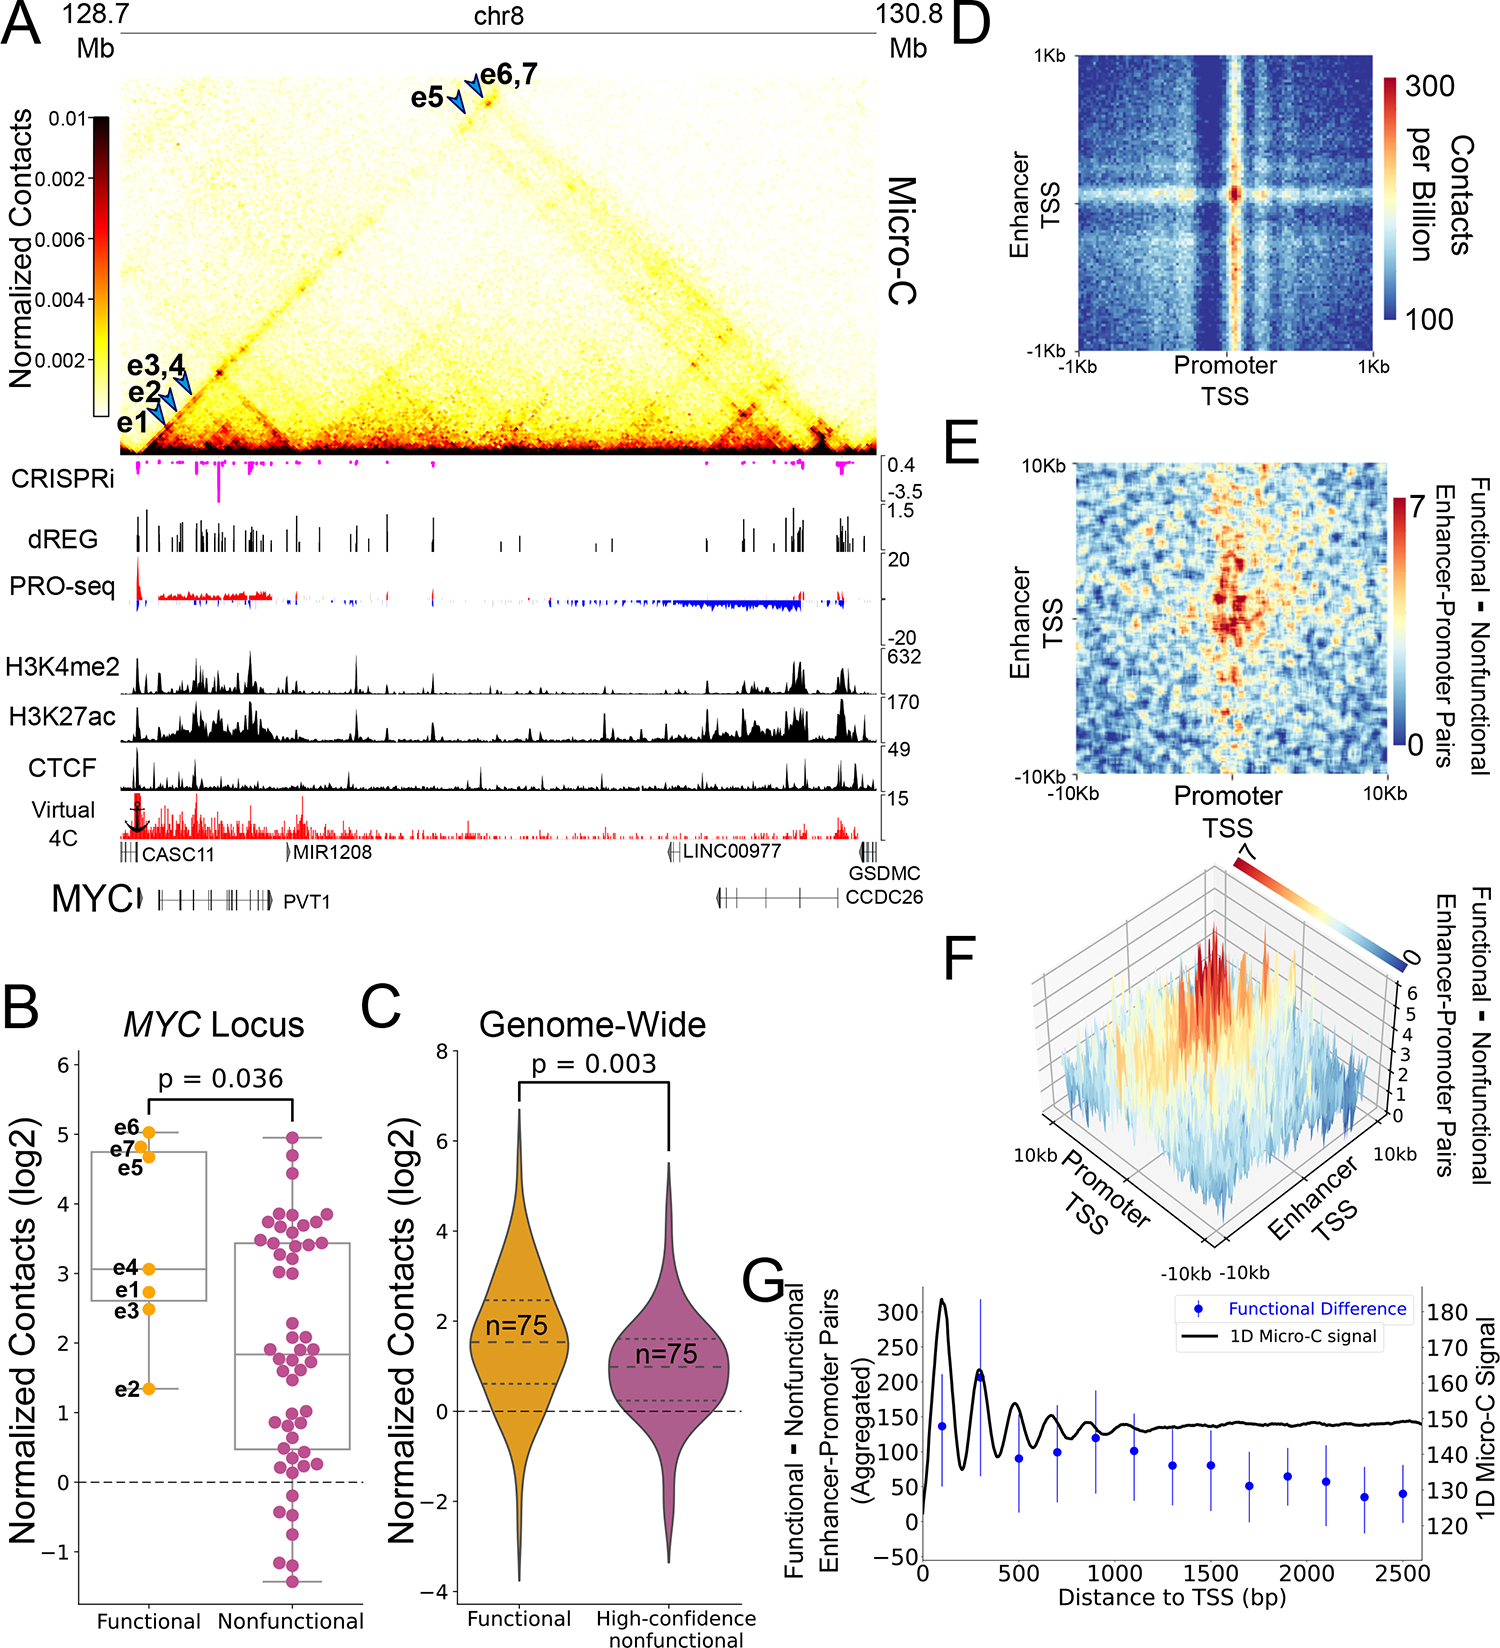
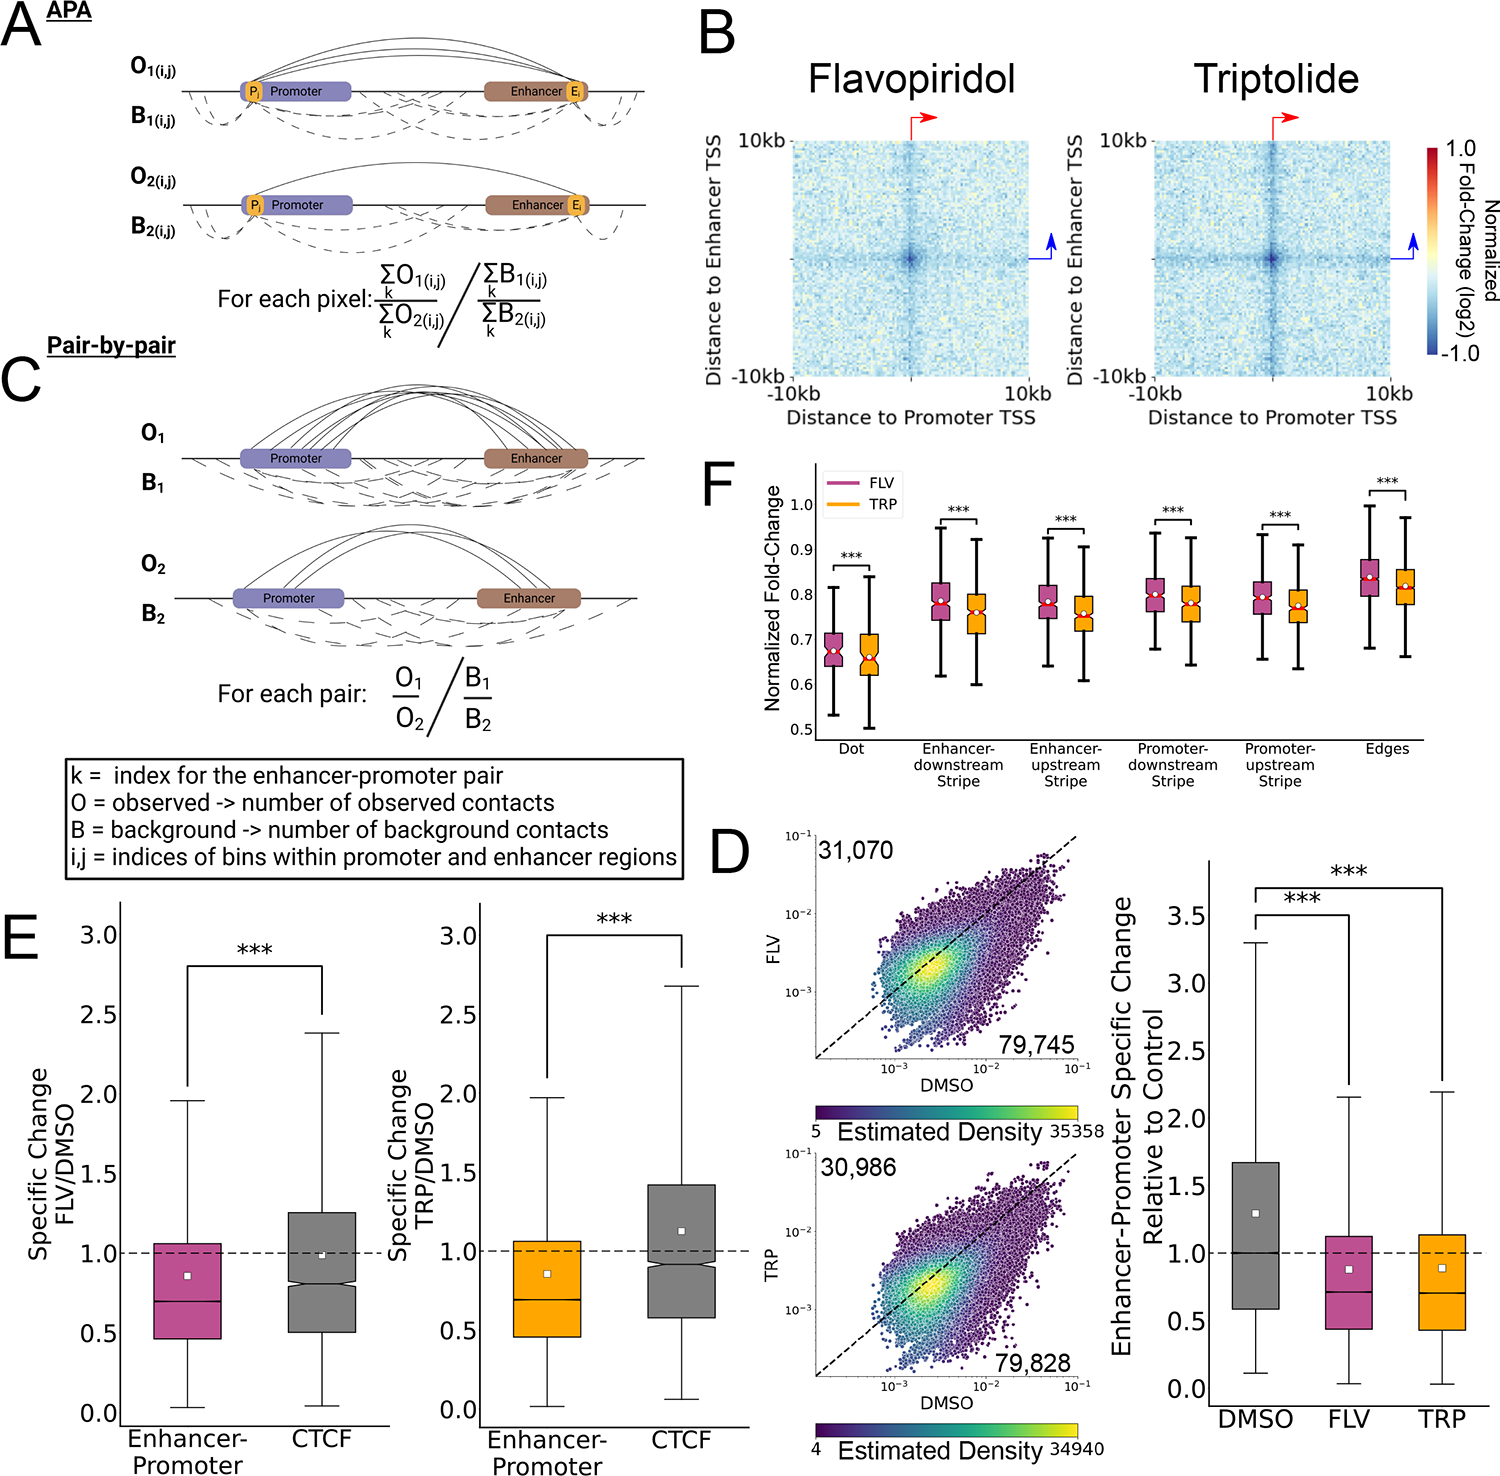
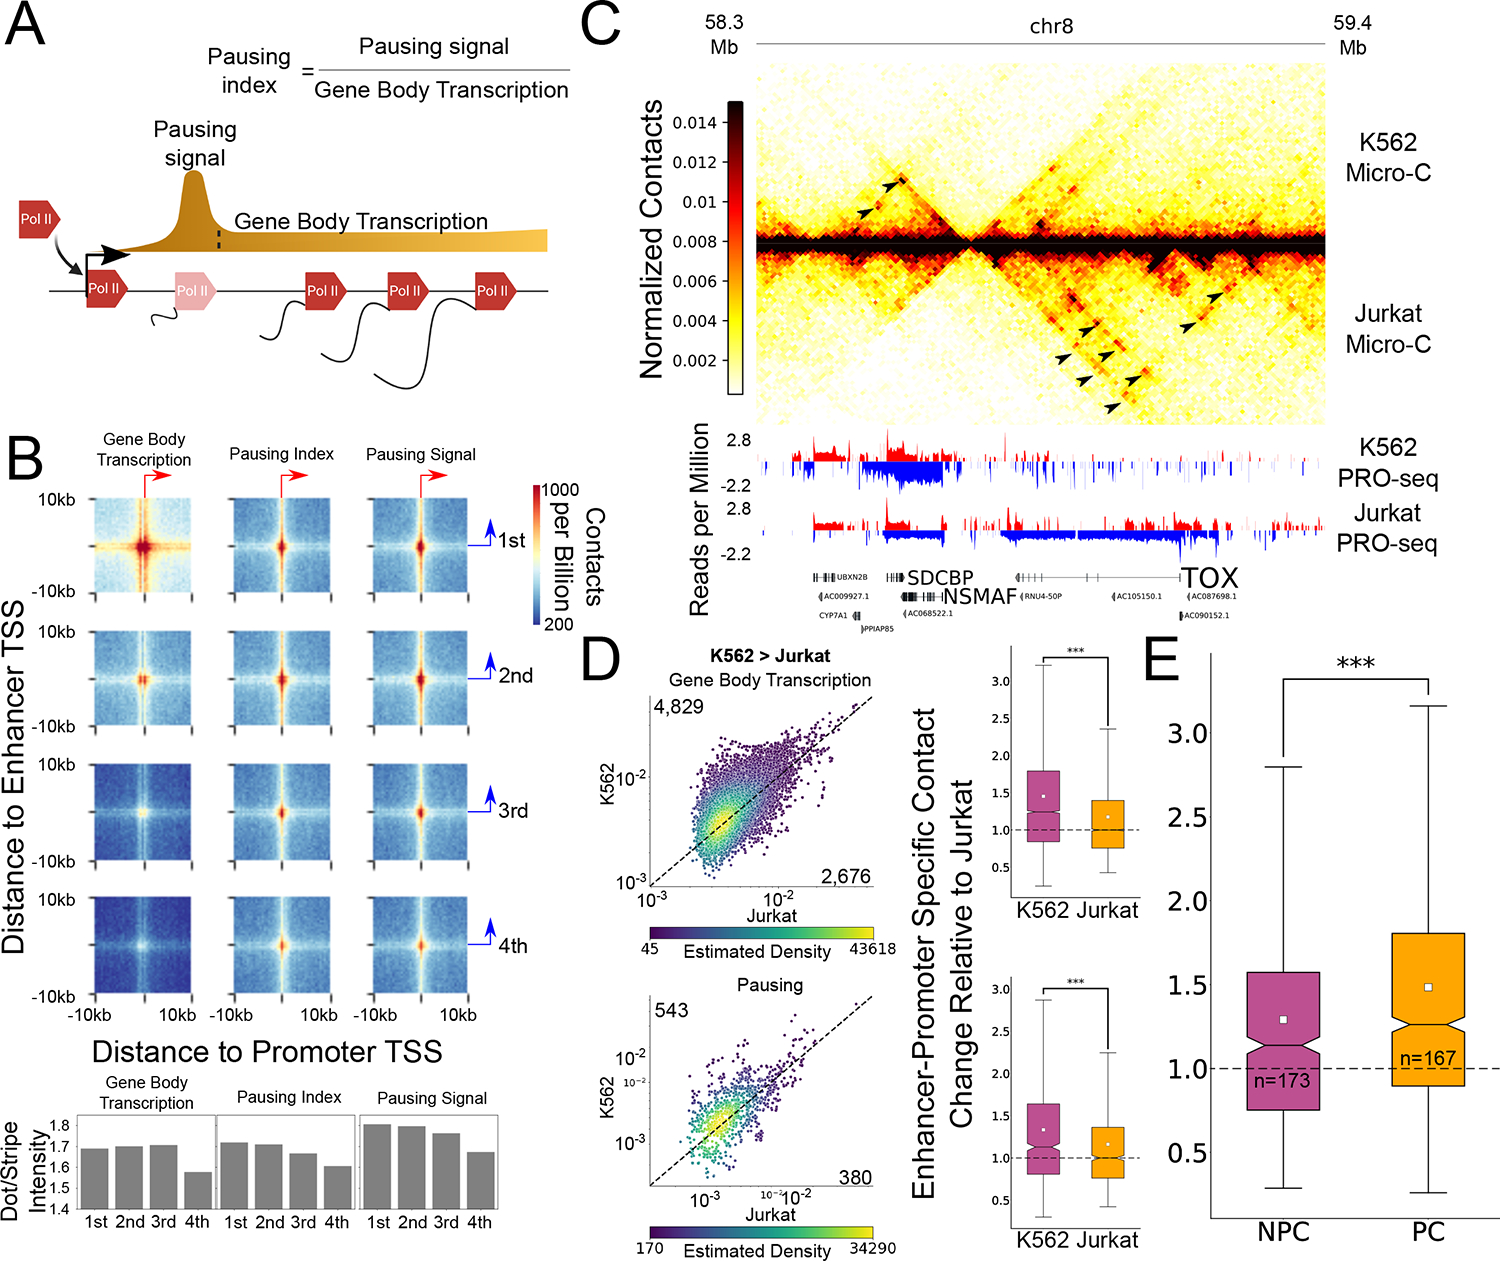
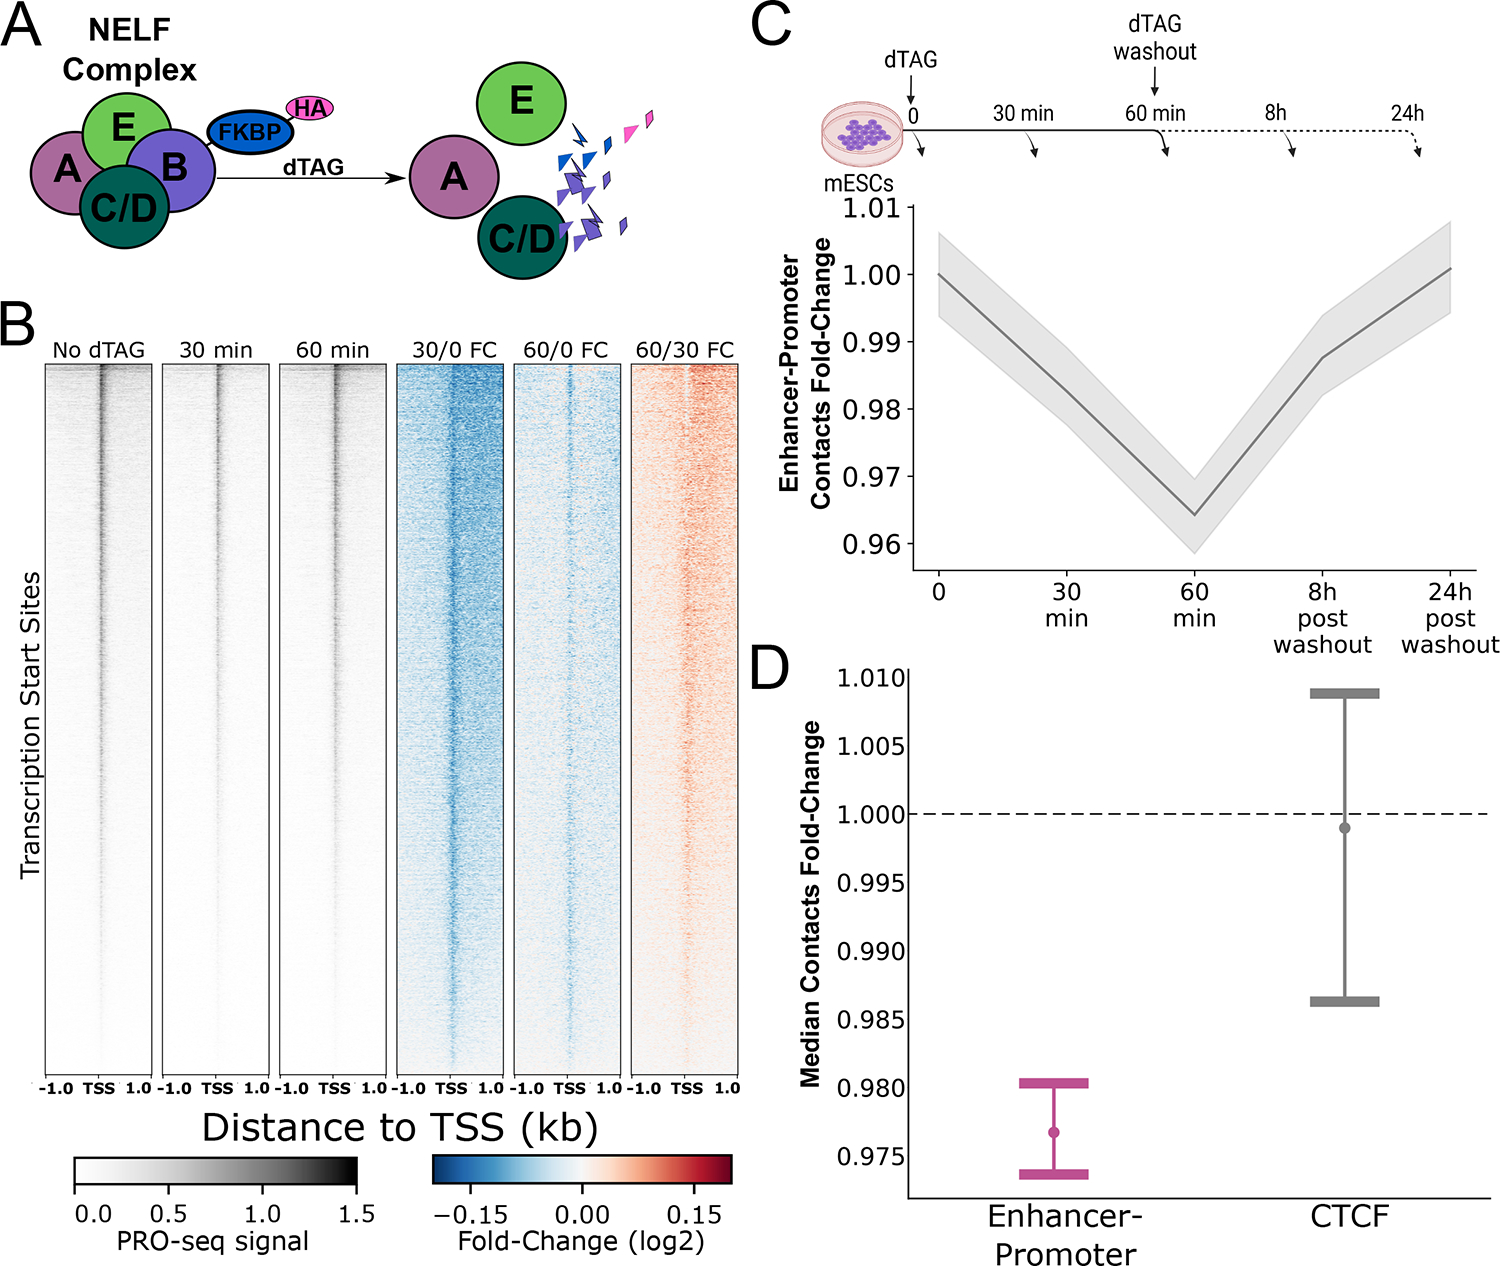
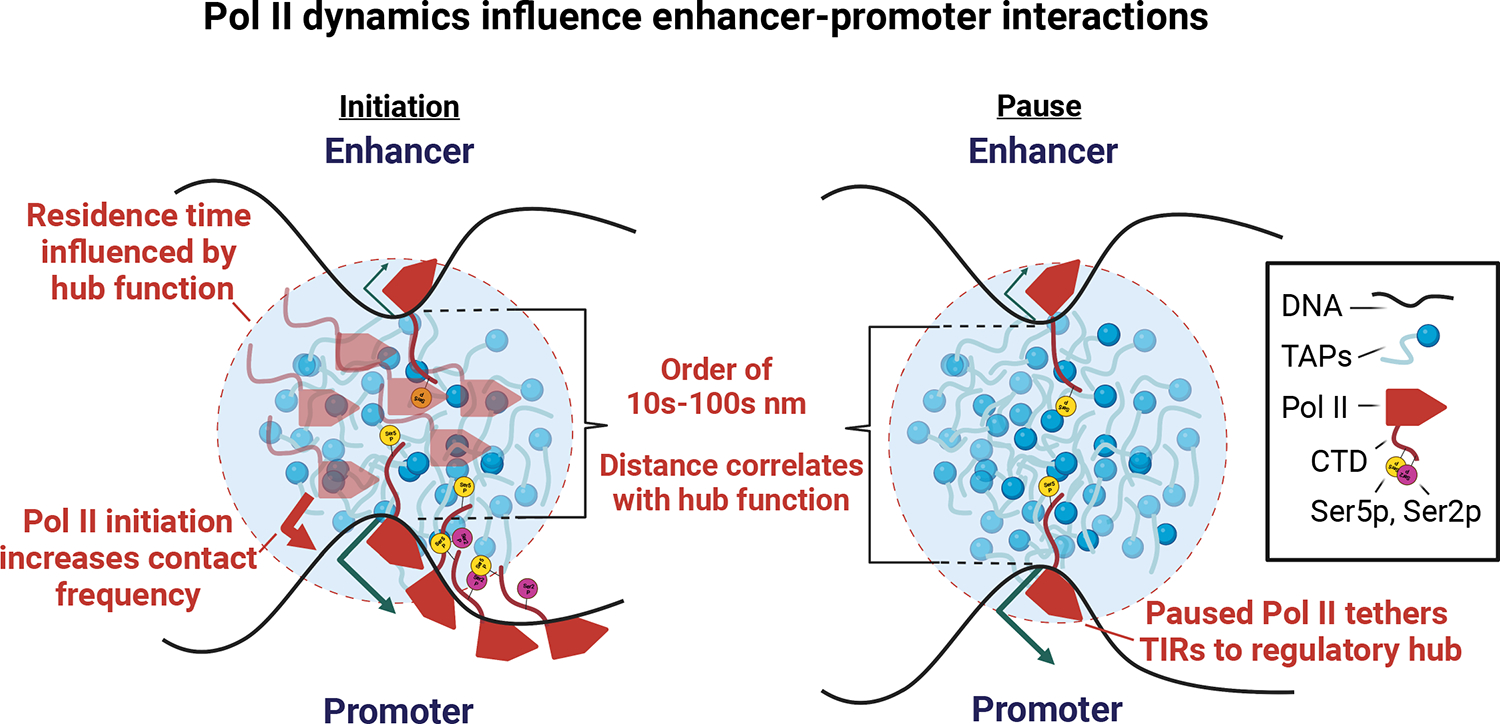
How enhancers control target gene expression over long genomic distances remains an important unsolved problem. Here we investigated enhancer-promoter communication by integrating data from nucleosome-resolution genomic contact maps, nascent transcription and perturbations affecting either RNA polymerase II (Pol II) dynamics or the activity of thousands of candidate enhancers. Integration of new Micro-C experiments with published CRISPRi data demonstrated that enhancers spend more time in close proximity to their target promoters in functional enhancer-promoter pairs compared to nonfunctional pairs, which can be attributed in part to factors unrelated to genomic position. Manipulation of the transcription cycle demonstrated a key role for Pol II in enhancer-promoter interactions. Notably, promoter-proximal paused Pol II itself partially stabilized interactions. We propose an updated model in which elements of transcriptional dynamics shape the duration or frequency of interactions to facilitate enhancer-promoter communication.


Conflict of interest statement

Ethics declarations

Competing interests

The authors declare no competing interests.

Figures

Extended Data Figure 1.
Extended Data Figure 1.. Details for the comparison between functional and nonfunctional enhancer-promoter pairs.
(A) Schematic representation of the LOWESS-based normalization for enhancer-promoter contacts. (B) Box and dot plots, similar to Fig. 1B, comparing the observed contact frequency relative to expected by a local distance-decay function of the validated functional enhancers in the MYC locus (functional pairs) compared to the rest of the dREG-detected TIRs in the TAD (nonfunctional pairs) with the MYC promoter. Here we divided the CRISPRi-tested TIRs to those that fall within the first 0.5Mb (near, functional: n=4, nonfunctional: n=27) or beyond 1.5Mb (far, functional: n=3, nonfunctional: n=12) within the TAD. For both boxplots, boxes show the median, and 25–75 inter quartile range (IQR) and the maximum length of the whiskers is 1.5 IQR. Two-sided Mann-Whitney p-values are indicated. (C) Violin plots comparing contact levels relative to expected by local distance-decay function of functional versus the nonfunctional enhancer-promoter pairs in the genome, before matching for enhancer-promoter distance, accessibility or target gene expression. On the left column, the results are based on dREG CRISPRi-targeted TIRs either before (top) and after (bottom) excluding pairs that do not fall into the same mega-haplotype (MH) or fall within known structural variants (SVs) in K562 cells. The middle violin plot shows the same as the top-left one, but using data from a different CRISPRi dataset. The two violin plots on the right show the same as the two on the left, using the same CRISPRi dataset, but centering on H3K27ac overlapping ATAC-peaks instead of TIRs. Two-sided Mann-Whitney p-values are indicated. (D) Venn diagram showing the overlap between H3K27ac+ ATAC-peaks (H3K27ac)- and dREG TIRs-defined enhancers tested by CRISPRi in.
Extended Data Figure 2.
Extended Data Figure 2.. Matching possible confounders between CRISPRi functional and nonfunctional pairs.
Histograms demonstrating the distribution of functional and high-confidence nonfunctional enhancer-promoter pairs in terms of enhancer-promoter genomic distance (top), accessibility by mean ATAC-seq signal (middle) and PRO-seq target gene transcription signal in reads per kilobase per million reads (RPKM) (bottom), after matching for these possible confounding factors.
Extended Data Figure 3.
Extended Data Figure 3.. Functional constituent enhancers within super enhancers interact more with the target promoter.
(A-B) Violin plots comparing contact levels relative to expected by local distance-decay function of functional versus the nonfunctional enhancer-promoter pairs in the genome, where the enhancers are mapped within (A) or outside (B) K562 defined super enhancers. Two-sided Mann-Whitney p-values are indicated (C) Dot plot shows the log2 distribution of local genomic distance-normalized contact frequency between CRISPRi-defined functional constituent enhancers within 16 super enhancers compared to other constituent enhancers within these super enhancers. The dashed lines connect data points representing the median values of the same super enhancer. Two-sided Wilcoxon paired-test p-values is shown. (D) Dot plot shows the log2 distribution of local genomic distance-normalized contact frequency between CRISPRi-defined high-confidence nonfunctional constituent enhancers within 15 super enhancers compared to other constituent enhancers within these super enhancers. The dashed lines connect data points representing the median values of the same super enhancer. Two-sided Wilcoxon paired-test p-values is shown. (E) Violin plot shows the distribution of the ratios between the functional constituent enhancers to other constituent enhancers in the same super enhancer (yellow) and between high-confidence nonfunctional constituent enhancers to other constituent enhancers in the same super enhancer. Two-sided Mann-Whitney p-value is indicated.
Extended Data Figure 4.
Extended Data Figure 4.. Micro-C 1D signal near TSSs genome-wide.
One dimensional contact signal for intra-chromosomal contacts with both sides having mapping quality (mapq) ≥ 30. Total median signal was smoothed using a sliding window of 100bp. Shown are signals around promoter TSSs (orange), enhancer TSSs (purple) and all TSSs genome-wide (black).
Extended Data Figure 5.
Extended Data Figure 5.. Elaborated schematic representation of the APA method used to calculate 1D background-normalized changes in contacts between samples.
(A) To calculate the observed change in contacts, a matrix of contacts between each enhancer-promoter pair within the limited defined genomic distance range was calculated and then all of these matrices were summed to obtain the observed aggregated matrix. To get the obs the sequencing depth-normalized aggregated matrices were divided by the control matrix. Shown are also the depth-normalized aggregated matrices for the DMSO control, TRP- and FLV-treated mESCs, as well as the obs matrices for both treatments. (B) To calculate the 1D signal background matrices we calculated the average of 1D Micro-C signal vectors across cells around enhancers and promoters. Line plot representations of these vectors at 20 kb windows around enhancers and promoters, across cells of 200 bp are shown for both treatment conditions and DMSO control. The 1D background change matrix, B, was calculated by dividing the 1D signal background matrix of each treatment by the control. The 1D background matrices for both treatments and control samples as well as the matrices B for both treatments in mESCs are shown.
Extended Data Figure 6.
Extended Data Figure 6.. Genomic distance has little effect on the shape of enhancer-promoter contacts fold change.
Matrices showing the observed fold-change (A) the 1D background signal fold change (B) and the 1D background-normalized enhancer-promoter fold change (C) following TRP and FLV treatment compared to the DMSO control at distance ranges starting at 25–50kb (leftmost column) and ending at 125–150kb (rightmost column). (D) Matrix showing the 1D background-normalized fold change of contacts between CTCF bound motifs following TRP and FLV treatments, compared with the DMSO control.
Extended Data Figure 7.
Extended Data Figure 7.. Changes in enhancer-promoter contacts at the Pou5f1 locus following transcriptional inhibition.
Virtual 4C signal showing Micro-C signal associated with Pou5f1 promoter from a ~1.3 billion contacts library of untreated mESC, as well as the FLV and TRP treated mESCs (~400 million contacts each). Shown are also GRO-seq and ATAC-seq signals. Two regulatory elements shown to induce Pou5f1 gene expression are shown in green and the relative contacts between these regulatory elements and the Pou5f1 promoter, relative to the untreated control, in each treatment are shown in the associated bar plots. The position of the anchor for the virtual 4C is shown.
Extended Data Figure 8.
Extended Data Figure 8.. Distribution of fold change in gene body transcription for K562 and Jurkat upregulated genes.
(A) Scatterplots where each dot represents a single enhancer-promoter pair where the promoter was associated with higher gene body transcription (top, n=4,071) and pausing signal (bottom, n=502) at Jurkat T cells compared to K562. The dots are colored based on the density of dots relative to their coordinates. The associated boxplots show the distribution of enhancer-promoter contacts relative to local background in both cell types, relative to the median ratio in K562. (*** Two-sided Wilcoxon signed-rank test p-value < 1X10−100). (B) Boxplots showing the distributions of fold change in gene body signal in genes with no associated paused Pol II change (NPC, K562>Jurkat: n=173, Jurkat>K562: n=64) and associated significant paused Pol II change (PC, K562>Jurkat: n=167, Jurkat>K562: n=43) (“ns” - Two-sided Mann-Whitney p-value > 0.5). (C) Boxplot depicting the relative increase of enhancer-promoter contacts associated with promoters of genes with upregulated gene body transcription in Jurkat T-cells with a corresponding significant increase in pausing signal (pause change – PC, n=43) and without a change in pausing signal (no pause change – NPC, n=64) (** Two-sided Mann-Whitney p-value < 1X10⁻¹⁰). For all boxplots, boxes show the median, and 25–75 inter quartile range (IQR) and the maximum length of the whiskers is 1.5 IQR.
Extended Data Figure 9.
Extended Data Figure 9.. Changes in enhance-promoter contacts architecture following NELFB depletion.
(A) APA heatmaps of the 1D change-normalized contact change (log2) between enhancer and promoter regions at 20kb around TSSs. Pixel size is 200 bp square. The APA heatmaps are oriented such that the gene TSS points to the right and the dominant TSS of the enhancer points upwards. (B) Line plot of the median fold changes at the dot (blue), stripes (red) and edges (gray) relative to T=0 at the different time points of dTAG treatments and following dTAG washout.
Extended Data Figure 10.
Extended Data Figure 10.. Changes in ZRS-Shh contacts following NELFB depletion.
Micro-C contact maps in 10kb resolution along with the associated virtual 4C signal and PRO-seq signal in mESCs not treated (top) or treated (bottom) with the dTAG ligand for 30 minutes to degrade NELFB. The positions of the ZRS enhancer and the Shh promoter are indicated in red rectangles.
Figure 1.
Figure 1.. Micro-C contacts are enriched in functional enhancer-promoter pairs.
(A) Genome browser tracks showing Micro-C contact maps, CRISPRi-associated changes in cell viability, dREG-defined TIRs and input PRO-seq signal, H3K4me2, H3K27ac and CTCF ChIP-seq signal and a 2D representation (virtual 4C) of Micro-C contacts with the MYC promoter. Blue arrows point to regions in the contacts map representing interaction between the seven CRISPRi-validated MYC enhancers and the MYC promoter (B) Box and dot plot comparing the observed contact frequency relative to expected by a local distance-decay function of the seven MYC enhancers (functional pairs, n=7) compared to other TIRs in the TAD (nonfunctional pairs, n=52) with the MYC promoter. Boxplots boxes show the median, and 25–75 inter quartile range (IQR) and the maximum length of the whiskers is 1.5 IQR. A two-sided Mann-Whitney U test P-value is indicated. (C) Violin-plot comparing contactss relative to expected by a local distance-decay function of functional and nonfunctional enhancer-promoter pairs in the genome, matched for genomic distance, accessibility and target gene expression distributions. A two-sided Mann-Whitney U test P-value is indicated. (D) An APA for enhancer-promoter contacts at 2kb around the TSSs, oriented such that the gene TSS points to the right and the dominant TSS of the enhancer points upwards. Pixel size is 20bp square(E) APA representing the differences in contacts between functional and nonfunctional pairs based on CRISPRi, oriented such that the gene TSS points to the right and the dominant TSS of the enhancer points upwards. The APA represents smoothed differences in contacts between functional and nonfunctional enhancer-promoter pairs at a region of 20kb around the TSS with original pixel size of 100bp square. (F) A 3D representation of the APA from (E). (G) Blue - dot and error plot showing the median aggregated difference between the 245 functional and 232 high-confidence nonfunctional enhancer-promoter pairs (dot), and associated 95% confidence interval of that median in enhancer-promoter contacts of the +1 and +2 nucleosomes (400bp downstream to the TSS). Black - one dimensional contact signal downstream to enhancers and promoters. Total median signal was smoothed using a sliding window of 100bp.
Figure 2.
Figure 2.. Enhancer-promoter contacts depend on active transcription.
(A) Schematic representation of the strategy used to compute APAs comparing between different conditions. The observes (solid arcs) and background (dashed arcs) contacts associated with the i-th bin relative to the enhancer TSS and the j-th bin relative to the promoter TSS are denoted as O and B, respectively. See also Extended Data Fig. 5 for an elaborated explanation of the method. (B) APA heatmap representation of the log2 fold change in normalized contacts compared to DMSO control for mESCs treated with FLV or TRP. The APA heatmap is oriented such that the gene TSS points to the right and the dominant TSS of the enhancer points upwards, as denoted by the red and blue arrows. (C) Schematic representation of ratio calculation between enhancer-promoter contacts (O, solid arcs) and background (B, dashed arcs) contacts. (D) Scatterplot comparing the enhancer-promoter contacts over background ratio between FLV-treated (top) or TRP-treated (bottom) and DMSO-treated (control) mESCs. The dots are colored based on the density of dots relative to their coordinates. The numbers of pairs in which the ratio was higher in FLV (top) or DMSO control (bottom) are indicated. Boxplots show the ratio distribution relative to the median DMSO control ratio (n=110,815 enhancer-promoter pairs). (*** Two-sided Mann-Whitney p-value < 1X10−100) (E) Boxplots showing the ratio distribution relative to the median DMSO control ratio for enhancer-promoter pairs (n=110,815) and transcriptionally inactive bound CTCF motifs (*** Two-sided Mann-Whitney p-value < 1X10−100). (F) Boxplots quantify the normalized contact changes at the dot (n=100 matrix pixels), the different stripes (n=400 matrix pixels each) and the edges (n=3,200 matrix pixels) of the APA change matrices in each of the TRP and FLV treatments shown in panel B (*** Two-sided Wilcoxon signed-rank test p-value < 1X10−100). For all boxplots, boxes show the median, and 25–75 inter quartile range (IQR) and the maximum length of the whiskers is 1.5 IQR.
Figure 3.
Figure 3.. Changes in Pol II pausing and gene body density correlate with enhancer-promoter contacts.
(A) Schematic representation of gene transcription from initiation, pausing and productive elongation at the gene body. The definitions for the PRO-seq signal at the pause peak and gene body, as well as the calculated pausing index for this analysis, are illustrated. (B) APA heatmaps show enhancer-promoter contacts associated with promoters of four gene body transcription (left), pausing index (middle) and pause peak signal (right) quartiles. Bar-plots demonstrate the ratios between the dot- and stripe-associated contacts. All APAs are centered on the max transcription start site of the gene (x-axis) and enhancer (y-axis) and are oriented so that the primary TSS points to the right (gene) or upwards (enhancer), as denoted by the red and blue arrows. (C) Genome-browser shot of a 1.1Mb region containing the TOX and NSMAF genes. The Micro-C contact map pixel size is 10kb. Arrows indicate differential contacts associated with differential transcriptional activity in K562 and Jurkat T-cells. (D) Scatterplots where each dot represents a single enhancer-promoter pair where the promoter was associated with higher gene body transcription (top, n=7,505) and pausing signal (bottom, n=923) at K562 compared to Jurkat T cells. The numbers of pairs in which the ratio was higher in K562 (upper number) or Jurkat (lower number) are indicated. The dots are colored based on the density of dots relative to their coordinates. The associated boxplots show the distribution of enhancer-promoter contacts relative to local background in both cell types, relative to the median ratio in Jurkat. (*** Two-sided Wilcoxon signed-rank test p-value < 1X10−100). (E) Boxplot shows the relative increase of enhancer-promoter contacts associated with promoters of genes with upregulated gene body transcription in K562 and with a corresponding significant increase in pausing signal (pause change – PC, n=167) or without a change in pausing signal (no pause change – NPC, n=173) (*** Two-sided Mann-Whitney p-value < 1X10−100). For all boxplots, boxes show the median, and 25–75 inter quartile range (IQR) and the maximum length of the whiskers is 1.5 IQR.
Figure 4.
Figure 4.. NELFB depletion and recovery correlates with changes in enhancer-promoter contacts.
(A) Illustration of the NELFB-dTAG system and the corresponding effect on the NELF complex. Following NELFB depletion with dTAG, the NELF complex dissociates and is no longer found bound to chromatin (B) Heatmaps showing PRO-seq signal in untreated (control) mESCs (left) and 30–60min of treatment with dTAG as well as the fold-change in PRO-seq signal following 30 minutes of dTAG treatment and after 60 minutes of dTAG treatment near TSSs and the fold change in PRO-seq signal at 30 minutes and 60 minutes of dTAG treatment compared to untreated control and at 60 minutes compared to 30 minutes of dTAG treatment. (C) A line plot showing the median enhancer-promoter contacts over background ratio change relative to the untreated (T=0) control. Gray shadow represents the 95% confidence interval for the median, based on 1000 bootstrap iterations. (D) Dot and error plot demonstrating the median contact change and the 95% confidence interval of the median based on 1000 bootstrap iterations, after 60 minutes of NELFB depletion, for enhancer-promoter (purple) and transcriptionally inactive bound CTCF motif contacts in mESCs (gray).
Figure 5.
Figure 5.. Updated model integrating Pol II dynamics into enhancer-promoter interactions.
Cartoon depicts our updated model in which enhancers come into close contact with the target promoter during a transcriptional burst. We propose that the rate of initiation and productive elongation increases the mobility of enhancers and promoters in the nuclear space, and hence can increase the rate of their entanglement or contact frequency. Paused Pol II, which is stable on DNA for long durations, may tether TIRs into a hub for longer durations, providing more stable enhancer-promoter interactions at highly paused genes. In the key, TAPs denotes transcription associated proteins such as transcription factors and co-activations; CTD denotes the C-terminal domain of Pol II; Ser5p, Ser2p represent serine 5 and serine 2 phosphorylation on the Pol II CTD.

Comment in

References

    1. Levine M & Tjian R Transcription regulation and animal diversity. Nature 424, 147–151 (2003). - PubMed
    1. Banerji J, Rusconi S & Schaffner W Expression of a beta-globin gene is enhanced by remote SV40 DNA sequences. Cell 27, 299–308 (1981). - PubMed
    1. Gruss P, Dhar R & Khoury G Simian virus 40 tandem repeated sequences as an element of the early promoter. Proc. Natl. Acad. Sci. U. S. A. 78, 943–947 (1981). - PMC - PubMed
    1. Benoist C & Chambon P In vivo sequence requirements of the SV40 early promoter region. Nature 290, 304–310 (1981). - PubMed
    1. Choi OR & Engel JD Developmental regulation of beta-globin gene switching. Cell 55, 17–26 (1988). - PubMed

Publication types

MeSH terms

Substances