Comparison of the effects of probiotic strains (Lactobacillus gasseri, Lactiplantibacillus plantarum, Lactobacillus acidophilus, and Limosilactobacillus fermentum) isolated from human and food products on the immune response of CT26 tumor-bearing mice
- PMID: 37430135
- PMCID: PMC10485204
- DOI: 10.1007/s42770-023-01060-9
Comparison of the effects of probiotic strains (Lactobacillus gasseri, Lactiplantibacillus plantarum, Lactobacillus acidophilus, and Limosilactobacillus fermentum) isolated from human and food products on the immune response of CT26 tumor-bearing mice
Abstract
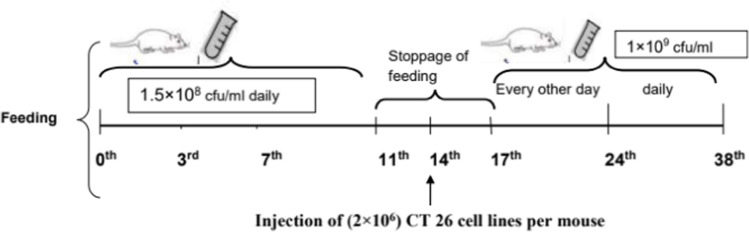
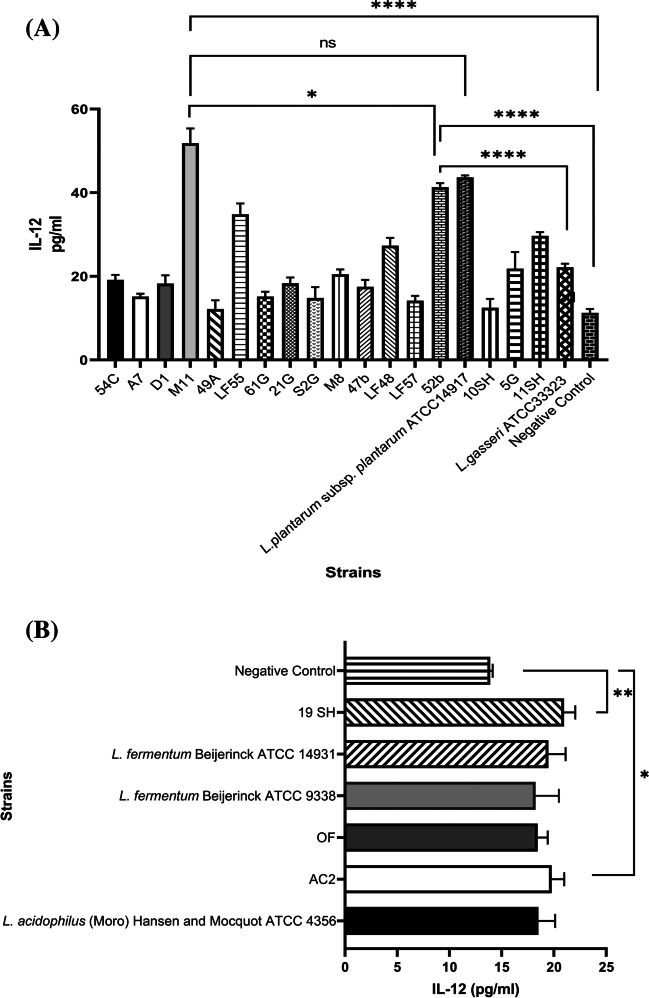
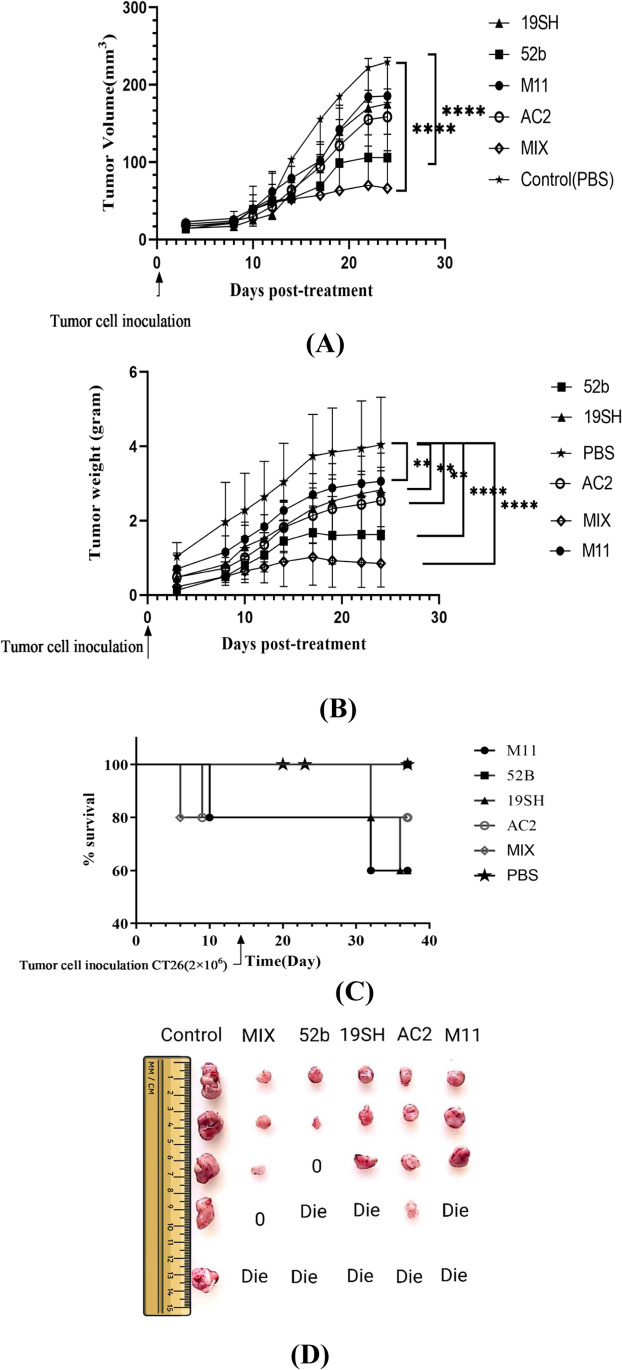
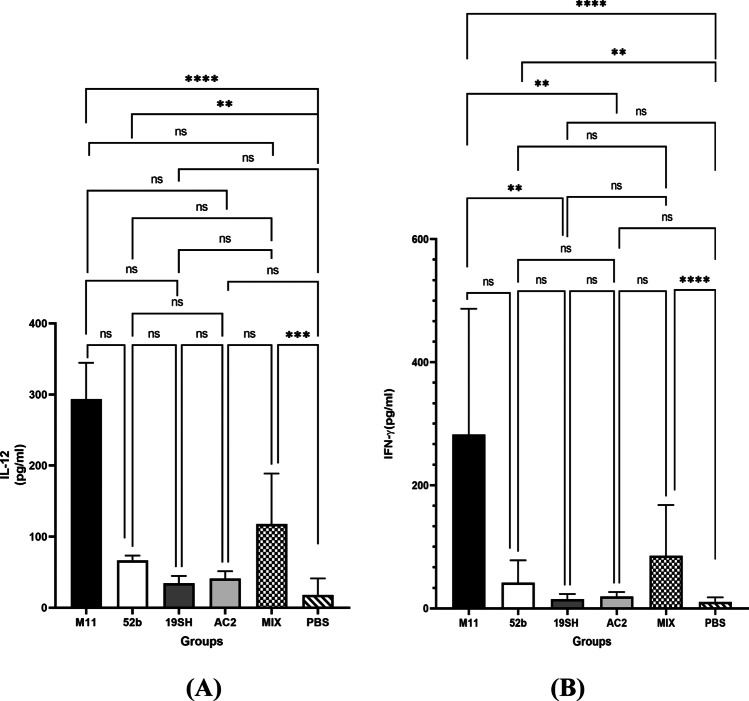
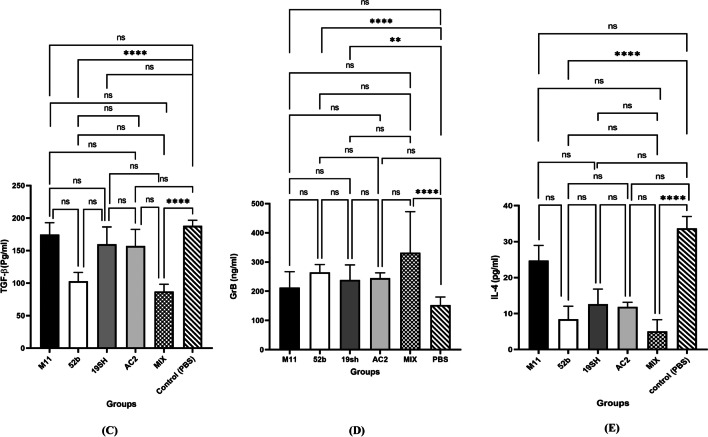
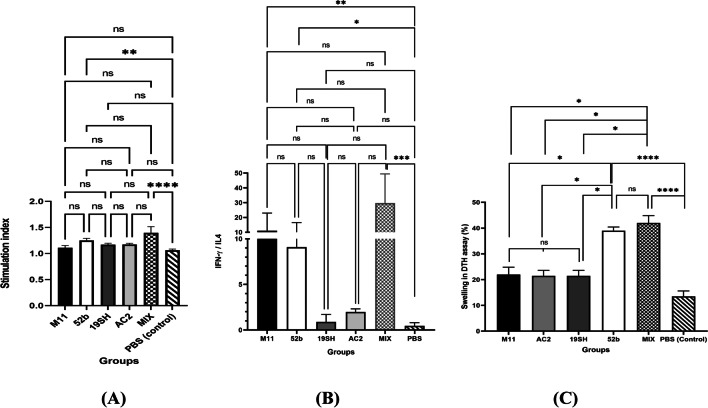
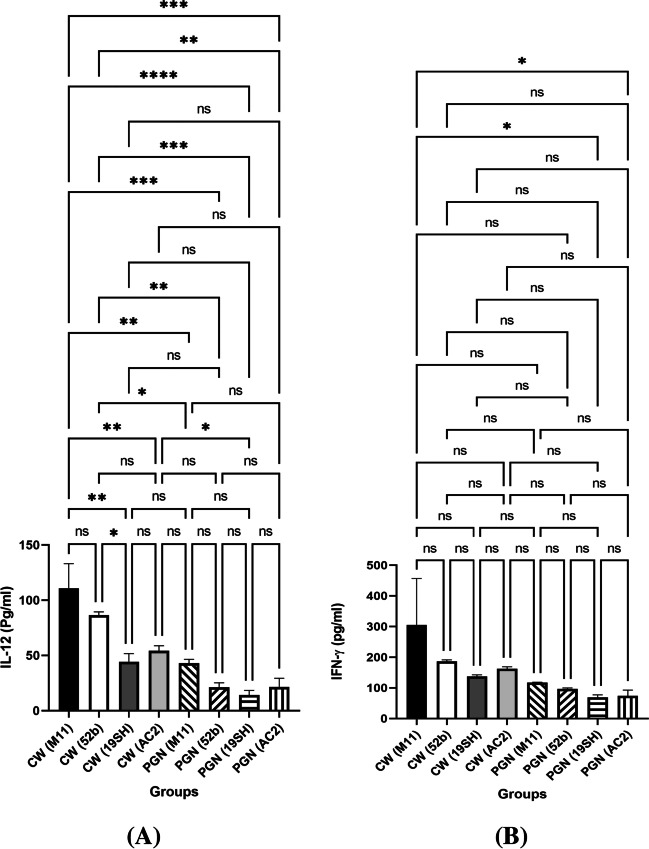
This study aimed to compare the effects of the probiotic bacteria, L. gasseri (52b), L. plantarum (M11), L. acidophilus (AC2), and L. fermentum (19SH), isolated from human source and traditional food products on the modulation of the immune system and inflammatory response on BALB/c mouse model bearing CT26 tumor. Five groups of female inbred BALB/c mice were orally administered with the probiotics and their mixes (MIX, at a 1:1 ratio) at varying dosages (1.5 × 10⁸ cfu/ml and 1.2 × 10⁹ cfu/ml) before and after the injection of a subcutaneous CT26 tumor over the course of 38 days via gavage. Finally, their effects on the tumor apoptosis and the cytokine levels in spleen cell cultures were analyzed and compared. M11, MIX, and 52b groups had the greatest levels of interleukin-12 (IL-12) and interferon gamma (IFN-γ) production. The highest production level of granzyme B (GrB) was related to the MIX and 52b groups. Moreover, these groups showed the lowest production level of (IL-4) and transforming growth factor beta (TGF-β). Furthermore, the groups of MIX and 52b demonstrated the greatest amount of lymphocyte proliferation of spleen cells in response to the tumor antigen. The delayed-type hypersensitivity (DTH) response significantly increased in the groups of MIX and 52b compared with the control (p < 0.05). The findings demonstrated that the oral treatment of the human strain (52b) and the combination of these bacteria generated strong T helper type 1 (Th1) immune responses in the tumor tissue of the tumor-bearing mice, which led to the suppression of the tumor development.
Keywords: Adherence; Colon cancer; Immune system modulation; Interleukin-12; Tumor apoptosis.
© 2023. The Author(s) under exclusive licence to Sociedade Brasileira de Microbiologia.
Conflict of interest statement
The authors declare no competing interests.
Figures
Similar articles
-
Comparison of probiotic Lactobacillus strains isolated from dairy and Iranian traditional food products with those from human source on intestinal microbiota using BALB/C mice model.Braz J Microbiol. 2022 Sep;53(3):1577-1591. doi: 10.1007/s42770-022-00790-6. Epub 2022 Jul 4. Braz J Microbiol. 2022. PMID: 35781865 Free PMC article.
-
Antitumor properties of traditional lactic acid bacteria: Short-chain fatty acid production and interleukin 12 induction.Heliyon. 2024 Aug 13;10(16):e36183. doi: 10.1016/j.heliyon.2024.e36183. eCollection 2024 Aug 30. Heliyon. 2024. PMID: 39253228 Free PMC article.
-
Effect of Lacticaseibacillus rhamnosus and Lactiplantibacillus plantarum isolated from food and human origin on reduction of IgE-dependent hypersensitivity in Balb/c mice.Immunobiology. 2022 Nov;227(6):152292. doi: 10.1016/j.imbio.2022.152292. Epub 2022 Oct 14. Immunobiology. 2022. PMID: 36279620
-
Lactobacillus acidophilus could modulate the immune response against breast cancer in murine model.J Clin Immunol. 2012 Dec;32(6):1353-9. doi: 10.1007/s10875-012-9708-x. Epub 2012 Jun 19. J Clin Immunol. 2012. PMID: 22711009
-
The prophylaxis functions of Lactobacillus fermentum GLF-217 and Lactobacillus plantarum FLP-215 on ulcerative colitis via modulating gut microbiota of mice.J Sci Food Agric. 2024 Aug 15;104(10):5816-5825. doi: 10.1002/jsfa.13410. Epub 2024 Mar 8. J Sci Food Agric. 2024. PMID: 38406876
Cited by
-
A Review of the Role of Paraprobiotics in the Formulation of High-Protein Ice Cream as an Advanced Functional Food.Int J Food Sci. 2025 Jun 17;2025:8875377. doi: 10.1155/ijfo/8875377. eCollection 2025. Int J Food Sci. 2025. PMID: 40557334 Free PMC article. Review.
-
Novel Synergistic Probiotic Intervention: Transcriptomic and Metabolomic Analysis Reveals Ameliorative Effects on Immunity, Gut Barrier, and Metabolism of Mice during Salmonella typhimurium Infection.Genes (Basel). 2024 Mar 29;15(4):435. doi: 10.3390/genes15040435. Genes (Basel). 2024. PMID: 38674370 Free PMC article.
References
-
- Vivarelli S, Falzone L, Basile MS, Nicolosi D, Genovese C, Libra M, et al. Benefits of using probiotics as adjuvants in anticancer therapy. World Acad of Sci. 2019;1(3):125–135. doi: 10.3892/wasj.2019.13. - DOI
-
- Reddy BS, Rivenson A. Inhibitory effect of Bifidobacterium longum on colon, mammary, and liver carcinogenesis induced by 2-amino-3-methylimidazo[4,5-f] quinoline, a food mutagen. Cancer Res. 1993;53:3914e8. - PubMed
MeSH terms
Grants and funding
LinkOut - more resources
Full Text Sources
Medical
Molecular Biology Databases