Costs of reproduction are present but latent in eusocial bumblebee queens
- PMID: 37430246
- PMCID: PMC10334537
- DOI: 10.1186/s12915-023-01648-5
Costs of reproduction are present but latent in eusocial bumblebee queens
Abstract
Background: The standard evolutionary theory of ageing proposes that ageing occurs because of a trade-off between reproduction and longevity. Eusocial insect queens exhibit positive fecundity-longevity associations and so have been suggested to be counter-examples through not expressing costs of reproduction and through remodelling conserved genetic and endocrine networks regulating ageing and reproduction. If so, eusocial evolution from solitary ancestors with negative fecundity-longevity associations must have involved a stage at which costs of reproduction were suppressed and fecundity and longevity became positively associated. Using the bumblebee (Bombus terrestris), we experimentally tested whether queens in annual eusocial insects at an intermediate level of eusocial complexity experience costs of reproduction, and, using mRNA-seq, the extent to which they exhibit a remodelling of relevant genetic and endocrine networks. Specifically, we tested whether costs of reproduction are present but latent, or whether a remodelling of relevant genetic and endocrine networks has already occurred allowing queens to reproduce without costs.
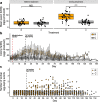
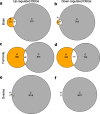
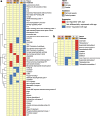
Results: We experimentally increased queens' costs of reproduction by removing their eggs, which caused queens to increase their egg-laying rate. Treatment queens had significantly reduced longevity relative to control queens whose egg-laying rate was not increased. Reduced longevity in treatment queens was not caused by increased worker-to-queen aggression or by increased overall activity in queens. In addition, treatment and control queens differed in age-related gene expression based on mRNA-seq in both their overall expression profiles and the expression of ageing-related genes. Remarkably, these differences appeared to occur principally with respect to relative age, not chronological age.
Conclusions: This study represents the first simultaneously phenotypic and transcriptomic experimental test for a longevity cost of reproduction in eusocial insect queens. The results support the occurrence of costs of reproduction in annual eusocial insects of intermediate social complexity and suggest that reproductive costs are present but latent in queens of such species, i.e. that these queens exhibit condition-dependent positive fecundity-longevity associations. They also raise the possibility that a partial remodelling of genetic and endocrine networks underpinning ageing may have occurred in intermediately eusocial species such that, in unmanipulated conditions, age-related gene expression depends more on chronological than relative age.
Keywords: Age-related gene expression; Bombus terrestris; Costs of reproduction; Eusociality; Evolutionary theory of ageing; mRNA-seq.
© 2023. The Author(s).
Conflict of interest statement
The authors declare that they have no competing interests.
Figures


Similar articles
-
Evolution of ageing, costs of reproduction and the fecundity-longevity trade-off in eusocial insects.Proc Biol Sci. 2017 Jul 12;284(1858):20170380. doi: 10.1098/rspb.2017.0380. Proc Biol Sci. 2017. PMID: 28701554 Free PMC article.
-
Queen Longevity and Fecundity Affect Conflict with Workers over Resource Inheritance in a Social Insect.Am Nat. 2019 Feb;193(2):256-266. doi: 10.1086/701299. Epub 2018 Dec 26. Am Nat. 2019. PMID: 30720369
-
Transcriptomic Signatures Mirror the Lack of the Fecundity/Longevity Trade-Off in Ant Queens.Mol Biol Evol. 2015 Dec;32(12):3173-85. doi: 10.1093/molbev/msv186. Epub 2015 Sep 3. Mol Biol Evol. 2015. PMID: 26341296 Free PMC article.
-
Termite primary queen - ancestral, but highly specialized eusocial phenotype.Curr Opin Insect Sci. 2024 Feb;61:101157. doi: 10.1016/j.cois.2023.101157. Epub 2023 Dec 23. Curr Opin Insect Sci. 2024. PMID: 38142979 Review.
-
Endocrine uncoupling of the trade-off between reproduction and somatic maintenance in eusocial insects.Curr Opin Insect Sci. 2016 Aug;16:1-8. doi: 10.1016/j.cois.2016.04.013. Epub 2016 Apr 29. Curr Opin Insect Sci. 2016. PMID: 27720042 Review.
Cited by
-
Developmental Diet Alters the Fecundity-Longevity Relationship and Age-Related Gene Expression in Drosophila melanogaster.J Gerontol A Biol Sci Med Sci. 2023 Dec 1;78(12):2240-2250. doi: 10.1093/gerona/glad199. J Gerontol A Biol Sci Med Sci. 2023. PMID: 37584665 Free PMC article.
-
Gyne production is regulated by the brood in a social bee (Bombus impatiens).R Soc Open Sci. 2025 Aug 6;12(8):241906. doi: 10.1098/rsos.241906. eCollection 2025 Aug. R Soc Open Sci. 2025. PMID: 40771662 Free PMC article.
-
Molecular Basis of Eusocial Complexity: The Case of Worker Reproductivity in Bees.Genome Biol Evol. 2024 Dec 4;16(12):evae269. doi: 10.1093/gbe/evae269. Genome Biol Evol. 2024. PMID: 39663835 Free PMC article.
-
Ageing effects of social environments in 'non-social' insects.Philos Trans R Soc Lond B Biol Sci. 2024 Dec 16;379(1916):20220463. doi: 10.1098/rstb.2022.0463. Epub 2024 Oct 28. Philos Trans R Soc Lond B Biol Sci. 2024. PMID: 39463243 Free PMC article.
-
Age-resistant worker reproductive potential and effect of helpers on prolonged lifespan in an ant.BMC Biol. 2025 Jul 2;23(1):198. doi: 10.1186/s12915-025-02305-9. BMC Biol. 2025. PMID: 40604948 Free PMC article.
References
-
- Williams GC. Pleiotropy, natural selection, and the evolution of senescence. Evolution (N Y) 1957;11:398–411.
-
- Stearns SC. The evolution of life histories. Oxford: Oxford University Press; 1992.
Publication types
MeSH terms
Substances
Grants and funding
LinkOut - more resources
Full Text Sources
Molecular Biology Databases

