. 2023 Jul 10;21(1):170.
doi: 10.1186/s12964-023-01124-1.

A novel interface between the N-terminal and coiled-coil domain of STAT1 functions in an auto-inhibitory manner

Affiliations

A novel interface between the N-terminal and coiled-coil domain of STAT1 functions in an auto-inhibitory manner

Linus Remling et al. Cell Commun Signal. .

Abstract

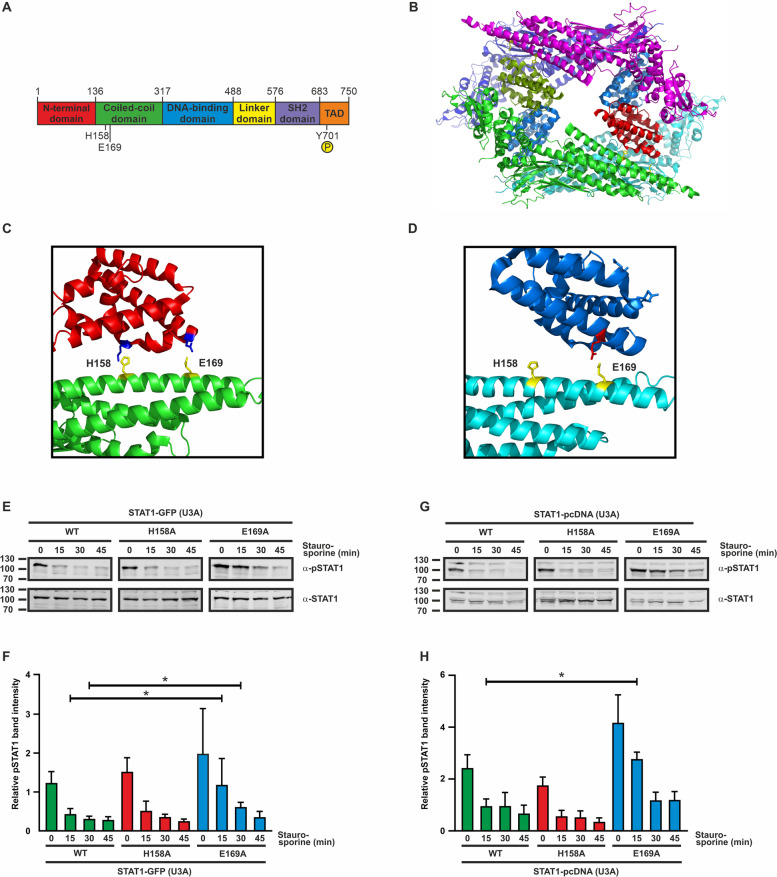
Background: STAT1 is an intracellular signaling molecule that is crucially involved in the regulation of the innate immune system by activation of defense mechanisms against microbial pathogens. Phosphorylation-dependent activation of the STAT1 transcription factor is associated with a conversion from an antiparallel to parallel dimer configuration, which after nuclear import binds to DNA. However, not much is known about the specific intermolecular interactions that stabilize unphosphorylated, antiparallel STAT1 complexes prior to activation.

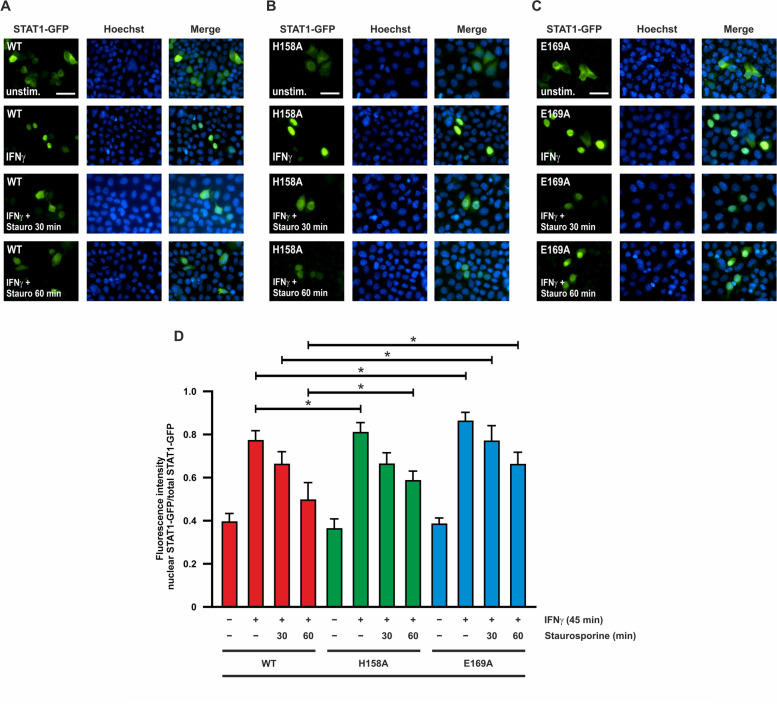
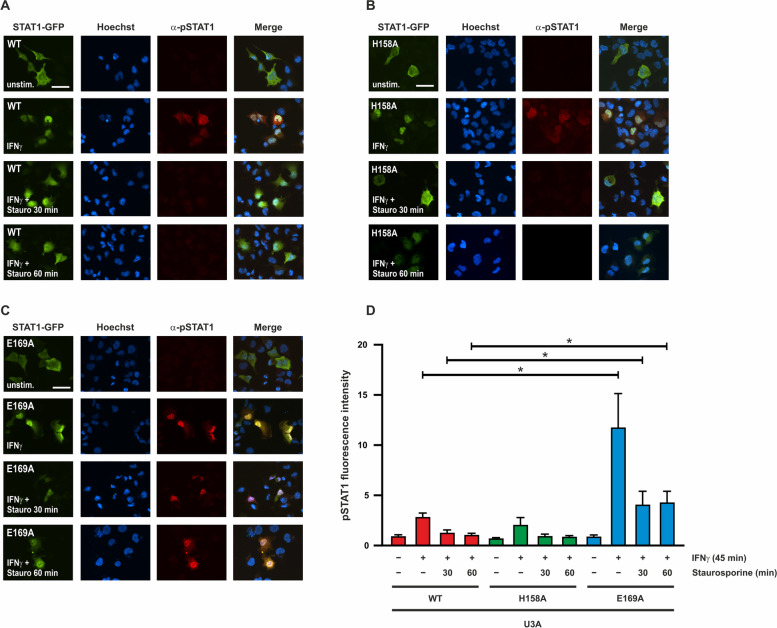
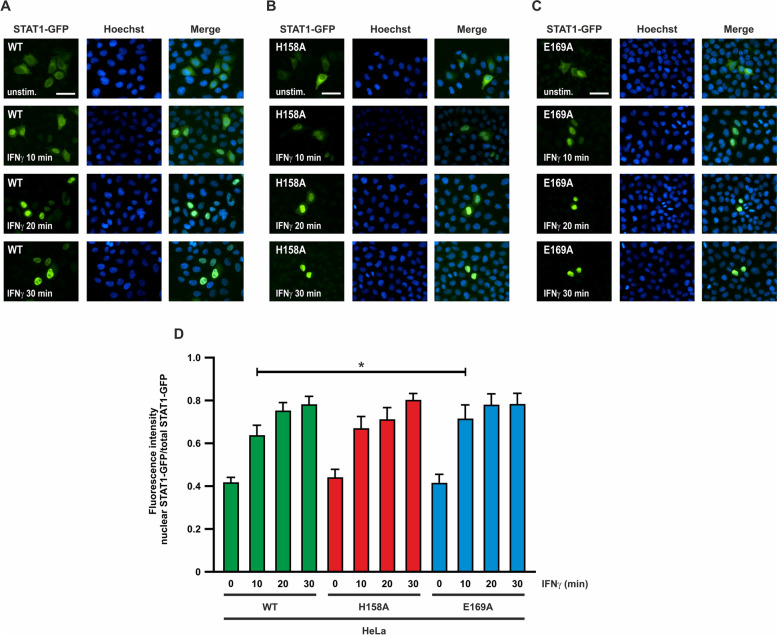
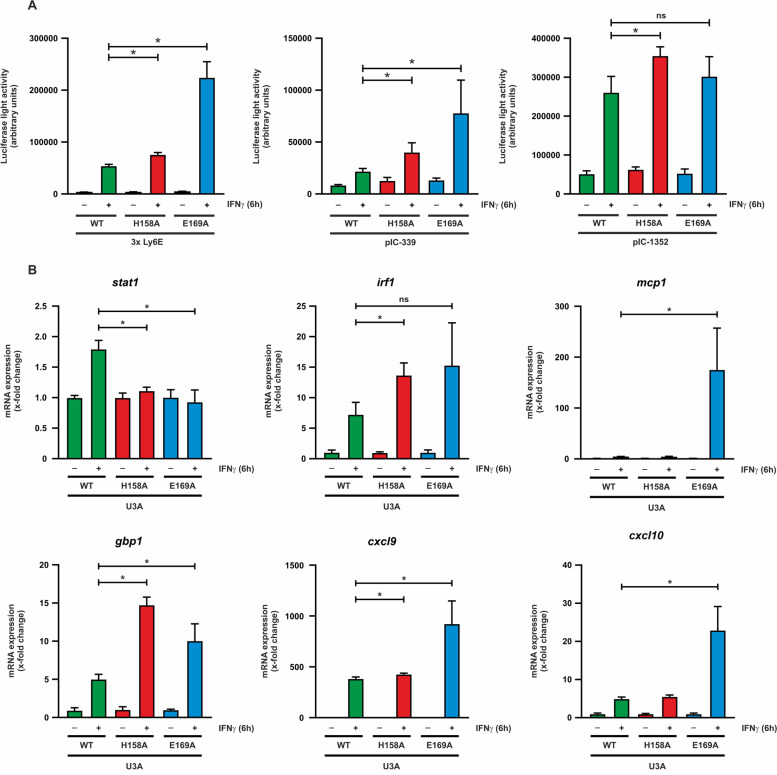
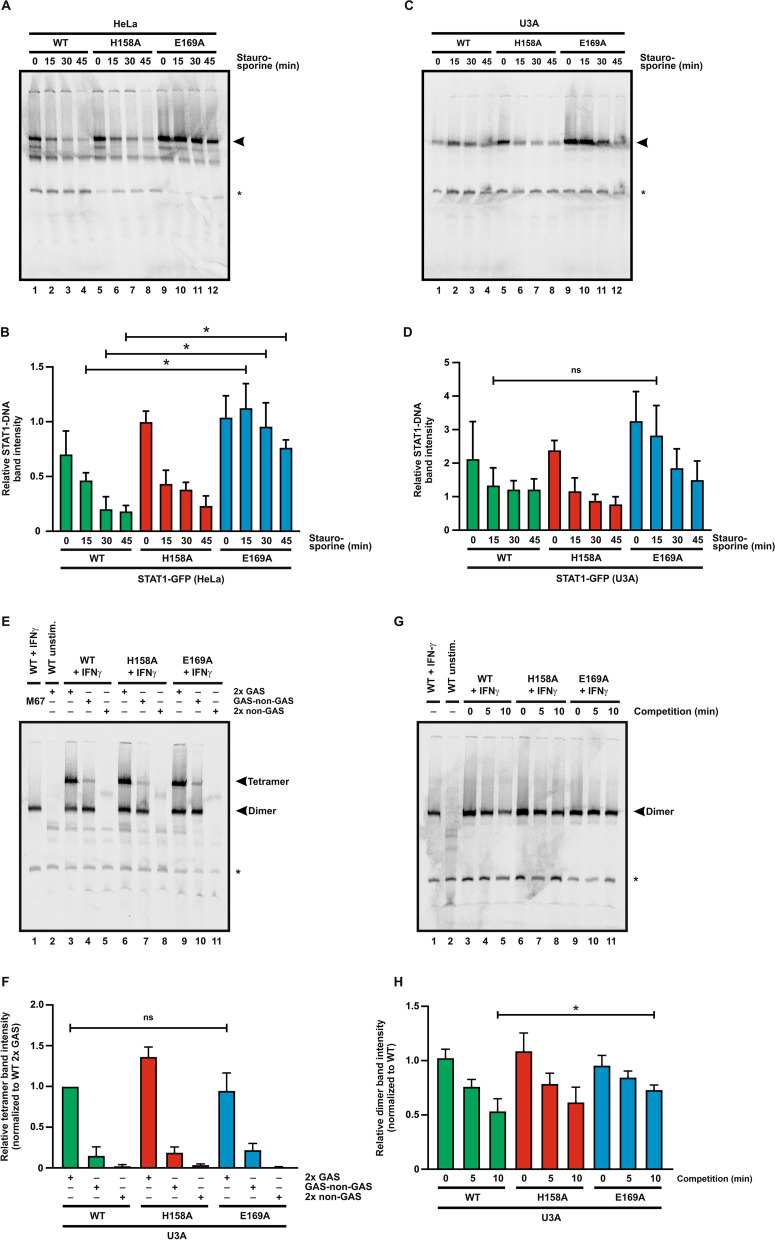
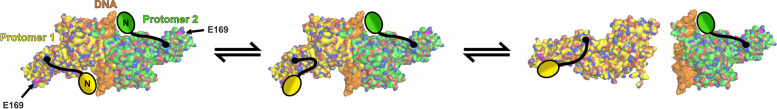
Results: In this study, we identified a previously unknown interdimeric interaction site, which is involved in the termination of STAT1 signaling. Introduction of the glutamic acid-to-alanine point mutation E169A in the coiled-coil domain (CCD) by site-directed mutagenesis led to increased tyrosine phosphorylation as well as accelerated and prolonged nuclear accumulation in transiently transfected cells. In addition, DNA-binding affinity and transcriptional activity were strongly enhanced in the substitution mutant compared to the wild-type (WT) protein. Furthermore, we have demonstrated that the E169 residue in the CCD mediates the release of the dimer from the DNA in an auto-inhibitory manner.

Conclusion: Based on these findings, we propose a novel mechanism for the inactivation of the STAT1 signaling pathway, assigning the interface with the glutamic acid residue 169 in the CCD a crucial role in this process. Video Abstract.

Keywords: Cytokine response; Gene expression; Interferon signaling; STAT signaling; Signal transduction.


Conflict of interest statement

The authors declare no competing interests.

Figures

Fig. 1
Fig. 1
Hyper-phosphorylation of the STAT1-E169A mutant. A Domain structure of the STAT1 protein including the localization of residues H158 and E169 and phosphorylation site Y701. SH2 = Src-homology 2, TAD = transactivation domain. B Crystal structure of the STAT1 tetramer, with side chains H158 and E169 in the coiled-coil domain highlighted in yellow. Protein crystal structure renderings from the Protein Data Bank file 1YVL [25] were generated using the PyMOL software (DeLano Scientific). C Close-up view of the investigated interface of the front-facing protomer. Residues H158A and E169A in the coiled-coil domain (green) are marked in yellow and the putative interaction partners in the amino-terminus (red) are shown in blue. D The interface at the back of the tetrameric structure (as shown in B) between the coiled-coil domain (cyan) and the N-terminus (dark blue). E Representative immunoblot from whole cell extracts expressing STAT1-GFP constructs. U3A cells expressing fusions of green fluorescent protein with WT or mutant STAT1 were stimulated with 50 ng/ml IFNγ for 45 min, followed by incubation with the kinase inhibitor staurosporine (1 µM) for the indicated times. Immunoblotting was performed using phospho-tyrosine-specific (α-pSTAT1) and pan-STAT1 (α-STAT1) antibodies. F Quantification of immunoblotting results from three independent transfection experiments as shown in (E). Asterisks indicate significant difference between the WT protein and the respective mutant. G, H Representative Western blot from whole cell extracts expressing the indicated untagged STAT1 proteins (G), including quantification of results thereof from three independent transfection experiments (H)
Fig. 2
Fig. 2
Tyrosine-phosphorylated STAT1-E169A shows prolonged nuclear accumulation. HeLa cells expressing fusion proteins of STAT1-WT (A) or the H158A (B) and E169A (C) mutants were either left unstimulated or stimulated with 50 ng/ml IFNγ for 45 min, this being followed by incubation with staurosporine (1 µM) for the indicated times (scale bar corresponds to 50 µm). D Quantification of the results from Fig. 2A–C. STAT1-GFP fluorescence intensity data from n = 20 cells are shown as the ratio of nuclear-to-total STAT1. Asterisks indicate significant differences between the WT protein and the respective mutant
Fig. 3
Fig. 3
STAT1-E169A retains high levels of tyrosine phosphorylation and nuclear localization. U3A cells expressing fusion proteins of WT (A) or mutant (B, C) STAT1 were either not stimulated or stimulated with 50 ng/ml IFNγ for 45 min before incubation with 1 µM staurosporine for the indicated times (scale bar corresponds to 50 µm). D Quantification of the results from Fig. 3A–C. Total fluorescence intensity of tyrosine-phosphorylated STAT1 was measured from n = 20 cells in each experiment. Asterisks indicate significant differences in the tyrosine-phosphorylation level between the WT protein and the E169A mutant
Fig. 4
Fig. 4
Nuclear accumulation of the STAT1-E169A mutant is accelerated after IFNγ stimulation. HeLa cells expressing fusion proteins of STAT1-WT (A) or the H158A (B) and E169A (C) mutants were either left unstimulated or stimulated with 50 ng/ml IFNγ for the indicated times (scale bar corresponds to 50 µm). D Quantification of the results from Fig. 4A–C. STAT1-GFP fluorescence intensity data from n = 20 cells are plotted as the ratio of nuclear-to-total STAT1. Asterisks indicate significant differences between the WT protein and the respective mutant
Fig. 5
Fig. 5
The STAT1-E169A mutation increases transcriptional activity of target genes. A U3A cells coexpressing fusion proteins of WT or mutant STAT1 with a luciferase reporter gene coupled to a 3xLy6E, pIC-339 or pIC-1352 promoter were stimulated for 6 h with 50 ng/ml IFNγ. The data are normalized to β-galactosidase coexpression. B mRNA levels of endogenous STAT1 target genes in IFNγ-stimulated U3A cells expressing WT or mutant STAT1, obtained by qPCR. Asterisks indicate significant differences between the WT protein and the respective mutant
Fig. 6
Fig. 6
STAT1-E169A binds to DNA with high affinity. HeLa or U3A cells expressing fusion proteins of WT or mutant STAT1 were left unstimulated or stimulated with 50 ng/ml IFNγ for 45 min, and DNA-binding properties were assessed using different DNA probes containing GAS motifs. A Representative autoradiogram from HeLa whole cell extracts. HeLa cells were treated with IFNγ for 45 min and subsequently with staurosporine for the indicated times, and whole cell extracts were incubated with M67 probe for 5 min on ice before undergoing electrophoresis. The arrow indicates bands of STAT1-DNA complexes, and the asterisk marks an unspecific band. B Quantification of EMSA results from three independent transfection experiments as shown in (A). C, D Representative autoradiogram from U3A whole cell extracts expressing the indicated untagged STAT1 proteins (C), including quantification of results thereof from three independent transfection experiments (D). E Representative autoradiogram from U3A whole cell extracts. Samples were incubated for 5 min on ice prior to electrophoresis with DNA probes containing either no (2 × non-GAS), one (GAS-nonGAS) or two GAS sites (2 × GAS), as indicated. The asterisk marks a non-specific band. F Quantification of EMSA results from three independent transfection experiments as shown in (E). G Representative autoradiogram from U3A whole cell extracts using a competition EMSA experiment. Samples were incubated with the labeled M67 probe on ice for 30 min and then challenged with a 750-fold excess of unlabeled M67 probe for the indicated times. The asterisk marks a non-specific band. H Quantification of EMSA results from three independent transfection experiments as shown in (G). In all graphs, asterisks indicate significant differences between the WT protein and the respective mutant
Fig. 7
Fig. 7
A novel mechanism for the dissociation of STAT1 from DNA through auto-inhibition. Surface representation of a tyrosine-phosphorylated parallel STAT1 dimer (yellow + green) binding to DNA (orange). The position of the respective N-terminal domains (N) is approximated. The critical amino acid position E169 (magenta) in the CCD is marked with arrows. According to the model, binding of the N-terminus to the E169 residue of its own core fragment facilitates dissociation from DNA

Similar articles

Cited by

References

    1. Stark GR, Kerr IM, Williams BR, Silverman RH, Schreiber RD. How cells respond to interferons. Annu Rev Biochem. 1998;67(1):227–264. doi: 10.1146/annurev.biochem.67.1.227. - DOI - PubMed
    1. Darnell JE. STATs and gene regulation. Science. 1997;277(5332):1630–1635. doi: 10.1126/science.277.5332.1630. - DOI - PubMed
    1. Levy DE, Darnell JE., Jr Stats: transcriptional control and biological impact. Nat Rev Mol Cell Biol. 2002;3(9):651–662. doi: 10.1038/nrm909. - DOI - PubMed
    1. Chen X, Vinkemeier U, Zhao Y, Jeruzalmi D, Darnell JE, Kuriyan J. Crystal Structure of a tyrosine-phosphorylated STAT-1 dimer bound to DNA. Cell. 1998;93(5):827–839. doi: 10.1016/S0092-8674(00)81443-9. - DOI - PubMed
    1. McBride KM, Banninger G, McDonald C, Reich NC. Regulated nuclear import of the STAT1 transcription factor by direct binding of importin-α. EMBO J. 2002;21(7):1754–1763. doi: 10.1093/emboj/21.7.1754. - DOI - PMC - PubMed

Publication types