. 2023 Jul 10;21(1):171.
doi: 10.1186/s12964-023-01186-1.

Extracellular vesicle-associated tyrosine kinase-like orphan receptors ROR1 and ROR2 promote breast cancer progression

Affiliations

Extracellular vesicle-associated tyrosine kinase-like orphan receptors ROR1 and ROR2 promote breast cancer progression

Barnabas Irmer et al. Cell Commun Signal. .

Abstract

Background: Extracellular vesicles (EVs) harbor a plethora of different biomolecules, which they can transport across cells. In cancer, tumor-derived EVs thereby support the creation of a favorable tumor microenvironment. So far, EV uptake and cargo delivery into target cells have been regarded as the main mechanisms for the pro-tumoral function of EVs. To test this hypothesis, we investigated the fate of the oncogenic transmembrane Wnt tyrosine kinase-like orphan receptor 1 and 2 (ROR1, ROR2) delivered via distinct EV subpopulations to breast cancer cells and aimed to unravel their impact on tumor progression.

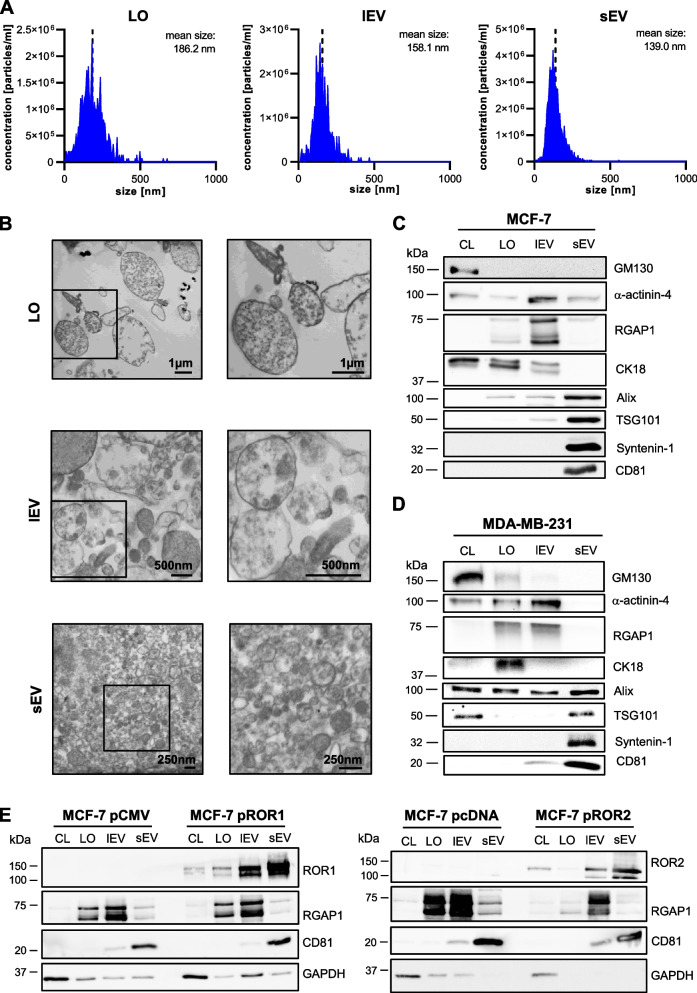
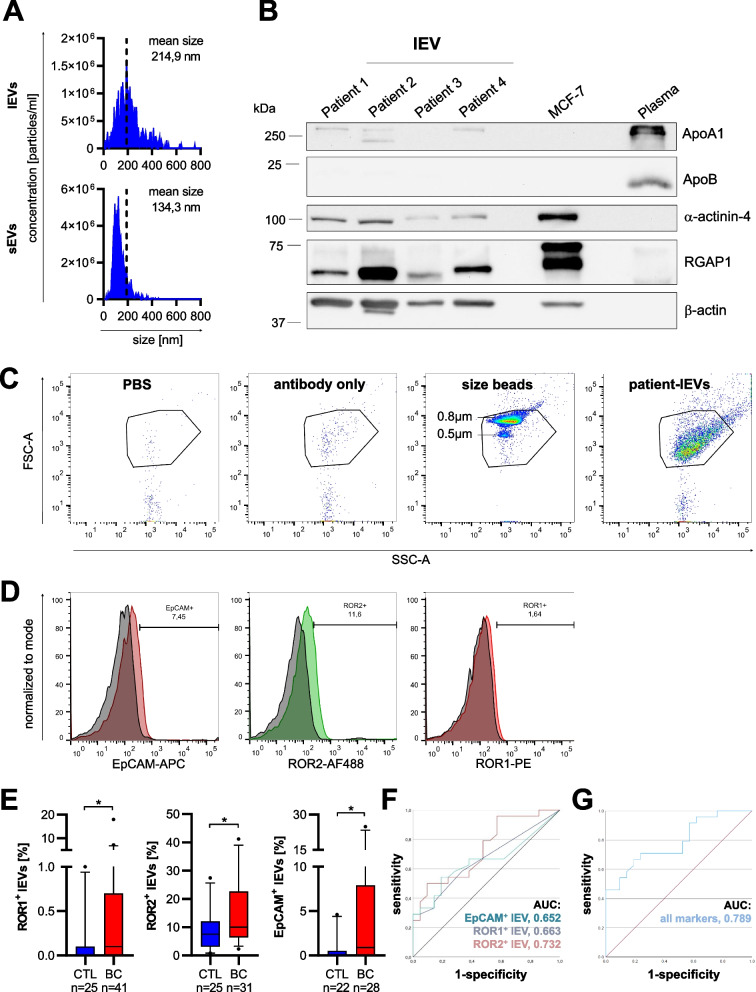
Methods: EVs were isolated by differential ultracentrifugation from cell culture supernatant as well as plasma samples from healthy individuals (n = 27) and breast cancer patients (n = 41). EVs were thoroughly characterized by electron microscopy, nanoparticle tracking analysis, immunoblot, and flow cytometry. ROR transfer to target cells was observed using microscopy-based assays and biodistribution experiments were conducted in syngeneic mice. EV impact on cancer cell migration and invasion was tested in functional assays.

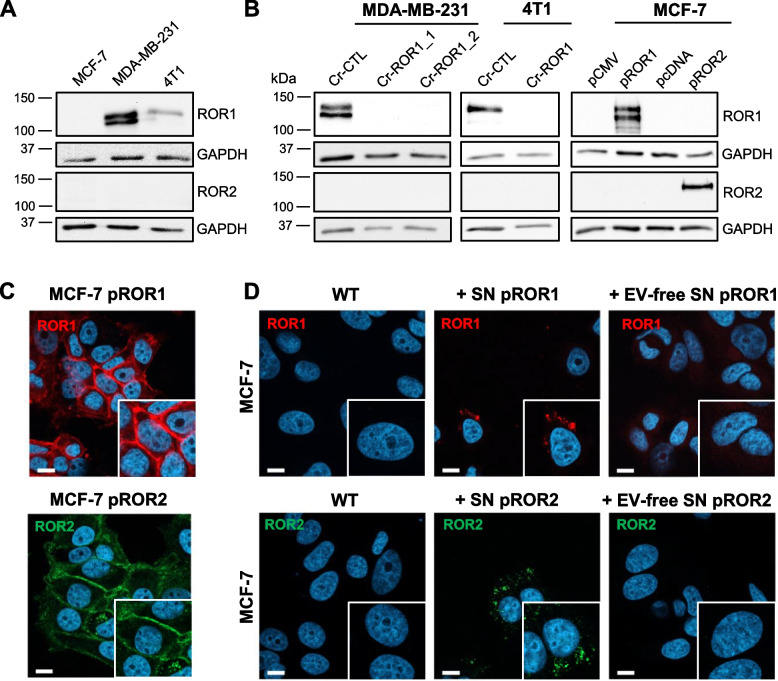
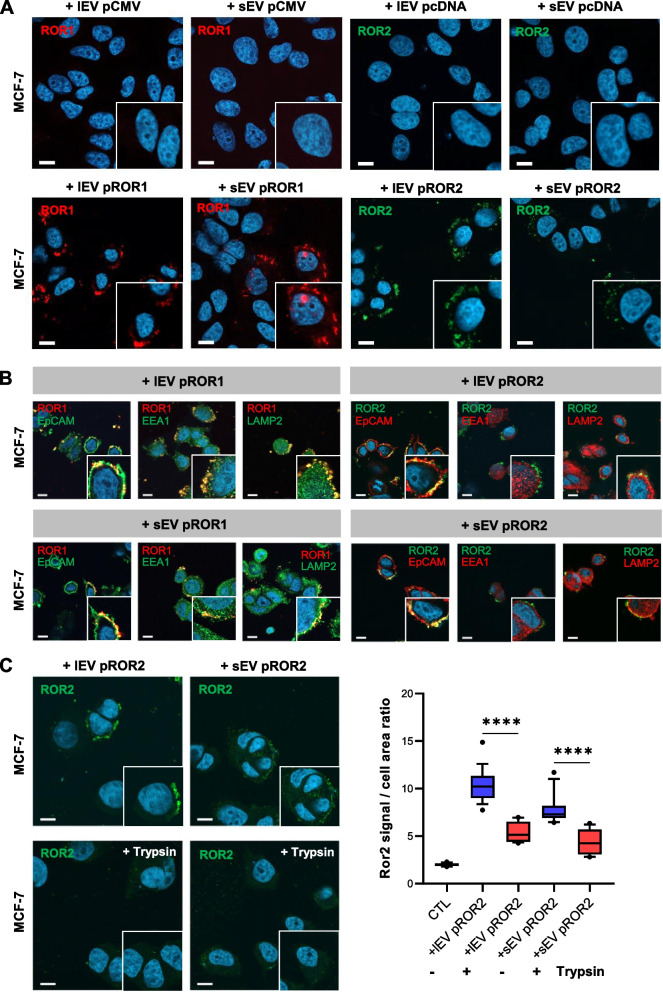
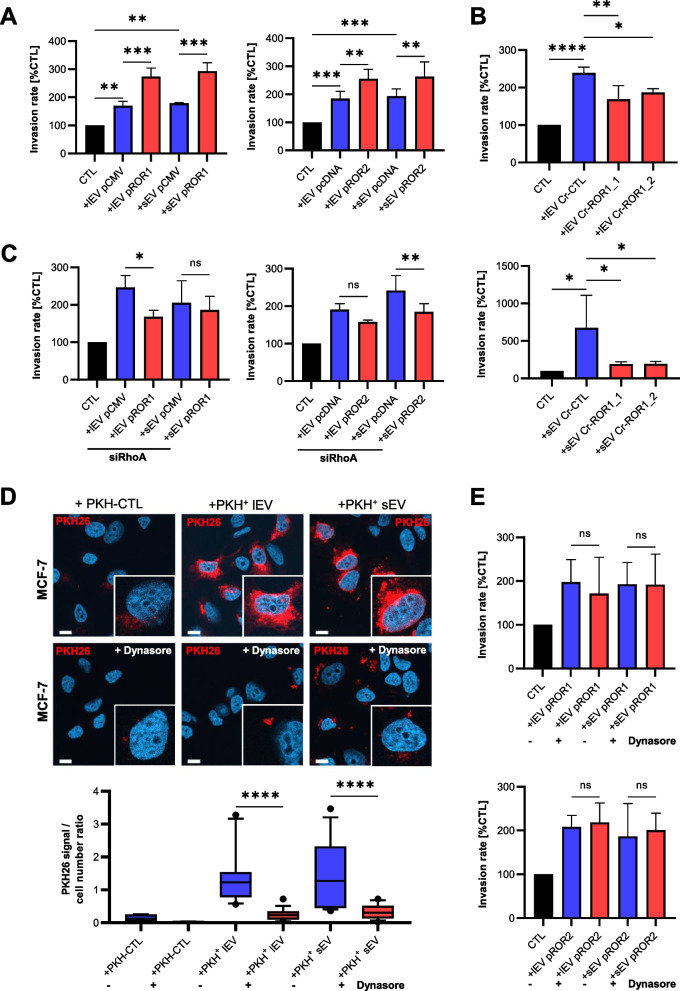
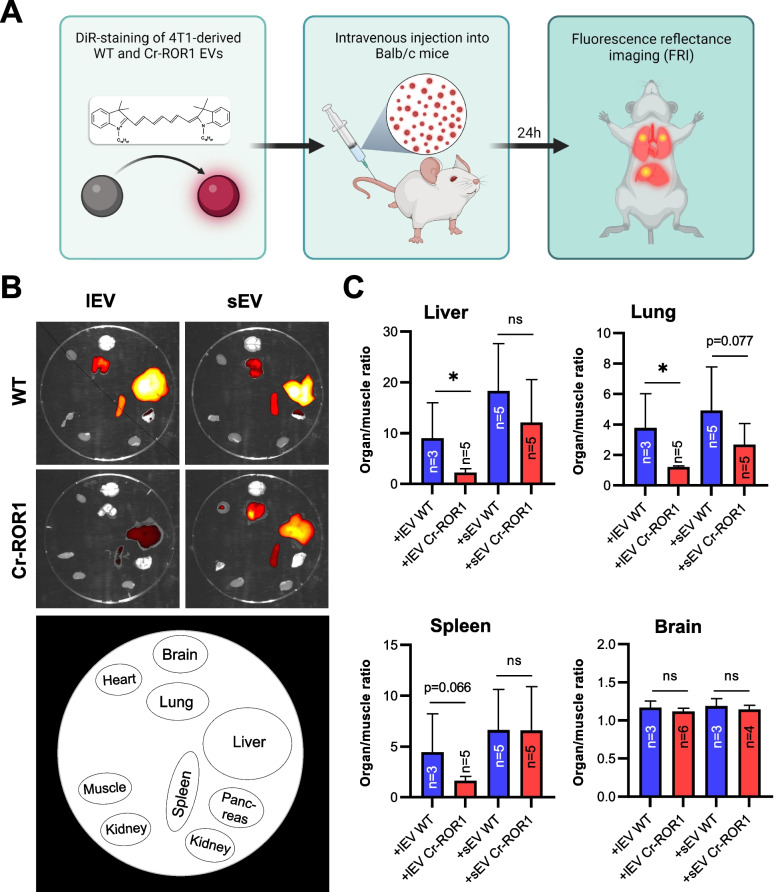
Results: We observed that the supernatant of ROR-overexpressing cells was sufficient for transferring the receptors to ROR-negative cells. Analyzing the secretome of the ROR-overexpressing cells, we detected a high enrichment of ROR1/2 on large and small EVs, but not on large oncosomes. Interestingly, the majority of ROR-positive EVs remained attached to the target cell surface after 24 h of stimulation and was quickly removed by treatment with trypsin. Nonetheless, ROR-positive EVs increased migration and invasion of breast cancer cells, even after chemically inhibiting EV uptake, in dependence of RhoA downstream signaling. In vivo, ROR-depleted EVs tended to distribute less into organs prone for the formation of breast cancer metastases. ROR-positive EVs were also significantly elevated in the plasma of breast cancer patients and allowed to separate them from healthy controls.

Conclusions: The oncogenic Wnt receptors ROR1/2 are transferred via EVs to the surface of ROR-negative cancer cells, in which they induce an aggressive phenotype supporting tumor progression. Video Abstract.


Conflict of interest statement

The authors declare no competing interests.

Figures

Fig. 1
Fig. 1
Supernatant of ROR1/2-overexpressing MCF-7 cells is sufficient to transfer receptors to originally ROR-negative cells. A Western blot: Expression of ROR1 and ROR2 in breast cancer cells. B Western blot: Expression of ROR1 and ROR2 in MDA-MB-231 and 4T1 CRISPR control (Cr-CTL) or ROR1 KO (Cr-ROR1) cells or MCF-7 cells stably overexpressing either an empty vector (pCMV, pcDNA) or ROR1/ROR2 overexpression construct (pROR1/pROR2). C Immunofluorescence: Localization of ROR1 or ROR2 in MCF-7 pROR1 or pROR2, respectively, was imaged by confocal microscopy. D ROR-negative MCF-7 wildtype (WT) cells were stimulated with supernatant (SN) of pROR1 or pROR2 cells and ROR1/2 signals were visualized by immunofluorescence and confocal microscopy. To generate EV-free SN, the SN was centrifuged for 2 h at 143,000 × g. Scale bar: 10 µm
Fig. 2
Fig. 2
ROR1 and ROR2 are enriched on tumor-derived lEVs and sEVs. A NTA of the three different EV subpopulations harvested from MCF-7 wildtype cells. B TEM of the MCF-7 EV subpopulations. The image on the left displays a wide-field overview of the sample. The panel on the right contains a close-up of the area marked with a black box in the wide-field image. C + D Western blot: Characterization of EVs isolated from (C) MCF-7 and (D) MDA-MB-231 wildtype cells for common EV markers. GM130 is shown as a negative marker. Equal amounts of protein were loaded in every lane. E Western blot: ROR1 or ROR2 expression on EVs harvested from MCF-7 cells transfected with ROR1/2-overexpression vectors (pROR1/pROR2) or respective empty vectors (pCMV/pcDNA). CD81 served as sEV marker, RGAP1 as marker for LOs and lEVs. Equal amounts of protein were loaded in every lane
Fig. 3
Fig. 3
EV-delivered ROR1/2 mainly accumulates at the extracellular site of the target cell plasma membrane after 24 h. A Immunofluorescence: MCF-7 cells were stimulated for 24 h with 10 µg/ml lEVs or sEVs from empty vector control (pCMV/pcDNA) or ROR1/2 overexpressing (pROR1/pROR2) cells and ROR signals were visualized by confocal microscopy. Scale bar: 10 µm. B Confocal microscopy: Immunofluorescence-based co-localization of ROR1/2 with EpCAM, EEA1 or LAMP2 in MCF-7 cells stimulated for 24 h with lEVs (upper panel) or sEVs (lower panel) isolated from MCF-7 pROR1 or pROR2 cells. Scale bar: 10 µm. C MCF-7 cells were stimulated with EVs from pROR2 cells for 24 h, then treated with/without trypsin for 90 s at 37 °C (n = 3). Boxplots depict the median (line), the 25–75 percentiles (box) and the 10–90 percentiles (whiskers) of n = 15 quantified fields. Scale bar: 10 µm
Fig. 4
Fig. 4
Stimulation with EVs derived from ROR1/2-overexpressing cells increases tumor invasion dependent on RhoA. A + B Boyden chamber invasion assays of MCF-7 cells after stimulation with (A) EVs isolated from MCF-7 empty vector (pCMV/pcDNA) or ROR1/2-overexpressing (pROR1/pROR2) cells or (B) EVs from MDA-MB-231 CRISPR control (Cr-CTL) or ROR1 KO (Cr-ROR1) cells (mean ± SD, n = 3). C Boyden chamber invasion assays of MCF-7 cells transfected with siRNA against RhoA (10 nM) 24 h prior to stimulation with EVs isolated from MCF-7 empty vector (pCMV/pcDNA) or ROR1/2-overexpressing (pROR1/pROR2) cells (mean ± SD, n = 2). D Immunofluorescence: MCF-7 cells were pre-treated with/without dynasore (12.5 µM) for 2 h and uptake of PKH26-labeled EVs or dye-only (PKH-CTL) into the cells was visualized by confocal microscopy (n = 3). Signals were quantified with ImageJ. Boxplots depict the median (line), the 25–75 percentiles (box) and the 10–90 percentiles (whiskers) of n = 15 quantified fields. Scale bar: 10 µm. E Boyden chamber invasion assay of MCF-7 stimulated with pROR1/pROR2 EVs after pre-treatment of the cells with/without dynasore (12.5 µM) for 2 h (mean ± SD, n = 3)
Fig. 5
Fig. 5
Knockout of ROR1 alters the biodistribution of tumor EVs in mice. A Schematic representation of the biodistribution experiments. The figure was created with BioRender.com B + C Exemplary ex vivo FRI images (B) of mice organs 24 h after the injection of DiR-labeled 4T1 wildtype (WT) or ROR1 knockout (ROR1-KO) EVs and corresponding quantification of the ratio of mean signal intensities organ to muscle (C) for selected organs harboring fluorescent signals (mean ± SD). Significance was tested with a one-sided studen’t t test
Fig. 6
Fig. 6
ROR-EVs are novel biomarkers for breast cancer. A Representative NTA of lEVs and sEVs isolated from peripheral blood of a breast cancer (BC) patient. B lEVs from four BC patients were characterized by western blot for the expression of common lEV markers (α-actinin-4, RGAP1, ꞵ-Actin) or lipoprotein contaminants (ApoA1, ApoB). C Flow cytometry of patient-derived lEVs including PBS + 1%EV-depleted FCS, ROR2 antibody-only or size beads as controls. D + E The percentage of lEVs carrying the tumor-related antigens ROR1, ROR2, or EpCAM isolated from healthy controls (CTL) or BC patients was measured by flow cytometry. Shown are representatives histograms from one breast cancer patient for each marker (D) as well as the quantification from all analyzed samples (E). Boxes mark the 25–75 percentiles (line at median) and whiskers the 5–95 percentile. Significance was calculated with a Mann–Whitney test. F + G ROC analyses of EV-associated ROR1, ROR2 and EpCAM alone (E) or of all three markers combined (F)

References

    1. Sung H, Ferlay J, Siegel RL, Laversanne M, Soerjomataram I, Jemal A, et al. Global cancer statistics 2020: GLOBOCAN estimates of incidence and mortality worldwide for 36 cancers in 185 countries. CA Cancer J Clin. 2021;71:209–249. doi: 10.3322/caac.21660. - DOI - PubMed
    1. Xu X, Zhang M, Xu F, Jiang S. Wnt signaling in breast cancer: biological mechanisms, challenges and opportunities. Mol Cancer. 2020;19:165. doi: 10.1186/s12943-020-01276-5. - DOI - PMC - PubMed
    1. Menck K, Heinrichs S, Baden C, Bleckmann A. The WNT/ROR pathway in cancer: from signaling to therapeutic intervention. Cells. 2021;10:142. doi: 10.3390/cells10010142. - DOI - PMC - PubMed
    1. Klemm F, Bleckmann A, Siam L, Chuang HN, Rietkötter E, Behme D, et al. β-catenin-independent WNT signaling in basal-like breast cancer and brain metastasis. Carcinogenesis. 2011;32:434–442. doi: 10.1093/carcin/bgq269. - DOI - PubMed
    1. Zhang S, Chen L, Cui B, Chuang H-Y, Yu J, Wang-Rodriguez J, et al. ROR1 is expressed in human breast cancer and associated with enhanced tumor-cell growth. PLoS ONE. 2012;7:e31127. doi: 10.1371/journal.pone.0031127. - DOI - PMC - PubMed

Publication types