. 2023 Jul 10;30(1):52.
doi: 10.1186/s12929-023-00947-x.

Neutrophil-derived reactive agents induce a transient SpeB negative phenotype in Streptococcus pyogenes

Collaborators, Affiliations

Neutrophil-derived reactive agents induce a transient SpeB negative phenotype in Streptococcus pyogenes

Patience Shumba et al. J Biomed Sci. .

Abstract

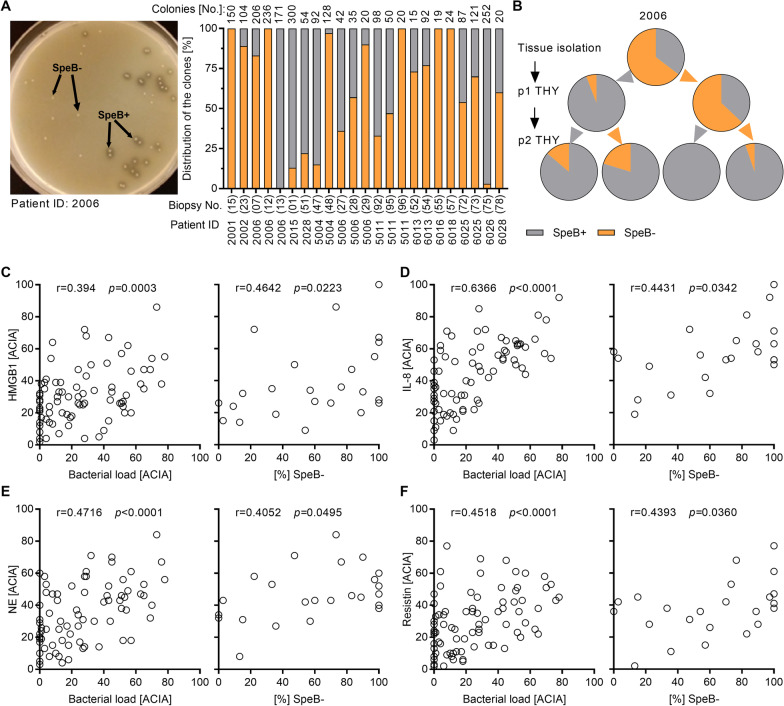
Background: Streptococcus pyogenes (group A streptococci; GAS) is the main causative pathogen of monomicrobial necrotizing soft tissue infections (NSTIs). To resist immuno-clearance, GAS adapt their genetic information and/or phenotype to the surrounding environment. Hyper-virulent streptococcal pyrogenic exotoxin B (SpeB) negative variants caused by covRS mutations are enriched during infection. A key driving force for this process is the bacterial Sda1 DNase.

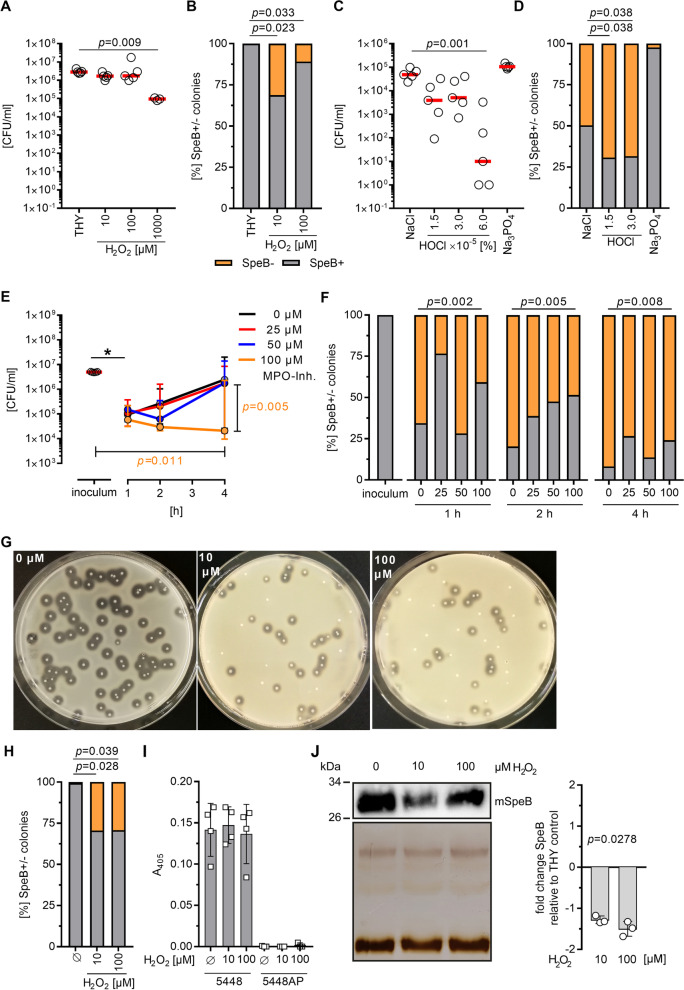
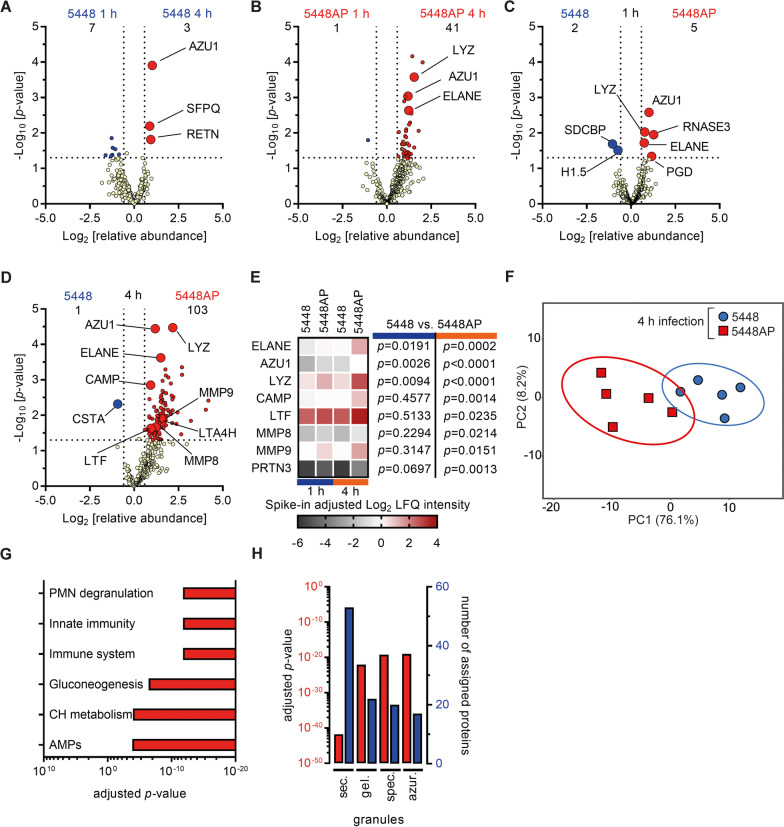
Methods: Bacterial infiltration, immune cell influx, tissue necrosis and inflammation in patient´s biopsies were determined using immunohistochemistry. SpeB secretion and activity by GAS post infections or challenges with reactive agents were determined via Western blot or casein agar and proteolytic activity assays, respectively. Proteome of GAS single colonies and neutrophil secretome were profiled, using mass spectrometry.

Results: Here, we identify another strategy resulting in SpeB-negative variants, namely reversible abrogation of SpeB secretion triggered by neutrophil effector molecules. Analysis of NSTI patient tissue biopsies revealed that tissue inflammation, neutrophil influx, and degranulation positively correlate with increasing frequency of SpeB-negative GAS clones. Using single colony proteomics, we show that GAS isolated directly from tissue express but do not secrete SpeB. Once the tissue pressure is lifted, GAS regain SpeB secreting function. Neutrophils were identified as the main immune cells responsible for the observed phenotype. Subsequent analyses identified hydrogen peroxide and hypochlorous acid as reactive agents driving this phenotypic GAS adaptation to the tissue environment. SpeB-negative GAS show improved survival within neutrophils and induce increased degranulation.

Conclusions: Our findings provide new information about GAS fitness and heterogeneity in the soft tissue milieu and provide new potential targets for therapeutic intervention in NSTIs.

Keywords: Necrotizing soft tissue infections; Neutrophils; SpeB; Streptococcus pyogenes.


Figures

Fig. 1
Fig. 1
Reversible loss of SpeB is associated with tissue pathology and inflammation. A Distribution of SpeB+ and SpeB GAS clones directly isolated from NSTI patient tissue biopsies (n = 23). B Percentage of SpeB+ and SpeB GAS clones after the passage in THY media (p1, passage 1; p2, passage 2). Representative analysis of 2006 GAS patient isolate is shown. CG Correlation analysis of bacterial load (left panel; n = 81 biopsies) or percentage of SpeB clones (right panel; n = 23 biopsies) with the presence of HMGB1 (C), IL-8 (D), infiltrating neutrophils (E), and resistin (F) in patient biopsies. Correlation was determined using Spearman test. Semiquantitative acquired computerized image analyses (ACIA) of immuno-histochemical staining were performed as described in the methods section. The cell area was defined by the hematoxylin counterstaining, and the results are presented as percent positively stained area × mean intensity of positive staining
Fig. 2
Fig. 2
Human neutrophils induce loss of SpeB in GAS. A Assessment of SpeB positivity/negativity of indicated strains via casein agar assay. Mean percentage from four independent experiments is shown (n = 4). B Representative image of Western-Blot analyses (n = 3; mSpeB, mature SpeB) and (C) SpeB activity assay (n = 3) of bacterial supernatants. GAS were grown over-night (16 h) in THY and sterile-filtered supernatants were used for the analyses. Original blot is shown in Additional file 1: Fig. S8. Each dot in C represents one independent experiment. Bars denote mean values ± SD. D Intracellular bacterial counts after 1 h of neutrophil infection. Each dot represents an experiment with neutrophils from one donor. The horizontal lines denote median values (n = 5). The level of significance was determined using Kruskal–Wallis test with Dunn’s multiple comparison post-test. E Assessment of SpeB positivity/negativity of indicated strains recovered from primary human neutrophils shown in D. Mean percentage of SpeB+ and SpeB clones from five independent experiments are shown (n = 5). Bacteria incubated in RPMI and THY media served as controls. F Distribution of SpeB+ and SpeB clones post neutrophil (PMN) and subsequent THY media passage. Displayed are mean [%] of five independent experiments (n = 5)
Fig. 3
Fig. 3
Distinct single colony proteome profile of GAS post neutrophil infection. A Relative speB mRNA expression in 5448 single colonies post neutrophil infections. Each dot represents one colony (n = 4). Bars denote mean value ± SD. B Principal component analysis of the proteome of single SpeB and SpeB+ colonies post neutrophil infections. GAS incubated in THY media, which remained 100% SpeB+ were used as controls. Each dot represents proteome analysis of one GAS colony (n = 16). C, D Heat map of differentially expressed proteins on a single colony level. Displayed are Log2 LFQ intensities (left panel), –Log10 q-value (middle panel), and Log2 fold change of the mean (right panel). Each column represents one single colony (four per condition and donor; n = 16 in total). C Protein abundance of THY vs. SpeB colonies and D SpeB+ vs. SpeB colonies are displayed (×, not detected)
Fig. 4
Fig. 4
H2O2 and HOCl impair SpeB secretion by GAS. A GAS 5448 strain was exposed to indicated concentration of hydrogen peroxide (H2O2) and bacterial numbers were determined 1 h post stimulations. Each dot represents one independent experiment. Lines denote mean values (n = 5). B Assessment of SpeB positivity/negativity of 5448 strain post H2O2 treatment as displayed in A. Mean percentage from five independent experiments is shown (n = 5). C GAS 5448 strain was exposed to indicated concentration of HOCl and bacterial numbers were determined 1 h post stimulations. Each dot represents one independent experiment. Lines denote mean values (n = 5). D Assessment of SpeB positivity/negativity of 5448 strain post HOCl treatment as displayed in C. Mean percentage from five independent experiments is shown (n = 5). AD Untreated bacteria in THY media, acidified NaCl or Na3PO4 served as controls. E Human primary neutrophils were infected with GAS strain 5448 and intracellular bacteria were determined by plating serial dilution of neutrophil lysates on casein agar plates post indicated time points. The MPO activity was inhibited by indicated concentrations of MPO inhibitor 30 min prior and during the entire infection period. Dots represent the median value ± range of independent experiments with five donors (n = 5). F Assessment of SpeB positivity/negativity of 5448 strain recovered from primary human neutrophils shown in E. Mean percentages of SpeB+ and SpeB clones from five independent experiments are shown (n = 5). G Representative images of GAS 5448 directly plated on casein agar containing indicated concentrations of H2O2 and H subsequent analyses. Mean percentage from four independent experiments is shown (n = 4). I SpeB activity assay (n = 4) of bacterial supernatants. GAS were grown over-night (16 h) in THY and sterile-filtered supernatants supplemented with indicated concentrations of H2O2 were used for the analyses. J Western blot (upper left panel), silver staining of the loading control (upper lower panel), and image analyses (right panel) of GAS 5448 supernatants post exposure to indicated concentrations of H2O2. Representative images and analysis of three independent experiments are shown (n = 3). The level of significance between the groups of experiments presented in A–H was determined using Kruskal Wallis test with Dunn’s posttest. The level of significance in J was determined using Friedman test
Fig. 5
Fig. 5
Increased levels of MPO in patient tissue biopsies associated with SpeB GAS. A Representative immunofluorescence micrographs of the distribution of MPO in patient biopsies are shown. B Image analyses of MPO and C GAS stainings. Calculation of the stained area (px2) per analyzed micrograph is presented. Each bar within diagrams denotes analysis of one image from indicated tissue biopsies. Bars on the right of each diagram denote mean values ± SD. The level of significance between the groups was determined using 2-tailed Mann–Whitney U test
Fig. 6
Fig. 6
Hyper-responsiveness of human neutrophils induced by SpeB-negative GAS. A, B Time-dependent and C, D strain-dependent comparison of secretome profiles of human neutrophils exposed to 5448 or 5448AP strains. Displayed are changes in relative abundance and p-values of the original analyses in Additional file 2: Table S5 (n = 5). E Heat map highlighting some of the significant differences of protein/peptide abundance in neutrophil secretomes from (AD). F Principal component analysis of secreted proteins post 4 h of infection of indicated strains. Each dot represents one donor (n = 5). The ellipses indicate the calculated 95% probability region for a bivariate normal distribution with an average center of groups. G Top six upregulated pathways in 5448AP infections of primary neutrophils as compared to 5448 infections. Displayed are adjusted p-values as determined by functional profiling in the Reactome database (CH, carbohydrate; AMPs, antimicrobial peptides). H Cellular compartment analyses of protein/peptides found in higher abundance in neutrophil secretomes of 5448AP infections as compared to 5448 infections. Displayed are adjusted p-values (left red axis, red bars) and number of proteins (right blue axis, blue bars). Functional profiling was performed using Reactome database (sec., secretory; gel., gelatinase; spec., specific; azur., azurophilic)

References

    1. Anaya DA, McMahon K, Nathens AB, Sullivan SR, Foy H, Bulger E. Predictors of mortality and limb loss in necrotizing soft tissue infections. Arch Surg. 2005;140(2):151–157. doi: 10.1001/archsurg.140.2.151. - DOI - PubMed
    1. Beavers WN, Skaar EP. Neutrophil-generated oxidative stress and protein damage in Staphylococcus aureus. Pathog Dis. 2016;74(6). - PMC - PubMed
    1. Bruun T, Kittang BR, de Hoog BJ, Aardal S, Flaatten HK, Langeland N, Mylvaganam H, Vindenes HA, Skrede S. Necrotizing soft tissue infections caused by Streptococcus pyogenes and Streptococcus dysgalactiae subsp. equisimilis of groups C and G in western Norway. Clin Microbiol Infect. 2013;19(12):E545–550. doi: 10.1111/1469-0691.12276. - DOI - PubMed
    1. Bruun T, Rath E, Bruun Madsen M, Oppegaard O, Nekludov M, Arnell P, Karlsson Y, Babbar A, Bergey F, Itzek A, Hyldegaard O, Norrby-Teglund A, Skrede S. Risk factors and predictors of mortality in streptococcal necrotizing soft-tissue infections: a multicenter prospective study. Clin Infect Dis. 2020;72:293. doi: 10.1093/cid/ciaa027. - DOI - PMC - PubMed
    1. Carroll RK, Musser JM. From transcription to activation: how group A streptococcus, the flesh-eating pathogen, regulates SpeB cysteine protease production. Mol Microbiol. 2011;81(3):588–601. doi: 10.1111/j.1365-2958.2011.07709.x. - DOI - PubMed