. 2023 May 16;23(10):4802.
doi: 10.3390/s23104802.

Temporal, Kinematic and Kinetic Variables Derived from a Wearable 3D Inertial Sensor to Estimate Muscle Power during the 5 Sit to Stand Test in Older Individuals: A Validation Study

Affiliations

Temporal, Kinematic and Kinetic Variables Derived from a Wearable 3D Inertial Sensor to Estimate Muscle Power during the 5 Sit to Stand Test in Older Individuals: A Validation Study

Gianluca Bochicchio et al. Sensors (Basel). .

Abstract

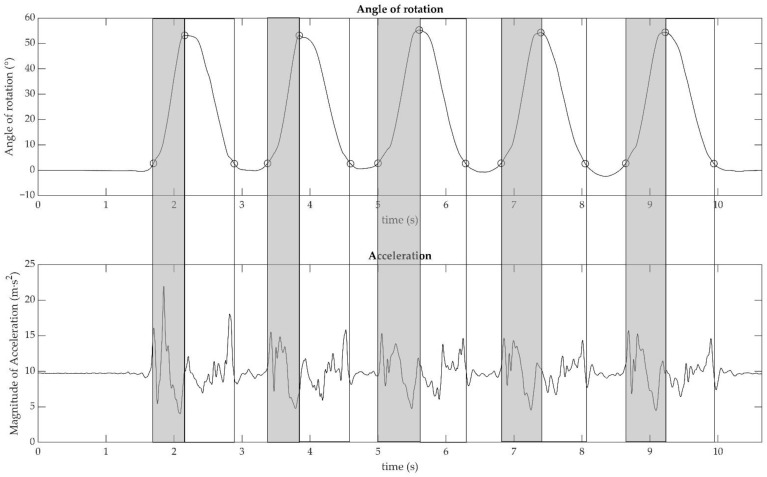
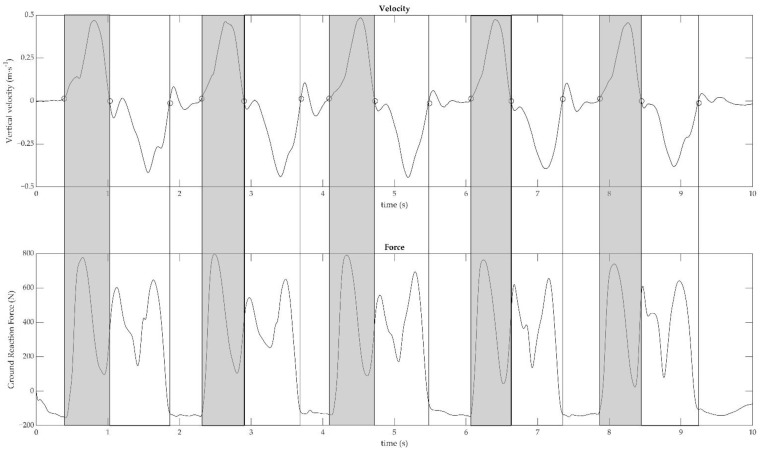
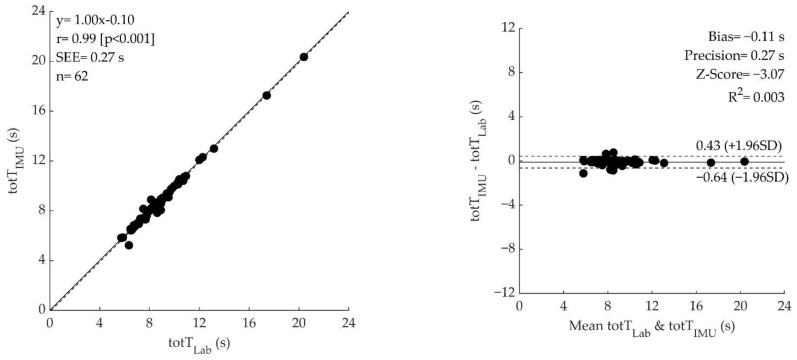
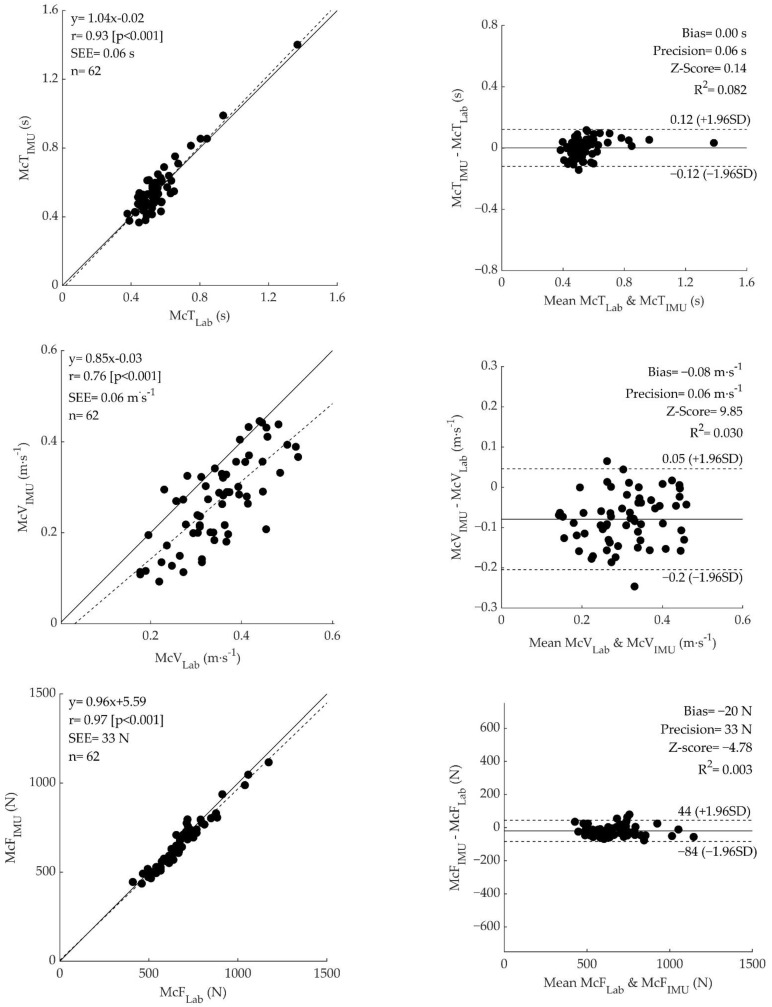
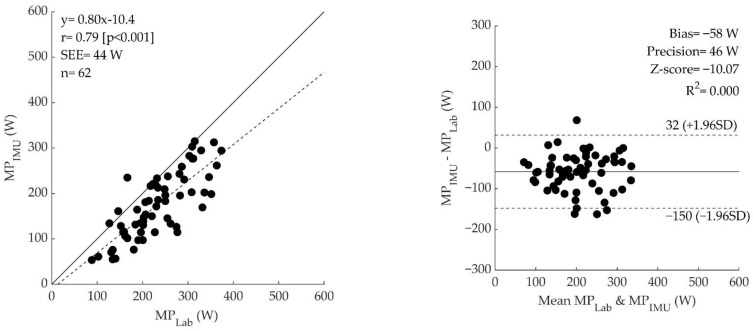
The 5-Sit-to-stand test (5STS) is widely used to estimate lower limb muscle power (MP). An Inertial Measurement Unit (IMU) could be used to obtain objective, accurate and automatic measures of lower limb MP. In 62 older adults (30 F, 66 ± 6 years) we compared (paired t-test, Pearson's correlation coefficient, and Bland-Altman analysis) IMU-based estimates of total trial time (totT), mean concentric time (McT), velocity (McV), force (McF), and MP against laboratory equipment (Lab). While significantly different, Lab vs. IMU measures of totT (8.97 ± 2.44 vs. 8.86 ± 2.45 s, p = 0.003), McV (0.35 ± 0.09 vs. 0.27 ± 0.10 m∙s-1, p < 0.001), McF (673.13 ± 146.43 vs. 653.41 ± 144.58 N, p < 0.001) and MP (233.00 ± 70.83 vs. 174.84 ± 71.16 W, p < 0.001) had a very large to extremely large correlation (r = 0.99, r = 0.93, and r = 0.97 r = 0.76 and r = 0.79, respectively, for totT, McT, McF, McV and MP). Bland-Altman analysis showed a small, significant bias and good precision for all the variables, but McT. A sensor-based 5STS evaluation appears to be a promising objective and digitalized measure of MP. This approach could offer a practical alternative to the gold standard methods used to measure MP.

Keywords: IMU; ageing; functional screening; motion analysis; sensors; sit-to-stand; validity.


Conflict of interest statement

A.S. was employed at Microgate s.r.l. during this study.

Figures

Figure 1
Figure 1
Angle of rotation around the main axis (expressed in degree °, upper graphic) and Magnitude of acceleration (m·s−2, lower graphic) are plotted as a function of time during the 5 Sit to Stand test in a representative subject. The points (○) mark the events of each repetition (start, standing position, and end). Light grey sections highlight the concentric phases (i.e., raising phase), while white sections highlight the eccentric phases (i.e., sitting phase).
Figure 2
Figure 2
Vertical velocity (m s−1; above) measured by motion capture and vertical force (N; below) measured by force plate in the 5 Sit to Stand test are plotted in function on time (s) in a representative participant. The points (○) mark the events of each repetition (start, standing position, and end). Light grey sections highlight the concentric phases (i.e., raising phase) while white sections highlight the eccentric phases (i.e., sitting phase).
Figure 3
Figure 3
The left side of the figure shows the correlation plots between laboratory and IMU measures of 5 sit-to-stand total time (totT), mean concentric time (McT), mean concentric velocity (McV), mean concentric force (McF) and mean power (MP). Equation, Pearson’s correlation coefficient (r), p-value, SEE and sample size are reported along with regression (dashed) and identity (solid) lines. The right side of the figure shows the Bland Altman analysis comparing laboratory and IMU of the same variables. Individual differences between lab and IMU measures are plotted as a function of the mean of the two. Bias, R2, and Z-score are reported along with the LOA (dashed lines) and bias (solid lines).
Figure 3
Figure 3
The left side of the figure shows the correlation plots between laboratory and IMU measures of 5 sit-to-stand total time (totT), mean concentric time (McT), mean concentric velocity (McV), mean concentric force (McF) and mean power (MP). Equation, Pearson’s correlation coefficient (r), p-value, SEE and sample size are reported along with regression (dashed) and identity (solid) lines. The right side of the figure shows the Bland Altman analysis comparing laboratory and IMU of the same variables. Individual differences between lab and IMU measures are plotted as a function of the mean of the two. Bias, R2, and Z-score are reported along with the LOA (dashed lines) and bias (solid lines).

References

    1. Cawthon P.M., Visser M., Arai H., Ávila-Funes J.A., Barazzoni R., Bhasin S., Binder E., Bruyère O., Cederholm T., Chen L.K., et al. Defining Terms Commonly Used in Sarcopenia Research: A Glossary Proposed by the Global Leadership in Sarcopenia (GLIS) Steering Committee. Eur. Geriatr. Med. 2022;13:1239–1244. doi: 10.1007/s41999-022-00706-5. - DOI - PMC - PubMed
    1. Gray M., Paulson S. Developing a Measure of Muscular Power during a Functional Task for Older Adults. BMC Geriatr. 2014;14:4–9. doi: 10.1186/1471-2318-14-145. - DOI - PMC - PubMed
    1. Muollo V., Rossi A.P., Zignoli A., Teso M., Milanese C., Cavedon V., Zamboni M., Schena F., Capelli C., Pogliaghi S. Full Characterisation of Knee Extensors’ Function in Ageing: Effect of Sex and Obesity. Int. J. Obes. 2021;45:895–905. doi: 10.1038/s41366-021-00755-z. - DOI - PubMed
    1. Glenn J.M., Gray M., Binns A. Relationship of Sit-to-Stand Lower-Body Power with Functional Fitness Measures Among Older Adults with and without Sarcopenia. J. Geriatr. Phys. Ther. 2017;40:42–50. doi: 10.1519/JPT.0000000000000072. - DOI - PubMed
    1. Cruz-Jentoft A.J., Sayer A.A. Sarcopenia. Lancet. 2019;393:2636–2646. doi: 10.1016/S0140-6736(19)31138-9. - DOI - PubMed

LinkOut - more resources