A Direct Immunoassay Based on Surface-Enhanced Spectroscopy Using AuNP/PS-b-P2VP Nanocomposites
- PMID: 37430723
- PMCID: PMC10224472
- DOI: 10.3390/s23104810
A Direct Immunoassay Based on Surface-Enhanced Spectroscopy Using AuNP/PS-b-P2VP Nanocomposites
Abstract
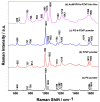
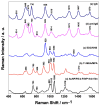
A biosensor was developed for directly detecting human immunoglobulin G (IgG) and adenosine triphosphate (ATP) based on stable and reproducible gold nanoparticles/polystyrene-b-poly(2-vinylpyridine) (AuNP/PS-b-P2VP) nanocomposites. The substrates were functionalized with carboxylic acid groups for the covalent binding of anti-IgG and anti-ATP and the detection of IgG and ATP (1 to 150 μg/mL). SEM images of the nanocomposite show 17 ± 2 nm AuNP clusters adsorbed over a continuous porous PS-b-P2VP thin film. UV-VIS and SERS were used to characterize each step of the substrate functionalization and the specific interaction between anti-IgG and the targeted IgG analyte. The UV-VIS results show a redshift of the LSPR band as the AuNP surface was functionalized and SERS measurements showed consistent changes in the spectral features. Principal component analysis (PCA) was used to discriminate between samples before and after the affinity tests. Moreover, the designed biosensor proved to be sensitive to different concentrations of IgG with a limit-of-detection (LOD) down to 1 μg/mL. Moreover, the selectivity to IgG was confirmed using standard solutions of IgM as a control. Finally, ATP direct immunoassay (LOD = 1 μg/mL) has demonstrated that this nanocomposite platform can be used to detect different types of biomolecules after proper functionalization.
Keywords: LSPR sensor; SERS sensing; direct immunoassay; gold nanoparticles; polystyrene-b-poly(2-vinylpyridine).
Conflict of interest statement
The authors declare no conflict of interest.
Figures


Similar articles
-
SERS-ELISA determination of human carboxylesterase 1 using metal-organic framework doped with gold nanoparticles as SERS substrate.Mikrochim Acta. 2021 Jul 30;188(8):280. doi: 10.1007/s00604-021-04928-5. Mikrochim Acta. 2021. PMID: 34331134
-
Facile synthesis of cellulose nanofiber nanocomposite as a SERS substrate for detection of thiram in juice.Carbohydr Polym. 2018 Jun 1;189:79-86. doi: 10.1016/j.carbpol.2018.02.014. Epub 2018 Feb 8. Carbohydr Polym. 2018. PMID: 29580429
-
Rapid vertical flow immunoassay on AuNP plasmonic paper for SERS-based point of need diagnostics.Talanta. 2021 Feb 1;223(Pt 2):121739. doi: 10.1016/j.talanta.2020.121739. Epub 2020 Oct 10. Talanta. 2021. PMID: 33298265
-
SERS immunoassay based on the capture and concentration of antigen-assembled gold nanoparticles.Talanta. 2016;146:388-93. doi: 10.1016/j.talanta.2015.08.065. Epub 2015 Sep 4. Talanta. 2016. PMID: 26695280
-
Surface-enhanced Raman scattering: realization of localized surface plasmon resonance using unique substrates and methods.Anal Bioanal Chem. 2009 Aug;394(7):1747-60. doi: 10.1007/s00216-009-2762-4. Epub 2009 Apr 22. Anal Bioanal Chem. 2009. PMID: 19384546 Review.
References
-
- Kelly K.L., Coronado E., Zhao L.L., Schatz G.C. The Optical Properties of Metal Nanoparticles: The Influence of Size, Shape, and Dielectric Environment. J. Phys. Chem. B. 2003;107:668–677. doi: 10.1021/jp026731y. - DOI
-
- Le Ru E.C., Etchegoin P.G. Principles of Surface-Enhanced Raman Spectroscopy. Elsevier; Amsterdam, The Netherlands: 2009.
-
- Riboh J.C., Haes A.J., McFarland A.D., Yonzon C.R., Van Duyne R.P. A Nanoscale Optical Biosensor: Real-Time Immunoassay in Physiological Buffer Enabled by Improved Nanoparticle Adhesion. J. Phys. Chem. B. 2003;107:1772–1780. doi: 10.1021/jp022130v. - DOI
MeSH terms
Substances
Grants and funding
LinkOut - more resources
Full Text Sources
Miscellaneous

