

An IoT-Enabled E-Nose for Remote Detection and Monitoring of Airborne Pollution Hazards Using LoRa Network Protocol
- PMID: 37430799
- PMCID: PMC10222756
- DOI: 10.3390/s23104885
An IoT-Enabled E-Nose for Remote Detection and Monitoring of Airborne Pollution Hazards Using LoRa Network Protocol
Abstract
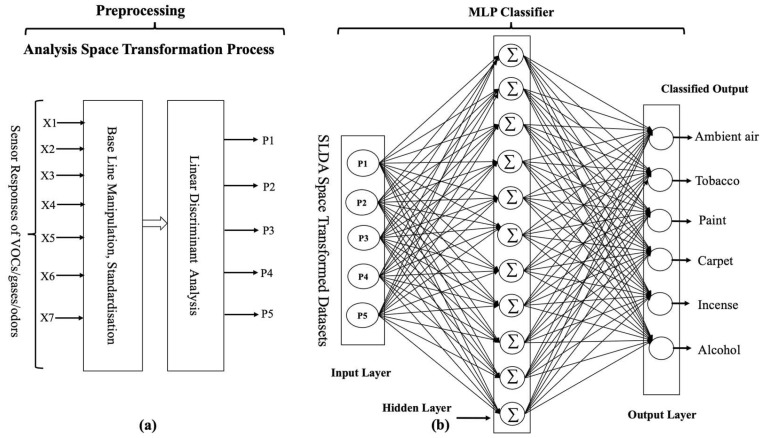
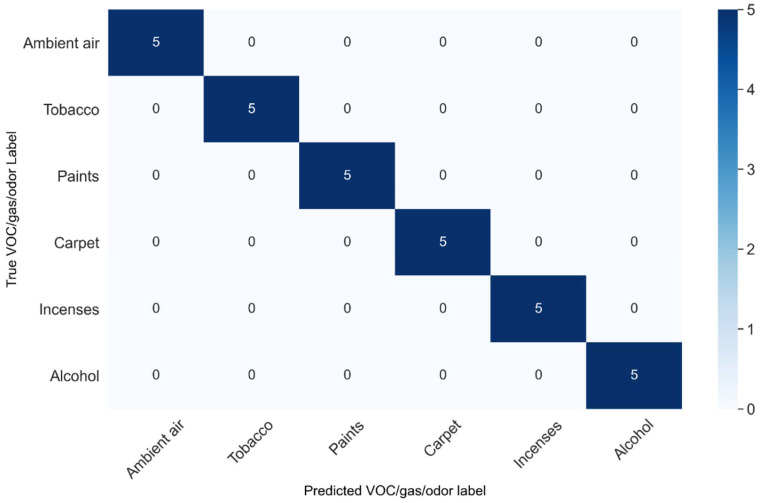
Detection and monitoring of airborne hazards using e-noses has been lifesaving and prevented accidents in real-world scenarios. E-noses generate unique signature patterns for various volatile organic compounds (VOCs) and, by leveraging artificial intelligence, detect the presence of various VOCs, gases, and smokes onsite. Widespread monitoring of airborne hazards across many remote locations is possible by creating a network of gas sensors using Internet connectivity, which consumes significant power. Long-range (LoRa)-based wireless networks do not require Internet connectivity while operating independently. Therefore, we propose a networked intelligent gas sensor system (N-IGSS) which uses a LoRa low-power wide-area networking protocol for real-time airborne pollution hazard detection and monitoring. We developed a gas sensor node by using an array of seven cross-selective tin-oxide-based metal-oxide semiconductor (MOX) gas sensor elements interfaced with a low-power microcontroller and a LoRa module. Experimentally, we exposed the sensor node to six classes i.e., five VOCs plus ambient air and as released by burning samples of tobacco, paints, carpets, alcohol, and incense sticks. Using the proposed two-stage analysis space transformation approach, the captured dataset was first preprocessed using the standardized linear discriminant analysis (SLDA) method. Four different classifiers, namely AdaBoost, XGBoost, Random Forest (RF), and Multi-Layer Perceptron (MLP), were then trained and tested in the SLDA transformation space. The proposed N-IGSS achieved "all correct" identification of 30 unknown test samples with a low mean squared error (MSE) of 1.42 × 10⁻⁴ over a distance of 590 m.
Keywords: Internet of Things (IoT); airborne pollution hazard; intelligent gas sensor system (IGSS); long range (LoRa); low-power wide-area network (LPWAN).
Conflict of interest statement
The authors declare no conflict of interest.
Figures


References
-
- WHO Household Air Pollution and Health. [(accessed on 28 January 2020)]. Available online: https://www.who.int/en/news-room/factsheets/detail/household-air-polluti....
-
- Hromadka J., Korposh S., Partridge M.C., James S.W., Davis F., Crump D., Tatam R.P. Multi-parameter measurements using optical fibre long period gratings for indoor air quality monitoring. Sens. Actuat. B Chem. 2017;244:217–225. doi: 10.1016/j.snb.2016.12.050. - DOI
-
- Shahjalal M., Hasan M.K., Islam M.M., Alam M.M., Ahmed M.F., Jang Y.M. An over-view of AI-enabled remote smart-home monitoring system using LoRa; Proceedings of the 2020 International Conference on Artificial Intel-ligence in Information and Communication (ICAIIC); Fukuoka, Japan. 19–21 February 2020; pp. 510–513.
LinkOut - more resources
Full Text Sources
