

Analysis of Microbial Community Diversity on the Epidermis of Wine Grapes in Manasi's Vineyard, Xinjiang
- PMID: 37430923
- PMCID: PMC9602134
- DOI: 10.3390/foods11203174
Analysis of Microbial Community Diversity on the Epidermis of Wine Grapes in Manasi's Vineyard, Xinjiang
Abstract
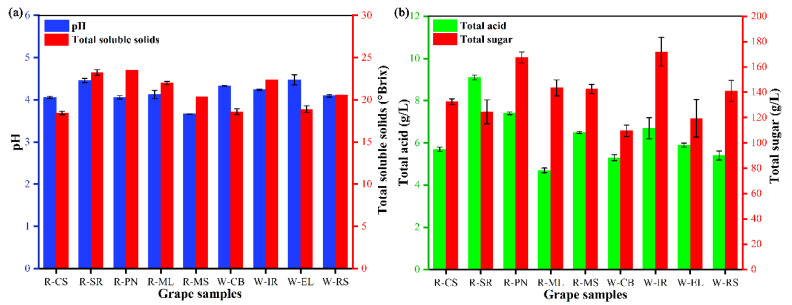
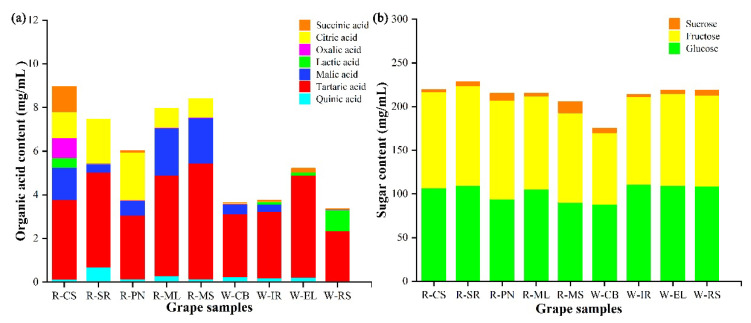
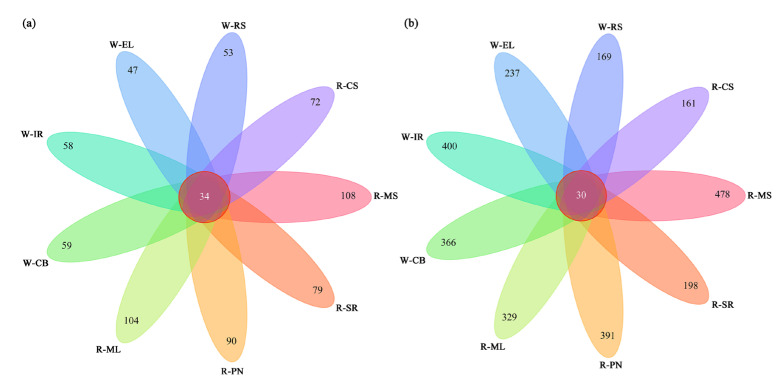
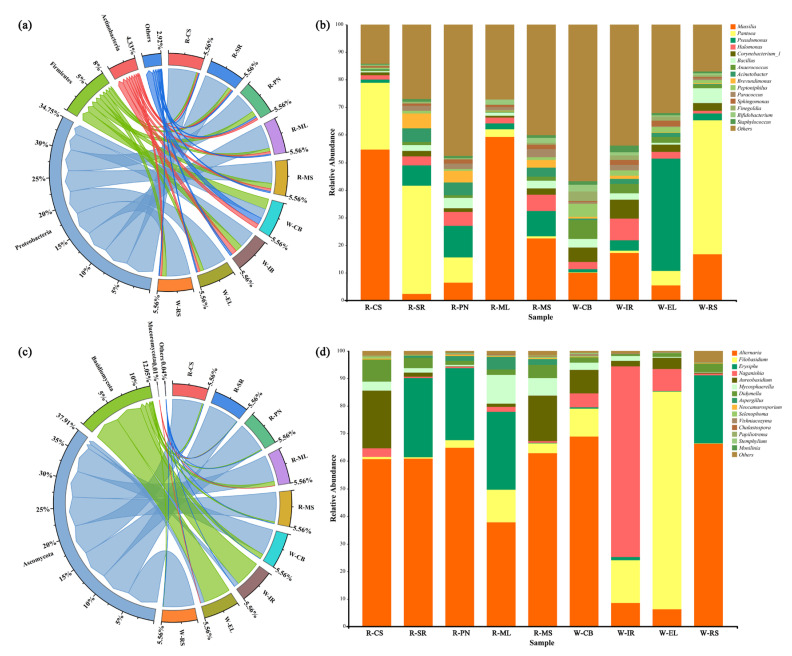
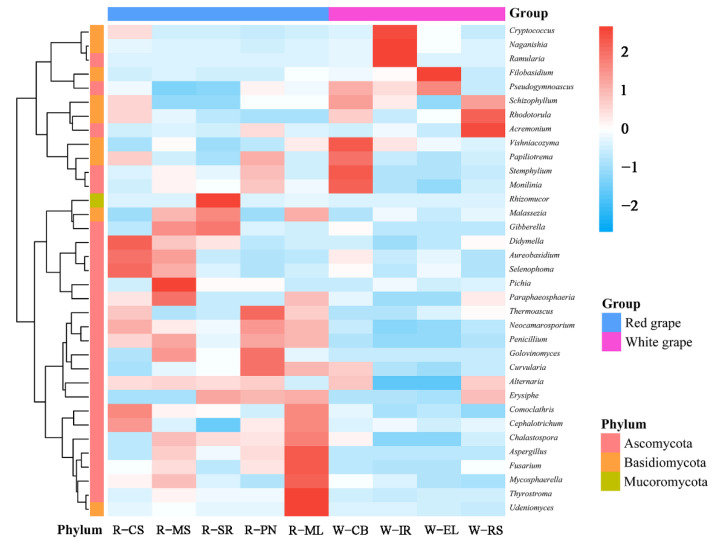
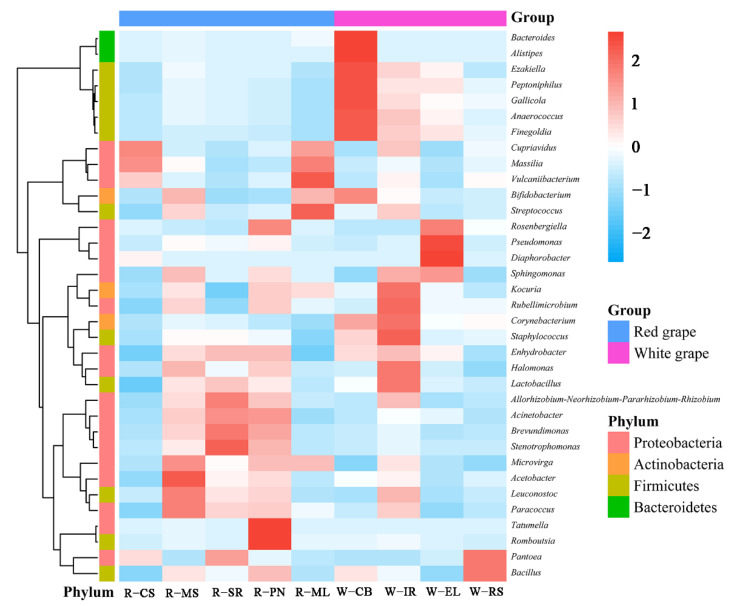
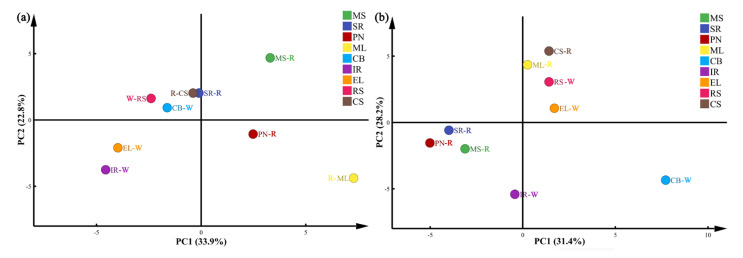
Epiphytic microbial communities significantly impact the health and quality of grape berries. This study utilized high-performance liquid chromatography and high-throughput sequencing to explore the epiphytic microbial diversity and physicochemical indicators in nine different wine grape varieties. In total, 1,056,651 high-quality bacterial 16S rDNA sequences and 1,101,314 fungal ITS reads were used for taxonomic categorization. Among the bacteria, Proteobacteria and Firmicutes were the dominant phyla, and Massilia, Pantoea, Pseudomonas, Halomonas, Corynebacterium, Bacillus, Anaerococcus, and Acinetobacter were the dominant genera. Among the fungi, Ascomycota and Basidiomycota were the dominant phyla, and Alternaria, Filobasidium, Erysiphe, Naganishia, and Aureobasidium were the dominant genera. Notably, Matheran (MSL) and Riesling (RS) exhibited the highest microbial diversity among the nine grape varieties. Moreover, pronounced differences in epiphytic microorganisms in red and white grapes suggested that the grape variety significantly influences the structure of surface microbial communities. Understanding the composition of epiphytic microorganisms on the grape skin can provide a direct guide to winemaking.
Keywords: Illumina high-throughput sequencing; grape surface microorganisms; microbial diversity; wine grapes.
Conflict of interest statement
All authors declare that they have no conflict of interest.
Figures
Similar articles
-
Microbial Community Analyses Associated with Nine Varieties of Wine Grape Carposphere Based on High-Throughput Sequencing.Microorganisms. 2019 Dec 9;7(12):668. doi: 10.3390/microorganisms7120668. Microorganisms. 2019. PMID: 31835425 Free PMC article.
-
High-throughput sequencing of microbial community diversity in soil, grapes, leaves, grape juice and wine of grapevine from China.PLoS One. 2018 Mar 22;13(3):e0193097. doi: 10.1371/journal.pone.0193097. eCollection 2018. PLoS One. 2018. PMID: 29565999 Free PMC article.
-
Year, Location, and Variety Impact on Grape-Associated Mycobiota of Arkansas-Grown Wine Grapes for Wine Production.Microb Ecol. 2021 Nov;82(4):845-858. doi: 10.1007/s00248-021-01705-y. Epub 2021 Mar 5. Microb Ecol. 2021. PMID: 33665722
-
From the Vineyard to the Winery: How Microbial Ecology Drives Regional Distinctiveness of Wine.Front Microbiol. 2019 Nov 20;10:2679. doi: 10.3389/fmicb.2019.02679. eCollection 2019. Front Microbiol. 2019. PMID: 31824462 Free PMC article. Review.
-
Fungi and mycotoxins in vineyards and grape products.Int J Food Microbiol. 2007 Oct 20;119(1-2):84-8. doi: 10.1016/j.ijfoodmicro.2007.07.031. Epub 2007 Aug 9. Int J Food Microbiol. 2007. PMID: 17765989 Review.
Cited by
-
Spatiotemporal Dynamics of Assyrtiko Grape Microbiota.Microorganisms. 2024 Mar 14;12(3):577. doi: 10.3390/microorganisms12030577. Microorganisms. 2024. PMID: 38543628 Free PMC article.
-
A Snapshot of Microbial Succession and Volatile Component Dynamics of Marselan Wine in Xinjiang During Spontaneous Fermentation.Foods. 2025 Mar 14;14(6):994. doi: 10.3390/foods14060994. Foods. 2025. PMID: 40232002 Free PMC article.
-
Dynamic Succession of Natural Microbes during the Ecolly Grape Growth under Extremely Simplified Eco-Cultivation.Foods. 2024 May 18;13(10):1580. doi: 10.3390/foods13101580. Foods. 2024. PMID: 38790880 Free PMC article.
-
Vintage and terroir are the strongest determinants of grapevine carposphere microbiome in the viticultural zone of Drama, Greece.FEMS Microbiol Ecol. 2025 Jan 28;101(2):fiaf008. doi: 10.1093/femsec/fiaf008. FEMS Microbiol Ecol. 2025. PMID: 39832807 Free PMC article.
-
Pre-harvest microbial Interventions: Impact on disease prevention, fermentation dynamics, and wine aroma in grape cultivation.Curr Res Food Sci. 2025 Jun 30;11:101132. doi: 10.1016/j.crfs.2025.101132. eCollection 2025. Curr Res Food Sci. 2025. PMID: 40689291 Free PMC article.
References
-
- Reynolds A.G., editor. Managing Wine Quality: Viticulture and Wine Quality. Elsevier; Amsterdam, The Netherlands: 2010.
-
- Kerridge G.H., Antcliff A.J. Wine Grape Varieties. Csiro Publishing; Clayton, Australia: 1999.
-
- Rombough L. The Grape Grower: A Guide to Organic Viticulture. Chelsea Green Publishing; Hartford, VT, USA: 2002.
Grants and funding
- No. 31960456/National Natural Science Foundation of China
- No. 2020AB014/Science and Technology Research Project of the Xinjiang Production and Construction Crops
- No. 2022B01/Science and Technology Research Project of Seven Division
- No. CXBJ202004/Youth Innovative Talents Training Program of Shihezi University
- No. 202101; No. 20GY01/Science and Technology Research Project of Fifth Division
LinkOut - more resources
Full Text Sources
