

A physiologically-based pharmacokinetic model for tuberculosis drug disposition at extrapulmonary sites
- PMID: 37431175
- PMCID: PMC10508491
- DOI: 10.1002/psp4.13008
A physiologically-based pharmacokinetic model for tuberculosis drug disposition at extrapulmonary sites
Abstract
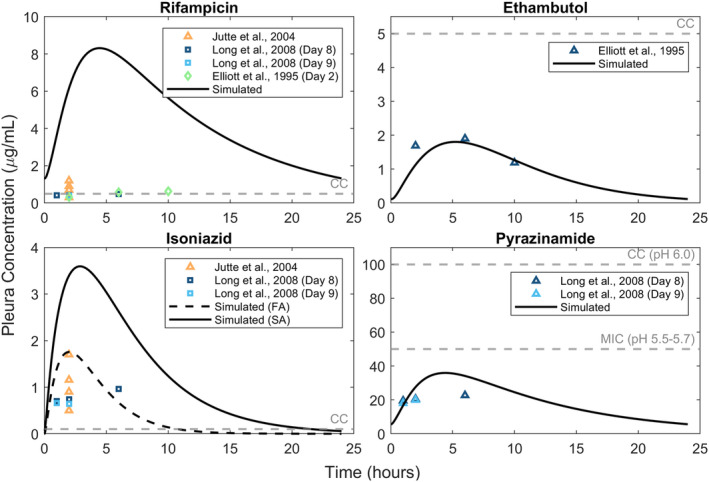
Tuberculosis (TB) is a leading cause of mortality attributed to an infectious agent. TB primarily targets the lungs, but in about 16% cases can affect other organs as well, giving rise to extrapulmonary TB (EPTB). However, an optimal regimen for EPTB treatment is not defined. Although the recommended treatment for most forms of EPTB is the same as pulmonary TB, the pharmacokinetics of EPTB therapy are not as well studied. To address this gap, we formulate a whole-body physiologically-based pharmacokinetic (PBPK) model for EPTB that for the first time includes the ability to simulate drug concentrations in the pleura and lymph node, the most commonly affected sites of EPTB. Using this model, we estimate the time-dependent concentrations, at potential EPTB infection sites, of the following four first-line anti-TB drugs: rifampicin, ethambutol, isoniazid, and pyrazinamide. We use reported plasma concentration kinetics data to estimate model parameters for each drug and validate our model using reported concentration data not used for model formulation or parameter estimation. Model predictions match the validation data, and reported pharmacokinetic parameters (maximum plasma concentration, time to reach maximum concentration) for the drugs. The model also predicts ethambutol, isoniazid, and pyrazinamide concentrations in the pleura that match reported experimental values from an independent study. For each drug, the predicted drug concentrations at EPTB sites are compared with their critical concentration. Simulations suggest that although rifampicin and isoniazid concentrations are greater than critical concentration values at most EPTB sites, the concentrations of ethambutol and pyrazinamide are lower than their critical concentrations at most EPTB sites.
© 2023 The Authors. CPT: Pharmacometrics & Systems Pharmacology published by Wiley Periodicals LLC on behalf of American Society for Clinical Pharmacology and Therapeutics.
Conflict of interest statement
The authors declared no competing interests for this work.
Figures


Similar articles
-
Pharmacokinetics of isoniazid, rifampicin, pyrazinamide and ethambutol in HIV-infected Indian children.Int J Tuberc Lung Dis. 2016 May;20(5):666-72. doi: 10.5588/ijtld.15.0288. Int J Tuberc Lung Dis. 2016. PMID: 27084822
-
Determinants of rifampin, isoniazid, pyrazinamide, and ethambutol pharmacokinetics in a cohort of tuberculosis patients.Antimicrob Agents Chemother. 2006 Apr;50(4):1170-7. doi: 10.1128/AAC.50.4.1170-1177.2006. Antimicrob Agents Chemother. 2006. PMID: 16569826 Free PMC article.
-
Pharmacokinetics of Isoniazid, Pyrazinamide, and Ethambutol in Newly Diagnosed Pulmonary TB Patients in Tanzania.PLoS One. 2015 Oct 26;10(10):e0141002. doi: 10.1371/journal.pone.0141002. eCollection 2015. PLoS One. 2015. PMID: 26501782 Free PMC article. Clinical Trial.
-
Optimizing treatment outcome of first-line anti-tuberculosis drugs: the role of therapeutic drug monitoring.Eur J Clin Pharmacol. 2016 Aug;72(8):905-16. doi: 10.1007/s00228-016-2083-4. Epub 2016 Jun 15. Eur J Clin Pharmacol. 2016. PMID: 27305904 Review.
-
Tuberculosis (TB) in pregnancy - A review.Eur J Obstet Gynecol Reprod Biol. 2021 Apr;259:167-177. doi: 10.1016/j.ejogrb.2021.02.016. Epub 2021 Feb 19. Eur J Obstet Gynecol Reprod Biol. 2021. PMID: 33684671 Review.
References
-
- World Health Organization . Global tuberculosis report 2020. 2020. Published online.
-
- World Health Organization . Global tuberculosis report 2022. World Health Organization 2022.
Publication types
MeSH terms
Substances
LinkOut - more resources
Full Text Sources
Medical
Miscellaneous
