. 2023 Oct;94(4):632-646.
doi: 10.1002/ana.26738. Epub 2023 Aug 23.

Network Connectivity Alterations across the MAPT Mutation Clinical Spectrum

Affiliations

Network Connectivity Alterations across the MAPT Mutation Clinical Spectrum

Liwen Zhang et al. Ann Neurol. 2023 Oct.

Abstract

Objective: Microtubule-associated protein tau (MAPT) mutations cause frontotemporal lobar degeneration, and novel biomarkers are urgently needed for early disease detection. We used task-free functional magnetic resonance imaging (fMRI) mapping, a promising biomarker, to analyze network connectivity in symptomatic and presymptomatic MAPT mutation carriers.

Methods: We compared cross-sectional fMRI data between 17 symptomatic and 39 presymptomatic carriers and 81 controls with (1) seed-based analyses to examine connectivity within networks associated with the 4 most common MAPT-associated clinical syndromes (ie, salience, corticobasal syndrome, progressive supranuclear palsy syndrome, and default mode networks) and (2) whole-brain connectivity analyses. We applied K-means clustering to explore connectivity heterogeneity in presymptomatic carriers at baseline. Neuropsychological measures, plasma neurofilament light chain, and gray matter volume were compared at baseline and longitudinally between the presymptomatic subgroups defined by their baseline whole-brain connectivity profiles.

Results: Symptomatic and presymptomatic carriers had connectivity disruptions within MAPT-syndromic networks. Compared to controls, presymptomatic carriers showed regions of connectivity alterations with age. Two presymptomatic subgroups were identified by clustering analysis, exhibiting predominantly either whole-brain hypoconnectivity or hyperconnectivity at baseline. At baseline, these two presymptomatic subgroups did not differ in neuropsychological measures, although the hypoconnectivity subgroup had greater plasma neurofilament light chain levels than controls. Longitudinally, both subgroups showed visual memory decline (vs controls), yet the subgroup with baseline hypoconnectivity also had worsening verbal memory and neuropsychiatric symptoms, and extensive bilateral mesial temporal gray matter decline.

Interpretation: Network connectivity alterations arise as early as the presymptomatic phase. Future studies will determine whether presymptomatic carriers' baseline connectivity profiles predict symptomatic conversion. ANN NEUROL 2023;94:632-646.


Conflict of interest statement

Potential Conflicts of Interest

All authors report no conflict of interest relevant to the current study.

Figures
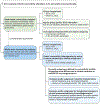
Figure 1
Figure 1. Analysis overview schematic.
Two complementary analytical connectivity approaches are utilized to study network connectivity alterations in Sx and preSx. The seed-based approach examines connectivity within ICNs in association with the four most common MAPT-associated clinical syndromes. Connectivity levels are compared between carriers and matched controls. To explore whether connectivity alterations might be driven by older preSx presumably closer to symptom onset, age by group (preSx and HC2) interaction analyses are performed. Additionally, association between clinical measures and ICNs are examined, including correlations between SN connectivity and depressive symptoms and between DMN connectivity and memory performance based on previous studies of frontotemporal dementia. The whole-brain connectivity approach studies connectivity within and between 14 ICNs encompassing regions across the brain. Because preSx consists of a mixture of some carriers closer than others to symptom onset, we explore whole-brain connectivity heterogeneity in preSx. To determine whether a specific whole-brain connectivity profile at baseline identifies presymptomatic carriers who may be closer to symptomatic onset, we characterize the clinical measures and markers of neurodegeneration at baseline and longitudinally in preSx subgroups. Abbreviations: DMN = default mode network; HC2 = healthy controls matched to presymptomatic carriers; ICN = intrinsic connectivity network; preSx = presymptomatic MAPT mutation carriers; SN = salience network; Sx = symptomatic MAPT mutation carriers; NfL = neurofilament light chain.
Figure 2
Figure 2. Seed-based intrinsic connectivity networks associated with the four most common MAPT-associated clinical syndromes.
Using peak atrophy regions from previous literature as seed regions (yellow), four networks of interest (blue) are derived in an independent healthy control group (i.e., 119 HC3). These networks include the SN that degenerates in bvFTD, the CBS and PSP syndrome networks and the DMN for an Alzheimer-like syndrome. These network maps were used as masks to constrain subsequent seed-based analyses. Abbreviations: bvFTD = behavioral variant frontotemporal dementia; CBS = corticobasal syndrome; DMN = default mode network; HC3 = independent healthy control group for multisite image data harmonization; PSP = progressive supranuclear palsy; SN = salience network.
Figure 3
Figure 3. Sx-MAPT and preSx-MAPT show functional connectivity alterations in networks associated with MAPT-related clinical syndromes.
(Left panel) Group contrast maps show predominantly connectivity disruptions in Sx-MAPT compared to HC1 for all networks of interest except for the DMN. (Right panel) PreSx-MAPT have connectivity disruptions within all networks compared to HC2. Results are thresholded at a joint height and extent threshold of P < 0.05, masked to the relevant network, and superimposed on the MNI brain template. Color bars represent t values. Abbreviations: CBS network = corticobasal syndrome network; DMN = default mode network; HC1 = healthy controls matched to symptomatic carriers; HC2 = healthy controls matched to presymptomatic carriers; MAPT+ = MAPT mutation carriers; preSx-MAPT = presymptomatic MAPT mutation carriers; PSP network = progressive supranuclear palsy syndrome network; SN = salience network; Sx-MAPT = symptomatic MAPT mutation carriers.
Figure 4
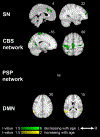
Figure 4. Cross-sectional functional connectivity changes with age in preSx-MAPT.
Colored brain regions depict the interaction between age and group on connectivity in networks associated with MAPT-related clinical syndromes. PreSx-MAPT show regions of lower (green) and higher (yellow) connectivity with increasing age compared to HC2. Results are thresholded at a joint height and extent threshold of P < 0.05, masked to the relevant network, and superimposed on the MNI brain template. Color bars represent t values. Abbreviations: CBS network = corticobasal syndrome network; DMN = default mode network; HC2 = healthy controls matched to presymptomatic carriers; preSx-MAPT = presymptomatic MAPT mutation carriers; PSP network = progressive supranuclear palsy syndrome network; SN = salience network.
Figure 5
Figure 5. In preSx-MAPT, symptoms of depression and lower memory scores are associated with lower connectivity in the SN and DMN respectively.
(Top row) In preSx-MAPT, voxelwise regression analyses show regions of lower SN connectivity in association with higher GDS scores (reflective of greater symptoms of depression). (Bottom row) Lower Benson figure recall (visual memory) is associated with regions of lower DMN connectivity. Dot plots on the right of each map indicate the mean ICN connectivity beta values within the significant regions for each subject. Results are thresholded at a joint height and extent threshold of P < 0.05, masked to the relevant network, and superimposed on the MNI brain template. Color bars represent t values. Beta parameters extracted from significant clusters are plotted versus clinical variables of interest. Abbreviations: DMN = default mode network; GDS = Geriatric Depression Scale; preSx-MAPT = presymptomatic MAPT mutation carriers; SN = salience network.
Figure 6
Figure 6. Clustering analysis based on whole-brain connectivity measures identifies presymptomatic subgroups with heterogeneous connectivity profiles.
(A) K-means clustering based on whole-brain intra-network and inter-network connectivity measures yields two preSx-MAPT subgroups. For post-hoc visualization only, a principal component analysis based on the same whole-brain connectivity measures is conducted, and the two subgroups defined by K-means clustering are plotted along the two principal components that explain the most variance (PC1 vs. PC2). (B) Visualization of whole-brain connectivity difference matrices between these preSx-MAPT subgroups and matched HC2 shows that preSx1 have predominantly hypoconnectivity (blue color scale) and preSx2 have predominantly hyperconnectivity (red color scale) both before (top row) and after (bottom row) between-group statistical comparisons (PFDR < 0.05). Statistical comparisons were performed at the network level, while nodal connectivity strengths are plotted for visualization only. The network labels from left/top to right/bottom are: FPr, FPl, CO, SAL, SUB, AT, HIP, PHC, AMY, DMN, DAN, AUD, SMN and VIS. Abbreviations: AMY = amygdala network; AT = anterior temporal network; AUD = auditory network; CO = cingulo-opercular network; DAN = dorsal attention network; DMN = default mode network; FPl = left fronto-parietal network; FPr = right fronto-parietal network; HC2 = healthy controls matched to presymptomatic carriers; HIP = hippocampal network; PC = principal component; PHC = parahippocampal network; preSx1 = subgroup 1 of presymptomatic MAPT mutation carriers; preSx2 = subgroup 2 of presymptomatic MAPT mutation carriers; preSx-MAPT = presymptomatic MAPT mutation carriers; SAL = salience network; SMN = sensory motor network; SUB = subcortical network; VIS = visual network.
Figure 7
Figure 7. Longitudinal gray matter volume decline in presymptomatic subgroups.
Compared to HC2, preSx1 has extensive regions of longitudinal gray matter volume decline in bilateral mesial temporal cortex, anterior temporal pole and insula, while preSx2 shows longitudinal volume decline in the left anterior temporal pole and fusiform. Line plots show each preSx-MAPT carrier’s mean gray matter volume over time within those regions showing significant longitudinal decline compared to HC2. Each carrier was defined as preSx-MAPT at baseline and the clinical diagnoses at each participant’s last visit are annotated by different colors. Cross-sectional comparisons of regional gray matter showed no significant group differences between presymptomatic subgroups and controls. All maps are superimposed on the MNI brain template. Abbreviations: bvFTD = behavioral variant frontotemporal dementia; HC2 = healthy controls matched to presymptomatic carriers; MCI = mild cognitive impairment; ns = no significant regions; preSx1 = presymptomatic carrier subgroup 1 defined by whole-brain connectivity-based clustering; preSx2 = presymptomatic carrier subgroup 2 defined by whole-brain connectivity-based clustering.

References

    1. Hutton M, Lendon CL, Rizzu P, et al. Association of missense and 5Ј-splice-site mutations in tau with the inherited dementia FTDP-17. Nature 1998;393(6686):702–705. - PubMed
    1. Moore KM, Nicholas J, Grossman M, et al. Age at symptom onset and death and disease duration in genetic frontotemporal dementia: an international retrospective cohort study. The Lancet Neurology 2020;19(2):145–156. - PMC - PubMed
    1. Whitwell JL, Josephs KA, Avula R, et al. Altered functional connectivity in asymptomatic MAPT subjects: A comparison to bvFTD. Neurology 2011;77(9):866–874. - PMC - PubMed
    1. Dopper EGP. Structural and functional brain connectivity in presymptomatic familial frontotemporal dementia. Neurology 2013;80(9):814–823. - PMC - PubMed
    1. Rohrer JD, Nicholas JM, Cash DM, et al. Presymptomatic cognitive and neuroanatomical changes in genetic frontotemporal dementia in the Genetic Frontotemporal dementia Initiative (GENFI) study: a cross-sectional analysis. The Lancet Neurology 2015;14(3):253–262. - PMC - PubMed

Publication types