. 2022 Jun 24;2(3):e12089.
doi: 10.1002/jcv2.12089. eCollection 2022 Sep.

Anxiety disorders across middle childhood and early adolescence in a UK population-based cohort

Affiliations

Anxiety disorders across middle childhood and early adolescence in a UK population-based cohort

Isabel Morales-Muñoz et al. JCPP Adv. .

Abstract

Background: Patterns of development and underlying factors explaining anxiety disorders in children and adolescents are under-researched, despite their high prevalence, impact and associations with other mental disorders. We aimed to a] understand the pattern and persistence of specific anxiety disorders; b] examine differing trajectories of symptoms of specific anxiety disorders and; c] examine socio-demographic and health-related predictors of persistent anxiety disorder-specific symptoms, across middle childhood to early adolescence.

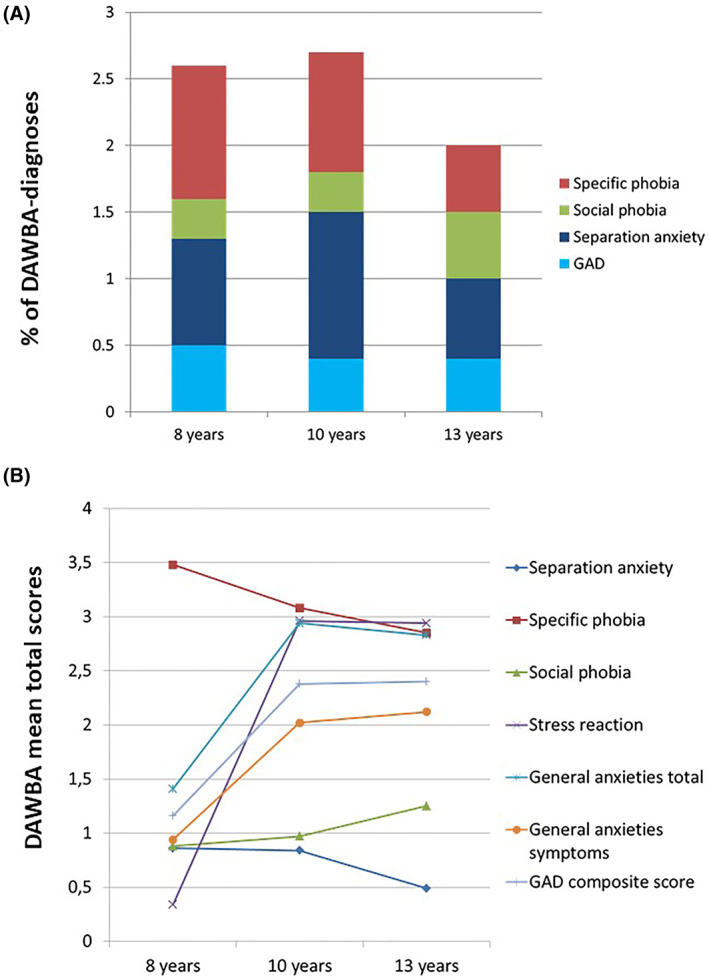
Methods: The current study used data from 8122 participants in the Avon Longitudinal Study of Parents and Children birth cohort. The Development and Wellbeing Assessment questionnaire was administered to parents to capture child and adolescent anxiety total scores and DAWBA-derived diagnoses. Separation anxiety, specific phobia, social anxiety, acute stress reaction, and generalized anxiety at 8, 10 and 13 years were selected. Further, we included the following socio-demographic and health-related predictors: sex, birth weight, sleep difficulties at 3.5 years, ethnicity, family adversity, maternal age at birth, maternal postnatal anxiety, maternal postnatal depression, maternal bonding, maternal socio-economic status and maternal education.

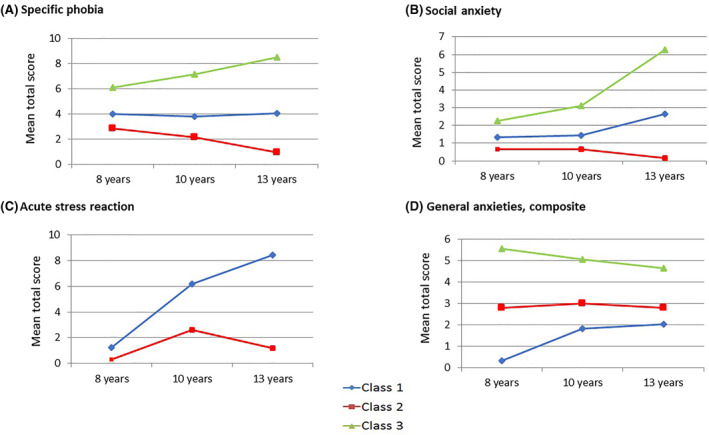
Results: Different anxiety disorders presented different prevalence and patterns of development over time. Further, latent class growth analyses yielded a trajectory characterized by individuals with persistent high levels of anxiety across childhood and adolescence; for specific phobia (high = 5.8%; moderate = 20.5%; low = 73.6%), social anxiety (high = 3.4%; moderate = 12.1%; low = 84.5%), acute stress reaction (high = 1.9%; low = 98.1%) and generalized anxiety (high = 5.4%; moderate = 21.7%; low = 72.9%). Finally, the risk factors associated with each of the persistent high levels of anxiety disorders were child sleeping difficulties and postnatal maternal depression and anxiety.

Conclusions: Our findings show that a small group of children and young adolescents continue to suffer from frequent and severe anxiety. When considering treatment strategies for anxiety disorders in this group, children's sleep difficulties and postnatal maternal depression and anxiety need to be assessed as these may predict a more prolonged and severe course of illness.

Keywords: ALSPAC; anxiety disorders; early adolescence; trajectories.


Conflict of interest statement

The authors have declared that they have no competing or potential conflicts of interest.

Figures

FIGURE 1
FIGURE 1
Prevalence and developmental course of Development and Wellbeing Assessment (DAWBA) anxiety disorders from 8 to 13 years old, for anxiety diagnosis and anxiety symptomatology. (A) Represents the prevalence for the diagnosis for each anxiety disorder, at 8, 10 and 13 years. Purple color represents specific phobia, green social phobia, red separation anxiety and blue generalized anxiety disorder (GAD). The graph indicates that at 8 years, specific phobia is the most prevalent diagnosis, while at 10 years the most prevalent is separation anxiety. At 13 years, separation anxiety seems to be still the most prevalent diagnosis. Concerning social phobia, the prevalence of this diagnosis is the lowest at 8 and 10 years, while it considerably increases at 13 years to become the second most prevalent one. Finally, concerning GAD, this is the second lowest at 8 years, while the one with lowest prevalence at 10 and 13 years. (B) Reflects the mean total scores for the symptomatology for each anxiety disorder, at each time point. Specific phobia shows a decreasing pattern over time with average mean values around 3. Generalized anxiety shows an increasing pattern over time, specially from 8 to 10 years, with average mean values at 10 and 13 years being close to 3. Social phobia presents overall low mean values over time, with the mean scores showing an increasing trend over time (i.e. mean close to 1 at 8 and 10 years, and close to 1.5 at 13 years); and separation anxiety shows a decreasing pattern over time, with mean values being lower than 1 at all the time points. Finally, acute stress reaction shows an increasing pattern over time, especially from 8 to 10 years old, with the mean values increasing from 0.2 at 8 years, to 3 at 10 and 13 years old
FIGURE 2
FIGURE 2
Growth trajectories of specific phobia, social anxiety, acute stress reaction and generalized anxiety across childhood and adolescence. The latent class growth analyses (LCGA) detected a best model fit for 3 classes for all anxiety disorders, except for acute stress reaction with a best model fit for 2 classes. X axis represents the three time points in childhood and adolescence, and the Y axis represents the mean total score of Development and Wellbeing Assessment (DAWBA) anxiety disorders. (A) reflects the trajectories for specific phobia. Class 3 (green line) is characterized by persistent (and increasing) high levels. Class 1 (blue line) represents persistent (and stable) moderate levels. Finally, class 2 (red line) reflects persistent (and decreasing) low levels. (B) shows the trajectories for social anxiety. These trajectories show a class 3 (green line) characterized by persistent (and increasing) high levels; a class 1 (blue line) reflecting persistent (and increasing) moderate levels; and finally a class 2 (red line) representing persistent (and decreasing) low levels. (C) shows the trajectories for acute stress reaction. These trajectories show a class 1 (blue line) characterized by persistent (and increasing) high levels; and a class 2 (red line) characterized by persistent (and increasing and decreasing) low levels. Finally, (D) reflects the trajectories for the composite score of generalized anxieties. The trajectories show a class 3 (green line) characterized by persistent (and decreasing) high levels; and class 2 (red line) characterized by persistent (and increasing and decreasing) moderate levels; and a class 1 (blue line) characterized by persistent (and increasing) low levels

Similar articles

Cited by

References

    1. Achenbach, T. M. , Howell, C. T. , McConaughy, S. H. , & Stanger, C. (1998). Six‐year predictors of problems in a national sample: IV. Young adult signs of disturbance. Journal of the American Academy of Child & Adolescent Psychiatry, 37(7), 718–727. - PubMed
    1. Allan, N. P. , Capron, D. W. , Lejuez, C. W. , Reynolds, E. K. , MacPherson, L. , & Schmidt, N. B. (2014). Developmental trajectories of anxiety symptoms in early adolescence: The influence of anxiety sensitivity. Journal of Abnormal Child Psychology, 42(4), 589–600. - PMC - PubMed
    1. Bandelow, B. , & Michaelis, S. (2015). Epidemiology of anxiety disorders in the 21st century. Dialogues in Clinical Neuroscience, 17(3), 327–335. - PMC - PubMed
    1. Beesdo, K. , Knappe, S. , & Pine, D. S. (2009). Anxiety and anxiety disorders in children and adolescents: Developmental issues and implications for DSM‐V. Psychiatric Clinics of North America, 32(3), 483–524. 10.1016/j.psc.2009.06.002 - DOI - PMC - PubMed
    1. Beesdo‐Baum, K. , & Knappe, S. (2012). Developmental epidemiology of anxiety disorders. Child and Adolescent Psychiatric Clinics, 21(3), 457–478. - PubMed