. 2023 Jul 25;52(29):9964-9982.
doi: 10.1039/d3dt01632c.

Indolo[2,3- e]benzazocines and indolo[2,3- f]benzazonines and their copper(II) complexes as microtubule destabilizing agents

Affiliations

Indolo[2,3- e]benzazocines and indolo[2,3- f]benzazonines and their copper(II) complexes as microtubule destabilizing agents

Christopher Wittmann et al. Dalton Trans. .

Abstract

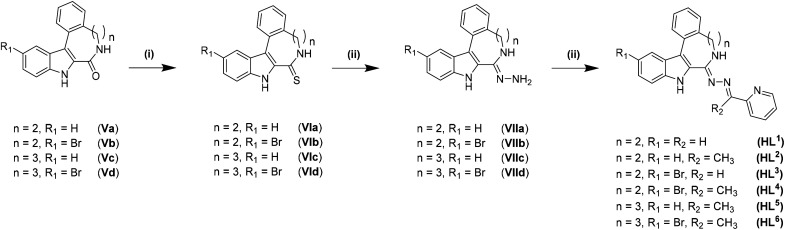
A series of four indolo[2,3-e]benzazocines HL1-HL4 and two indolo[2,3-f]benzazonines HL5 and HL6, as well as their respective copper(II) complexes 1-6, were synthesized and characterized by 1H and 13C NMR spectroscopy, ESI mass spectrometry, single crystal X-ray diffraction (SC-XRD) and combustion analysis (C, H, N). SC-XRD studies of precursors Vd, VIa·0.5MeOH, of ligands HL4 and HL6·DCM, and complexes 2·2DMF, 5·2DMF, 5'·iPrOH·MeOH provided insights into the energetically favored conformations of eight- and nine-membered heterocycles in the four-ring systems. In addition, proton dissociation constants (pKa) of HL1, HL2 and HL5, complexes 1, 2 and 5, overall stability constants (log β) of 1, 2 and 5 in 30% (v/v) DMSO/H2O at 298 K, as well as thermodynamic solubility of HL1-HL6 and 1-6 in aqueous solution at pH 7.4 were determined by UV-vis spectroscopy. All compounds were tested for antiproliferative activity against Colo320, Colo205 and MCF-7 cell lines and showed IC50 values in the low micromolar to sub-micromolar concentration range, while some of them (HL1, HL5 and HL6, 1, 2 and 6) showed remarkable selectivity towards malignant cell lines. Ethidium bromide displacement studies provided evidence that DNA is not the primary target for these drugs. Rather, inhibition of tubulin assembly is likely the underlying mechanism responsible for their antiproliferative activity. Tubulin disassembly experiments showed that HL1 and 1 are effective microtubule destabilizing agents binding to the colchicine site. This was also confirmed by molecular modelling investigations. To the best of our knowledge, complex 1 is the first reported transition metal complex to effectively bind to the tubulin-colchicine pocket.


Conflict of interest statement

The authors declare no competing interest.

Figures

Chart 1
Chart 1. The frameworks of the naturally occurring latonduines (A) and of indolo[2,3-c]quinoline (B), indolo[3,2-d]benzazepine (paullone, C), indolo[2,3-d]benzazepine (D), indolo[2,3-e]benzazocine (E) and indolo[2,3-f]benzazonine (F).
Chart 2
Chart 2. Structural relationship between previously reported indoloquinoline and indolobenzazepine tridentate ligands.
Chart 3
Chart 3. Indolo[2,3-e]benzazocine and indolo[2,3-f]benzazonine ligands and their respective copper(ii) complexes synthesized in this work; underlined numbers indicate compounds studied by SC-XRD.
Scheme 1
Scheme 1. Synthesis of indolobenzazocines Va, Vb and indolobenzazonines Vc, Vd. Reagents and conditions: (i) 2-(2-bromophenyl/2-iodophenyl)ethanamine/3-(2-iodophenyl)propanamine, EDCI·HCl, DMAP, DCMdry, 0 °C – RT, 18 h; (ii) Boc2O, DMAP, MeCNdry, RT, 18 h; (iii) Pd(OAc)2, PPh3, Ag2CO3, DMFdry, 110 °C/140 °C, 2 h; (iv) HClconc, dioxane, 80 °C, 2 h/EtOH : HClconc 4 : 1, 1 h.
Scheme 2
Scheme 2. Synthesis of ligands HL1–HL6 derived from indolo[2,3-e]benzazocines and indolo[2,3-f]benzazonines. Reagents and conditions: (i) Lawesson's reagent, 1,4-dioxanedry, 4 h, 115 °C; (ii) H2N-NH2·H2O, CHCl3, reflux, 3 h; (iii) 2-acetylpyridine/2-formylpyridine, anoxic EtOH, 85 °C, 16 h.
Fig. 1
Fig. 1. ORTEP views of (a) HL4 and (b) HL6 with thermal ellipsoids at 50% probability level.
Fig. 2
Fig. 2. ORTEP views of the complexes: (a) 2 with thermal ellipsoids at 50% probability level, (b) 5 with thermal ellipsoids at 40% probability level and 5′ with thermal ellipsoids at 50% probability level. Selected bond distances (Å), bond angles (deg) and torsion angles (deg) (a) in 2: Cu–N7 2.0375(17), Cu–N15 1.9571(16), Cu–N18 2.0554(17), Cu–Cl1 2.4940(5), Cu–Cl2 2.2325(5), N7–C8 1.291(2), C8–N14 1.385(3), N14–N15 1.368(2), N15–C16 1.277(3), C16–C17 1.483(3), C17–N18 1.362(3); N7–Cu–N15 79.40(7), N15–Cu–N18 78.04(7), ΘC4a–C5–C6–N7 66.3(3); τ5 = 0.13; (b) in 5: Cu–N8 1.999(5), Cu–N16 1.994(5), Cu–N19 2.044(5), Cu–Cl1 2.2684(17), Cu–Cl2 2.4002(16); N8–C9 1.308(7), C9–N15 1.395(7), N15–N16 1.331(7), N16–C17 1.300(7), C17–C18 1.458(8), C18–N19 1.363(8); N8–Cu–N16 78.8(2), N16–Cu–N19 78.47(19); ΘC4a–C5–C6–C7 −85.1(7), ΘC5–C6–C7–N8 84.9(7); τ5 = 0.13; (c) in 5′: Cu–N8 1.9511(16), Cu–N16 1.9460(16), Cu–N19 2.0249(17), Cu–Cl 2.2006(6), N8–C9 1.319(3), C9–N15 1.357(2), N15–N16 1.365(2), N16–C17 1.297(3), C17–C18 1.475(3), C18–N19 1.359(3); N8–Cu–N16 80.23(7), N16–Cu–N19 80.39(7); ΘC4a–C5–C6–C7 −84.0(2), ΘC5–C6–C7–N8 89.4(2).
Fig. 3
Fig. 3. ORTEP view of the complex 3 with thermal ellipsoids at 50% probability level. Selected bond distances (Å), bond angles (deg) and torsion angles (deg): Cu–N7 2.0120(16), Cu–N15 1.9676(15), Cu–N18 2.0279(16), Cu–Cl1 2.4341(7), Cu–Cl2 2.2802(7); N7–C8 1.289(2), C8–N14 1.388(2), N14–N15 1.365(2), N15–C16 1.279(2), C16–C17 1.478(3), C17–N18 1.363(2); N7–Cu–N15 79.49(7), N15–Cu–N18 78.29(6), ΘC4a–C5–C6–N7 −48.6(2); τ5 = 0.17.
Scheme 3
Scheme 3. The three most stable conformers of cyclononane reported by Hendrickson.
Scheme 4
Scheme 4. Main conformers of cyclooctane according to Hendrickson.
Fig. 4
Fig. 4. Conformation of the indolobenzazonine ring in Vd (a), HL6 (b) and 5 (c).
Fig. 5
Fig. 5. Conformation of the indolobenzazocine ring in VIa (a), HL4 (b) and 2 (c) with the indole moiety removed for better visualization.
Fig. 6
Fig. 6. (a) UV–vis spectra of HL1 measured at various pH values. (b) The ligand in its diprotonated form. (c) Molar absorbance spectra computed for selected ligand species in the various protonation states. (d) Concentration distribution curves and the absorbance values measured at 332 nm (×) together with the fitted line {cHL1 = 10 μM, T = 298 K, l = 5 cm, I = 0.10 M (KCl), 30% (v/v) DMSO/H2O}.
Scheme 5
Scheme 5. Stepwise proton dissociation processes for HL1 and its tautomeric forms.
Fig. 7
Fig. 7. (a) UV–vis spectra for the Cu(ii)–HL1 system at various pH values. (b) Molar absorbance spectra computed for selected complex species in the various protonation states {cHL1 = 10 μM, cCu(II) = 10 μM, T = 298 K, l = 5 cm, I = 0.10 M (KCl), 30% (v/v) DMSO/H2O}.
Fig. 8
Fig. 8. (a) Fluorescence emission spectra of the ct-DNA–ethidium system in the presence of an increasing amount of 4(6), with the spectrum of free ethidium (red dashed line) plotted as well. (b) Fluorescence intensity values of the ct-DNA–ethidium in the presence of different compounds, symbols denote 4(6) (●), 4(7) (◆), 1 (▲), 2 (×), 4 (+), 5 (◑), 6 (■), and HL1 (Δ), red dashed line denotes the emission signal of free ethidium. At the indicated ratios, precipitate formation was not observed {cDNA = 0.5 μM, cethidium = 0.25 μM; λEX = 510 nm, λEM = 610 nm; T = 298 K; 10 mM HEPES, pH = 7.40}.
Fig. 9
Fig. 9. The complex concentration needed to result in 50% decrease in the fluorescence intensity of the ct-DNA–ethidium system. {cDNA = 0.5 μM, cethidium = 0.25 μM; λEX = 510 nm, λEM = 610 nm; T = 298 K; 10 mM HEPES, pH = 7.40}.
Fig. 10
Fig. 10. Fluorescence intensity values of the ct-DNA–ethidium of various ligand systems, symbols denote HL1 (Δ), HL2 (×), HL5 (◐) and HL6 (□), while red dashed line denotes the emission signal of free ethidium. At the indicated ratios precipitate formation was not observed. {cDNA = 0.5 μM, cethidium = 0.25 μM; λEX = 510 nm, λEM = 610 nm; T = 298 K; 10 mM HEPES, pH = 7.40}.
Fig. 11
Fig. 11. (a) The docked poses of HL1 in the tubulin binding site, the co-crystalised ligand DAMA-C is shown in stick format, its hydrogen atoms were omitted for clarity. The configuration of the GS prediction is shown in blue, and the ASP pose is green, both are shown as lines. The blue color depicts regions with a partial positive charge on the protein surface, while red and grey indicate regions with a partial negative charge and neutral areas, respectively. (b) The ASP predicted binding of HL1, the amino acids interacting with the substrate are shown as continuous lines. Dashed purple lines are used for illustration of the hydrophobic contacts, while dashed grey lines for representaton of the weak hydrogen bonding.
Fig. 12
Fig. 12. (a) The docked pose of 1 in the tubulin binding site, the co-crystalised ligand DAMA-C is shown in stick format, its hydrogen atoms were omitted for clarity. The configuration of the GS prediction is shown as blue lines. The blue color depicts regions with a partial positive charge on the protein surface, while red and grey colors indicate regions with a partial negative charge and neutral areas, respectively. (b) The predicted binding interactions of complex 1 with amino acids within 3.5 Å radius are illustrated in line format, while the potentially chelating amino acid residues βLeu255 and βLys352 are depicted in stick format. The distance between the oxygen atoms of βLeu255 and βLys352 to the copper(ii) ion (black solid line) are of 5.8 and 5.1 Å, respectively.

References

    1. Greenwell M. Rahman P. K. S. M. Int. J. Pharma Sci. Res. 2015;6:4103–4112. - PMC - PubMed
    1. Linington R. G. Williams D. E. Tahir A. Van Soest R. Andersen R. J. Org. Lett. 2003;5:2735–2738. doi: 10.1021/ol034950b. - DOI - PubMed
    1. Akunuri R. Vadakattu M. Bujji S. Veerareddy V. Madhavi Y. V. Nanduri S. Eur. J. Med. Chem. 2021;220:113445. doi: 10.1016/j.ejmech.2021.113445. - DOI - PubMed
    1. Martino E. Casamassima G. Castiglione S. Cellupica E. Pantalone S. Papagni F. Rui M. Siciliano A. M. Collina S. Bioorg. Med. Chem. Lett. 2018;28:2816–2826. doi: 10.1016/j.bmcl.2018.06.044. - DOI - PubMed
    1. Brancale A. Silvestri R. Med. Res. Rev. 2007;27:209–238. doi: 10.1002/med.20080. - DOI - PubMed