

Loss of TDP-43 oligomerization or RNA binding elicits distinct aggregation patterns
- PMID: 37431963
- PMCID: PMC10476175
- DOI: 10.15252/embj.2022111719
Loss of TDP-43 oligomerization or RNA binding elicits distinct aggregation patterns
Abstract
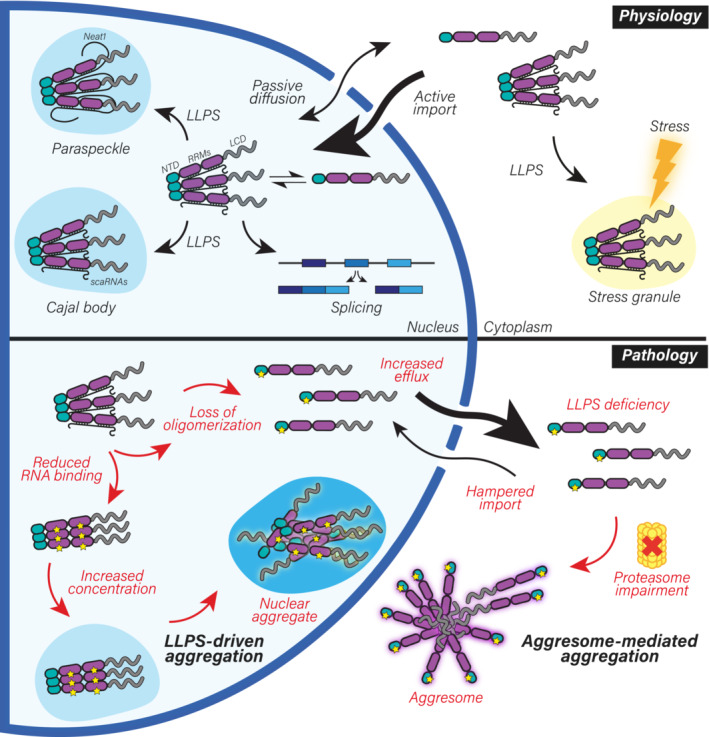
Aggregation of the RNA-binding protein TAR DNA-binding protein 43 (TDP-43) is the key neuropathological feature of neurodegenerative diseases, including amyotrophic lateral sclerosis (ALS) and frontotemporal lobar degeneration (FTLD). In physiological conditions, TDP-43 is predominantly nuclear, forms oligomers, and is contained in biomolecular condensates assembled by liquid-liquid phase separation (LLPS). In disease, TDP-43 forms cytoplasmic or intranuclear inclusions. How TDP-43 transitions from physiological to pathological states remains poorly understood. Using a variety of cellular systems to express structure-based TDP-43 variants, including human neurons and cell lines with near-physiological expression levels, we show that oligomerization and RNA binding govern TDP-43 stability, splicing functionality, LLPS, and subcellular localization. Importantly, our data reveal that TDP-43 oligomerization is modulated by RNA binding. By mimicking the impaired proteasomal activity observed in ALS/FTLD patients, we found that monomeric TDP-43 forms inclusions in the cytoplasm, whereas its RNA binding-deficient counterpart aggregated in the nucleus. These differentially localized aggregates emerged via distinct pathways: LLPS-driven aggregation in the nucleus and aggresome-dependent inclusion formation in the cytoplasm. Therefore, our work unravels the origins of heterogeneous pathological species reminiscent of those occurring in TDP-43 proteinopathy patients.
Keywords: LLPS; RNA; TDP-43; aggregation; oligomerization.
© 2023 The Authors. Published under the terms of the CC BY NC ND 4.0 license.
Conflict of interest statement
The authors declare that they have no conflict of interest.
Figures
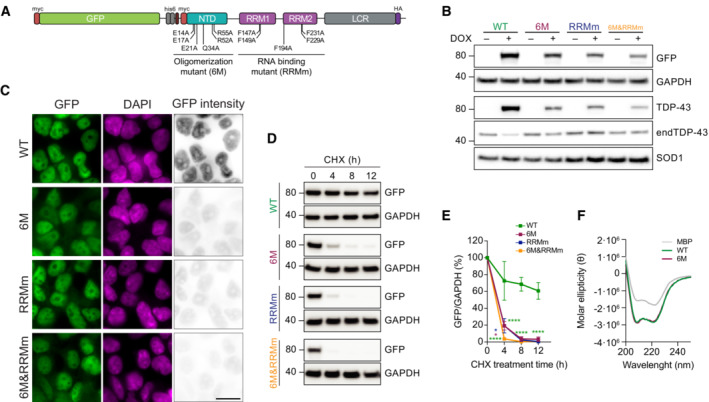
Schematic representation depicting the mutations disrupting the oligomerization and/or RNA binding property of the GFP‐TDP‐43 variants used to develop the inducible, isogenic HEK293 cell lines. GFP: green fluorescent protein, NTD: N‐terminal domain, RRM: RNA‐recognition motif, LCR: low complexity region.
Western blot analysis of the generated isogenic cell lines described in (A) after inducing GFP‐TDP‐43 expression for 48 h showing the tightness of the doxycycline (DOX)‐modulated expression system. Note also the different protein levels of the expressed variants. endTDP‐43: endogenous TDP‐43.
Representative images of widefield fluorescence microscopy of the isogenic cell lines depicted in (B). GFP brightness is adjusted in each condition for optimal visualization of GFP‐TDP‐43 localization. Original intensity values are represented in the right column using grayscale. Cell nuclei are stained with DAPI. Scale bar: 20 μm.
GFP‐TDP‐43 expression was induced with DOX for 24 h before cycloheximide (CHX) treatment for the indicated times and western blot analysis.
Quantification of the GFP signal from (D). N = 3 independent experiments. Two‐way ANOVA with Tukey's multiple comparisons post hoc test.
Average far‐UV CD spectra of purified maltose‐binding protein (MBP) and TDP‐43‐MBP variants from N = 3 independent experiments. ****P < 0.0001. Graph bars represent mean ± SD.
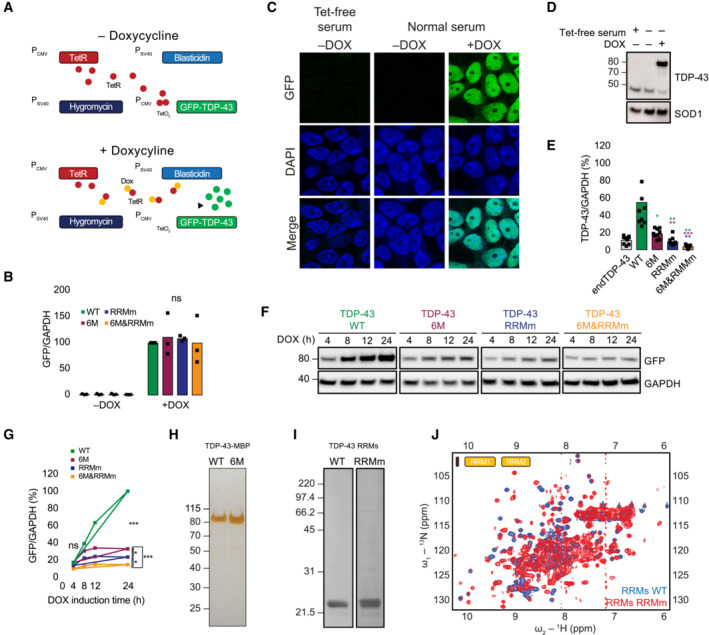
Schematic representation of the Flp‐In T‐Rex system. Dox: doxycycline, GFP: green fluorescent protein, TetR: tetracycline repressor.
RNA levels of the GFP‐TDP‐43 variants after 48 h of expression in the isogenic cell lines measured by qPCR with primers specifically targeted to the GFP sequence. N = 3 independent experiments. Two‐way ANOVA with Tukey's multiple comparisons post hoc test.
Representative image of confocal fluorescence microscopy showing the tight expression regulation of the Flp‐In T‐Rex system, which is unaffected by the residual tetracycline (Tet) present in the regular serum used for the preparation of cell culture medium. Expression of GFP‐TDP‐43 WT is only observable upon addition of doxycycline (DOX) for 48 h. Nuclei are stained with DAPI. Scale bar: 20 μm.
Western blot analysis of the conditions described in (C).
Quantification of the TDP‐43 signal from Fig 1B using a total TDP‐43 antibody, including endogenous TDP‐43 (endTDP‐43) and the four GFP‐TDP‐43 variants. N = 3 independent experiments. Repeated measures one‐way ANOVA with Greenhouse–Geisser correction and Tukey's multiple comparisons post hoc test.
Western blot analysis of a time course of the different GFP‐TDP‐43 variant expression upon induction with DOX.
Quantification of the GFP signal from (F). N = 3 independent experiments. Two‐way ANOVA with Tukey's multiple comparisons post hoc test.
Silver‐stained gel showing the purity of 1 μg of the isolated TDP‐43‐MBP variants. (I) Coommasie stained gel showing the purity of the purified TDP‐43 RRM constructs.
Overlay of 2D 1H‐15N HSQC spectra from purified His‐tagged, 15N‐isotopically labeled TDP‐43 RRMs WT (blue) and RRMm RRMs (red). The presence of dispersed peaks in the spectra indicates that both WT and RRMm RRMs are folded, and are compatible with the formation of α‐helix and β‐strand structures. In case of unfolding, all 1H NMR signals would pool around 8 ppm. ns: not significant, *P < 0.05, **P < 0.01, ***P < 0.001. Graph bars represent mean ± SD.
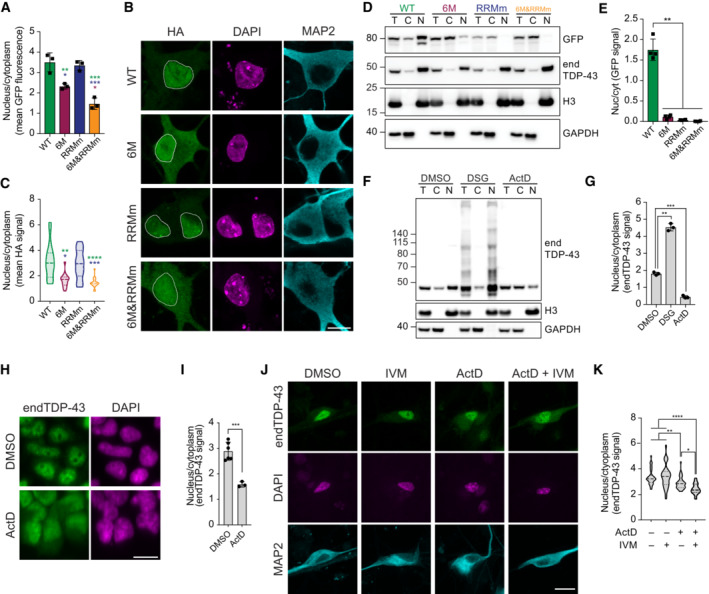
Quantification of nucleocytoplasmic levels of GFP‐TDP‐43 from the immunocytochemistry images shown in Fig 1C. N = 3 independent experiments. One‐way ANOVA with Tukey's multiple comparisons post hoc test.
Representative maximum intensity Z‐projections from confocal fluorescence imaging of human neurons transduced with TDP‐43‐HA variants and immunolabeled for the HA tag and the neuron‐specific marker MAP2. Scale bar: 10 μm.
Quantification of nucleocytoplasmic levels of TDP‐43‐HA from the immunocytochemistry images shown in (B). N = 14–20 cells. Kruskal–Wallis test with Dunn's multiple comparisons post hoc test.
GFP‐TDP‐43 expression was induced with doxycycline (DOX) for 4 h before nucleocytoplasmic fractionation and subsequent analysis of GFP‐TDP‐43 and endogenous TDP‐43 (endTDP‐43) levels by western blot. T: total lysate, C: cytoplasmic fraction, N: nuclear fraction.
Quantification of the GFP signal from (D). Repeated measures one‐way ANOVA with Greenhouse–Geisser correction and Tukey's multiple comparisons post hoc test. Cyt: cytoplasm, Nuc: nucleus.
HEK293 cells were treated with ActD to inhibit transcription or subjected to protein–protein cross‐linking with DSG followed by nucleocytoplasmic fractionation and western blot analysis. T: total lysate, C: cytoplasmic fraction, N: nuclear fraction, H3: histone H3.
Quantification of endTDP‐43 signal from (F). N = 3 independent experiments. Repeated measures one‐way ANOVA with Greenhouse–Geisser correction and Dunnett's multiple comparisons post hoc test.
Representative images of widefield fluorescence microscopy of HEK293 cells treated with ActD for 4 h and immunolabeled for TDP‐43. Scale bar: 20 μm.
Quantification of nucleocytoplasmic levels of endTDP‐43 in the immunocytochemistry images shown in (H). N = 3 independent experiments. Unpaired two‐tailed t‐test.
Representative images of confocal fluorescence microscopy of human neural cultures treated with ActD and ivermectin (IVM) and immunolabeled for TDP‐43 and the neuron‐specific marker MAP2. Scale bar: 20 μm.
Quantification of nucleocytoplasmic levels of endTDP‐43 in the immunocytochemistry images shown in (J). Kruskal–Wallis test with Dunn's multiple comparisons post hoc test. N = 23–48 fields corresponding to a total of 351–569 neurons per condition. *P < 0.05, **P < 0.01, ***P < 0.001, ****P < 0.0001. Graph bars represent mean ± SD. Violin plots show mean and quartiles. Cell nuclei are stained with DAPI in (B, H, J).
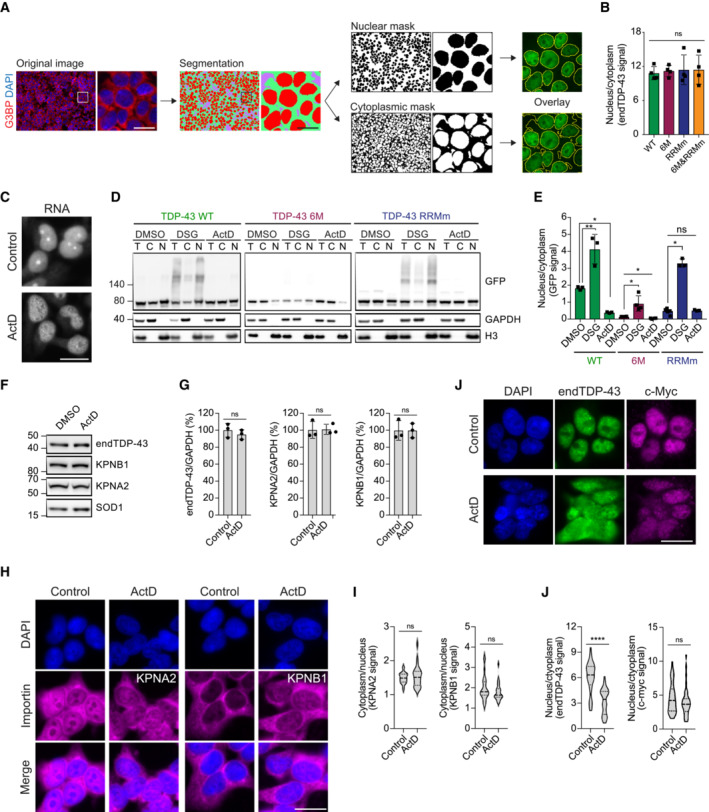
Schematic of the pipeline for the quantification of nuclear and cytoplasmic GFP‐TDP‐43 fluorescence levels with the Fiji plug‐in Trainable Weka Segmentation. Scale bar: 20 μm.
Quantification of endogenous TDP‐43 (endTDP‐43) signal from Fig 2D. N = 3 independent experiments. Repeated measures one‐way ANOVA with Greenhouse–Geisser correction and Tukey's multiple comparisons post hoc test. ns: not significant. Graph bars represent mean ± SD.
Representative images of widefield fluorescence microscopy of HEK293 cells treated with ActD showing the total RNA pattern. Note the absence of rRNA staining in the nucleoli upon ActD treatment indicating that RNA transcription has been halted. Scale bar: 20 μm.
After expression of GFP‐TDP‐43 (WT, 6M or RBDm) for 48 h, the cell lines were treated with 5 μg/ml ActD for 4 h to inhibit transcription or DSG to cross‐link protein–protein interactions before performing nucleocytoplasmic fractionation and western blot analysis. Note how the fractionation of the RNA‐binding mutant GFP‐TDP‐43 (RRMm) resembles that of ActD‐treated GFP‐TDP‐43 WT, and how the stabilization of TDP‐43 oligomerization through DSG cross‐link does not affect the localization of oligomerization‐deficient GFP‐TDP‐43 as much as it does for the oligomerization‐competent GFP‐TDP‐43 WT.
Quantification of the GFP signal from (D). N = 3 independent experiments. Repeated measures one‐way ANOVA with Tukey's multiple comparisons post hoc test.
Expression of the importins involved in the nuclear translocation of TDP‐43 (KPNA2 and KPNB1) was analyzed in HEK293 cells by western blot upon treatment with 5 μg/ml ActD for 4 h.
Quantification of the endogenous TDP‐43 (endTDP‐43), KPNA2, and KPNB1 signal from (E). Repeated measures one‐way ANOVA with Greenhouse–Geisser correction and Dunnett's multiple comparisons post hoc test. (H) Representative images of widefield fluorescence microscopy of HEK293 cells treated with 5 5 μg/ml ActD for 4 h showing the distribution of KPNA2 and KPNB1. Scale bar: 20 μm.
Quantification of the nucleocytoplasmic distribution of KPNA2 and KPNB1 in the immunocytochemistry images shown in (H). N = 25 cells. Unpaired two‐tailed t‐test.
Representative images of widefield fluorescence microscopy of HEK293 cells treated with 5 μg/ml ActD for 4 h showing the distribution of c‐myc, a non‐RNA‐binding cargo of the KPNA2/KPNB1 complex. Scale bar: 20 μm.
Quantification of the endogenous TDP‐43 (endTDP‐43) and c‐myc levels in the immunocytochemistry images shown in (I). N = 40 cells. Mann–Whitney U‐test. Nuclei are stained with DAPI in (A, H and J). Ns: not significant, *P < 0.05, **P < 0.01, ****P < 0.0001. Graph bars represent mean ± SD. Violin plots show mean and quartiles.
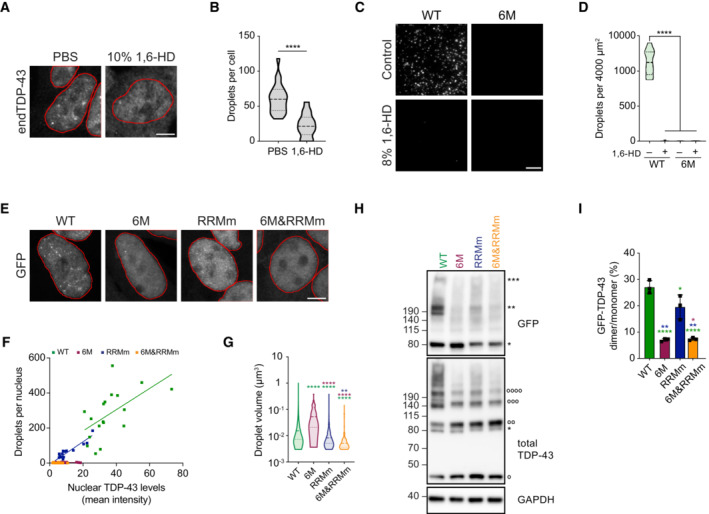
Representative maximum intensity Z‐projections from confocal fluorescence imaging (thickness of ~10 μm, in steps of 0.21 μm) of HEK293 cells after mock or 1,6‐hexanediol (1,6‐HD) treatment for 15 min stained for endogenous TDP‐43 (endTDP‐43). Scale bar: 5 μm.
Quantification of three‐dimensional (3D) reconstructions from the images of the conditions shown in (A) depicting the number of nuclear condensates per cell. N = 14–23 cells. Unpaired two‐tailed t‐test.
Fluorescence microscopy images of 10 μM purified full‐length TDP‐43 and its oligomerization‐deficient counterpart showing different abilities to undergo LLPS and its disruption by 1,6‐HD treatment for 10 min. Scale bar: 10 μm.
Quantification of the number of condensates in the conditions shown in (C) per 4,000 μm2 field. N = 10 independent experiments. Kruskal–Wallis test with Dunn's multiple comparisons post hoc test.
Representative maximum intensity Z‐projections (thickness of ~10 μm, in steps of 0.21 μm) from confocal fluorescence microscopy of the isogenic cell lines expressing GFP‐TDP‐43 for 48 h with doxycycline (DOX). Scale bar: 5 μm.
3D quantification of the number of nuclear condensates per cell after GFP‐TDP‐43 expression for 48 h. N = 16–22 cells.
3D quantification of the volume of the nuclear condensates per cell in the conditions described in (E). N = 51–4,401 condensates. Kruskal–Wallis test with Dunn's multiple comparisons post hoc test.
GFP‐TDP‐43 expression was induced with DOX for 4 h before crosslinking protein–protein interactions with DSG and subsequent analysis by western blot. *, **, and *** indicate GFP‐TDP‐43 monomers, dimers, and trimers, respectively. °, °°, °°°, and °°°° indicate endTDP‐43 monomers, dimers, trimers, and tetramers.
Quantification of GFP‐TDP‐43 dimer/monomer ratio based on the GFP signal from (H). N = 3 independent experiments. Repeated measures one‐way ANOVA with Greenhouse–Geisser correction and Tukey's multiple comparisons post hoc test. *P < 0.05, **P < 0.01, ****P < 0.0001. Graph bars represent mean ± SD. Violin plots show mean and quartiles.
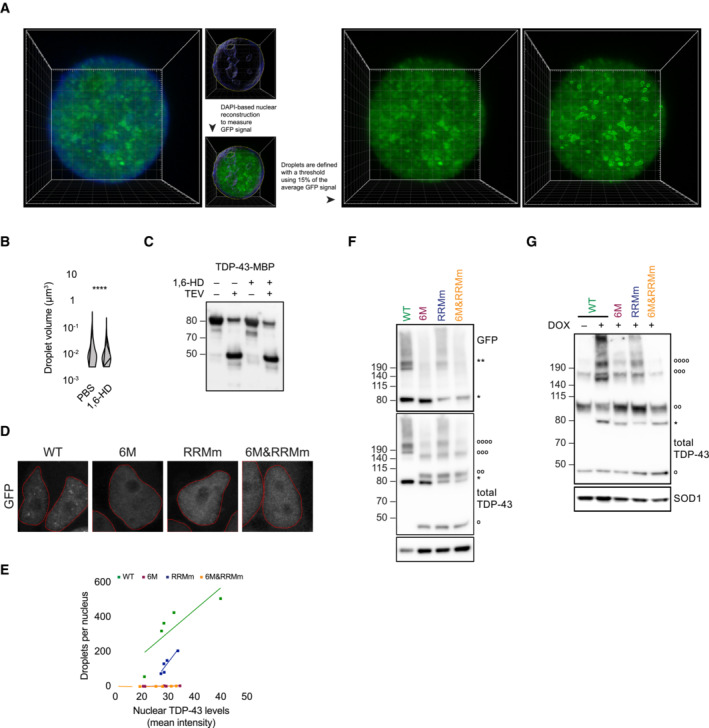
Schematic of the Imaris pipeline for the quantification of the average nuclear TDP‐43 fluorescence as well as the definition of the nuclear TDP‐43 droplets that were subsequently analyzed for total number and volume. Pipeline shown for GFP‐TDP‐43 signal, but the same approach was used with fluorescence derived from the immunostaining of endogenous TDP‐43.
3D quantification of the volume of the nuclear droplets per cell in the conditions described in Fig 3A. N = 344–1,679 droplets. Mann–Whitney U‐test.
Western blot analysis of the cleavage of the maltose‐binding protein (MBP) tag of recombinant full‐length TDP‐43 by TEV protease for the in vitro LLPS assay shown in Fig 2C. Note that the presence of 1,6‐hexanediol (1,6‐HD) does not affect the cleavage of the tag.
Representative maximum intensity Z‐projections (thickness of ~10 μm, in steps of 0.21 μm) from confocal fluorescence microscopy of the isogenic cell lines expressing GFP‐TDP‐43 for 4 h with doxycycline (DOX). Scale bar: 5 μm.
3D quantification of the number of nuclear droplets per cell after GFP‐TDP‐43 expression for 4 h. N = 5 cells.
Expression of GFP‐TDP‐43 variants was induced for 48 h before DSG cross‐linking of protein–protein interactions and subsequent analysis by western blot. * and ** indicate GFP‐TDP‐43 monomers and dimers, respectively. °, °°, °°°, and °°°° indicate endogenous TDP‐43 (endTDP‐43) monomers, dimers, trimers, and tetramers.
Expression of GFP‐TDP‐43 variants was induced for 4 h before DSG cross‐linking of protein–protein interactions and subsequent analysis by western blot. * indicates GFP‐TDP‐43 monomers. °, °°, °°°, and °°°° indicate endTDP‐43 monomers, dimers, trimers and tetramers. **P < 0.01, ****P < 0.0001. Violin plots show mean and quartiles.
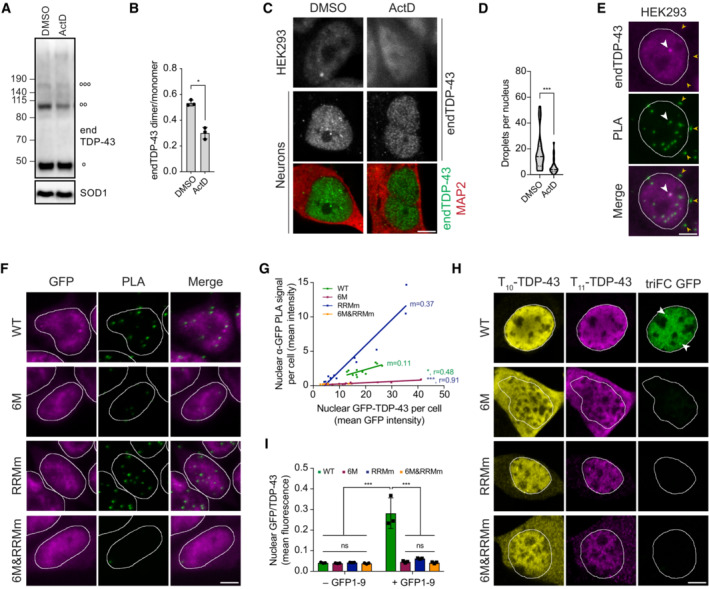
HEK293 cells were treated with actinomycin D (ActD) for 4 h to inhibit transcription before treatment with the protein–protein cross‐linker DSG and western blot analysis. °, °°, and °°°° indicate endogenous TDP‐43 (endTDP‐43) monomers, dimers and trimers, respectively.
Quantification of the endTDP‐43 signal from (A). N = 3 independent experiments. Paired two‐tailed t‐test.
Representative image of confocal fluorescence microscopy of HEK293 cells and neurons treated with 5 μg/ml ActD for 4 h. Scale bar: 5 μm.
Single‐plane quantification of the number of nuclear condensates per neuron in the conditions described in (C). N = 25–26 cells. Mann–Whitney U‐test.
Proximity ligation assay (PLA) using a monoclonal anti‐TDP‐43 antibody reveals nuclear and cytoplasmic localization of endTDP‐43 dimers in physiological conditions. Big white arrowheads indicate overlapping GFP‐TDP‐43 condensates and PLA signal. Small yellow arrowheads indicate cytoplasmic PLA signal. Scale bar: 5 μm.
PLA using a monoclonal anti‐GFP antibody reveals the localization of GFP‐TDP‐43 dimers in the isogenic cell lines upon protein expression with doxycycline (DOX) for 48 h. Note the absence of dimers in the oligomerization‐deficient variants (6M and 6M&RRMm). Scale bar: 5 μm.
Quantification of the nuclear PLA signal shown in (F) correlated to the protein expression levels of the different TDP‐43 variants, measured as the mean GFP fluorescence. N = 11–13 cells.
Tripartite GFP complementation assay using a pair of N‐terminally T10‐ and T11‐tagged TDP‐43 constructs co‐transfected with GFP1–9 in motoneuron‐like NSC‐34 cells. Note the cytoplasmic abundance of the monomeric (6M and 6M&RRMm) variants. triFC: trimolecular fluorescence complementation. Scale bar: 5 μm.
Quantification of the GFP fluorescence levels relative to the T10/T11‐TDP‐43 expression levels as shown in (H). N = 3 biological replicates, with N = 6–35 cells per replicate. Two‐way ANOVA with Tukey's multiple comparisons post hoc test. *P < 0.05, ***P < 0.001. Graph bars represent mean ± SD. Violin plots show mean and quartiles.
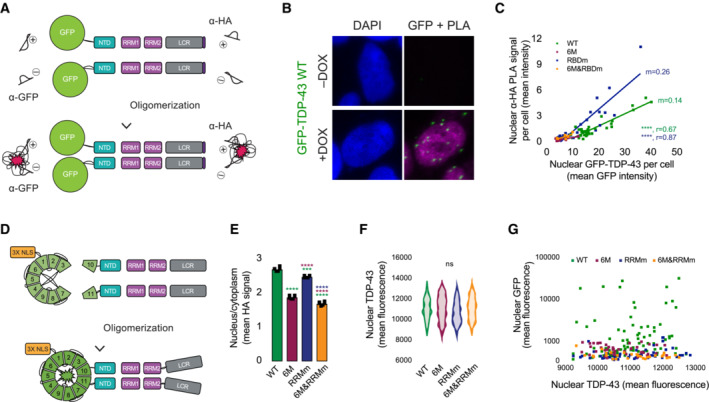
Schematic representation of the proximity ligation assay (PLA) to detect homodimers using a single monoclonal antibody conjugated to two different nucleic acid probes, for both tags at the N‐terminus (GFP) or C‐terminus (HA) of the GFP‐TDP‐43 construct.
PLA using a monoclonal anti‐GFP antibody specifically identifies the presence of GFP‐TDP‐43 WT dimers in the isogenic cell lines upon protein expression with doxycycline (DOX) for 48 h. Note the absence of dimer signal in the absence of GFP‐TDP‐43 expression (–DOX). Nuclei are stained with DAPI. Scale bar: 5 μm.
Quantification of the nuclear PLA signal obtained using an anti‐HA monoclonal antibody in relation to the protein expression levels of the different TDP‐43 variants, measured as the mean HA signal. N = 9–16 cells.
Schematic representation of the GFP trimolecular fluorescence complementation (triFC) assay designed to identify TDP‐43 dimers. NLS: nuclear localization signal.
Quantification of nucleocytoplasmic levels of TDP‐43 in immunocytochemistry images as shown in Fig 4H. N = 6 independent experiments. One‐way ANOVA with Tukey's multiple comparisons post hoc test.
Quantification of the average nuclear mean T10‐ and T11‐TDP‐43 signals from Fig 4H shows that cells analyzed for reconstituted GFP present comparable protein expression levels of the TDP‐43 variants. N = 30–83. Kruskal–Wallis test with Dunn's multiple comparisons post hoc test.
Quantification of the nuclear mean GFP fluorescence in relation to the average nuclear mean T10‐ and T11‐TDP‐43 signals from Fig 4H indicated that reconstitution of GFP fluorescence is not due to different protein expression levels of the TDP‐43 variants. N = 30–83. ns: not significant, ***P < 0.001, ****P < 0.0001. Graph bars represent mean ± SD.
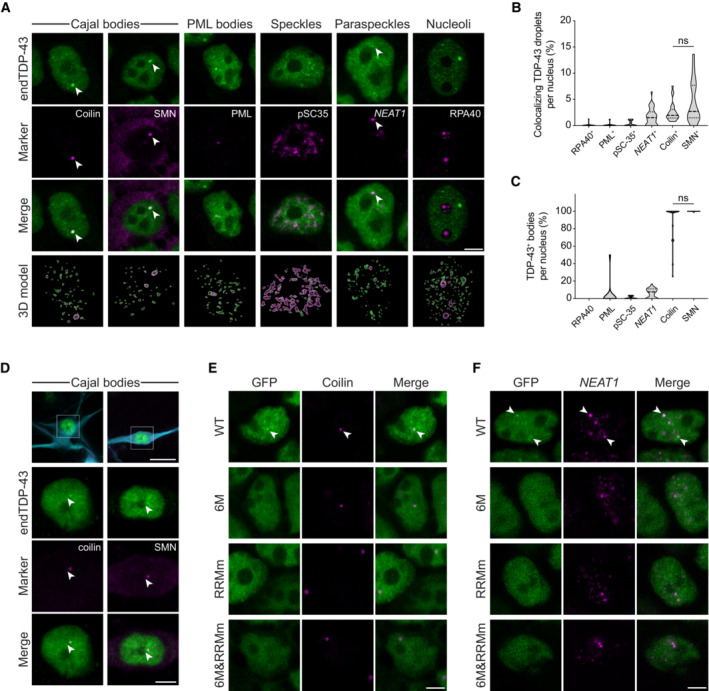
Representative confocal microscopy images of HEK293 cells probed for endogenous TDP‐43 (endTDP‐43) and different subnuclear compartment markers. Lower panel shows the three‐dimensional (3D) reconstruction of the endTDP‐43 condensates and the indicated nuclear body obtained from confocal Z‐stacks. Scale bar: 5 μm.
Quantification of the 3D reconstructions shown in (A) depicting the percentage of nuclear TDP‐43 condensates colocalizing with markers of subnuclear compartments. N = 14–38 cells.
Quantification of the 3D reconstructions shown in (A) depicting the percentage of each of the analyzed subnuclear compartments that colocalize with endTDP‐43. N = 14–38 cells.
Representative confocal microscopy images of human neurons showing the presence of endTDP‐43 in Cajal bodies. The neuron‐specific marker MAP2 is shown in cyan. Scale bar: 20 μm (inset: 5 μm).
Representative confocal microscopy images of the isogenic HEK293 lines expressing the different GFP‐TDP‐43 variants for 24 h and stained for the Cajal body marker coilin. Scale bar: 5 μm.
Representative confocal microscopy images of the isogenic HEK293 lines expressing the different GFP‐TDP‐43 variants for 24 h and hybridized with a fluorescent NEAT1 probe to mark the paraspeckles. Scale bar: 5 μm. ns: not significant. Violin plots show mean and quartiles.
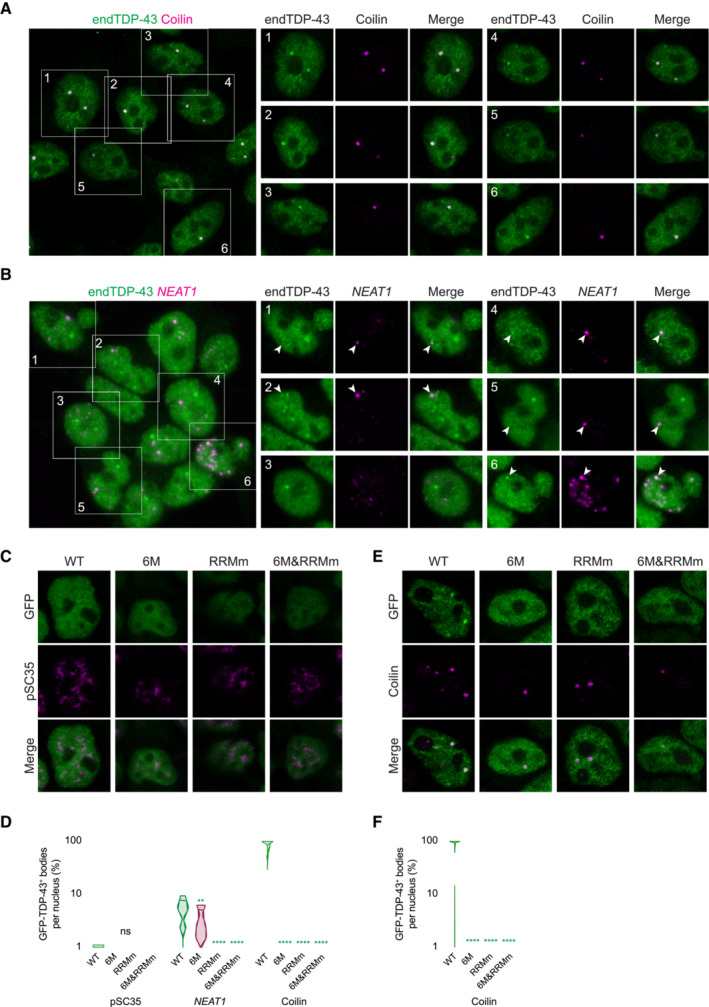
Representative confocal microscopy images of HEK293 cells stained for the Cajal body marker coilin. Scale bar: 10 μm (5 μm for insets).
Representative confocal microscopy images of HEK293 cells hybridized with a fluorescent NEAT1 probe to mark the paraspeckles. The field overview is shown as a maximum intensity Z‐projection (thickness of ~10 μm, in steps of 0.21 μm). Scale bar: 10 μm (5 μm for insets).
Representative confocal microscopy images of the isogenic HEK293 lines expressing the different GFP‐TDP‐43 variants for 24 h and stained for the nuclear speckle marker pSC35.
3D analysis quantification showing the percentage of each of the analyzed subnuclear compartments that colocalize with each of the GFP‐TDP‐43 variants as shown in Fig 5E and F; Appendix Fig S5C. N = 8–21 cells. Kruskal–Wallis test with Dunn's multiple comparisons post hoc test.
Representative confocal microscopy images of the isogenic HEK293 lines expressing the different GFP‐TDP‐43 variants for only 4 h to achieve similar expression levels and stained for the Cajal body marker coilin.
3D analysis quantification showing the percentage of Cajal bodies that colocalize with each of the GFP‐TDP‐43 variants as shown in (E). N = 39–54 cells. Kruskal‐Wallis test with Dunn's multiple comparisons post hoc test. ns: not significant, **P < 0.01, ****P < 0.0001. Violin plots show mean and quartiles.
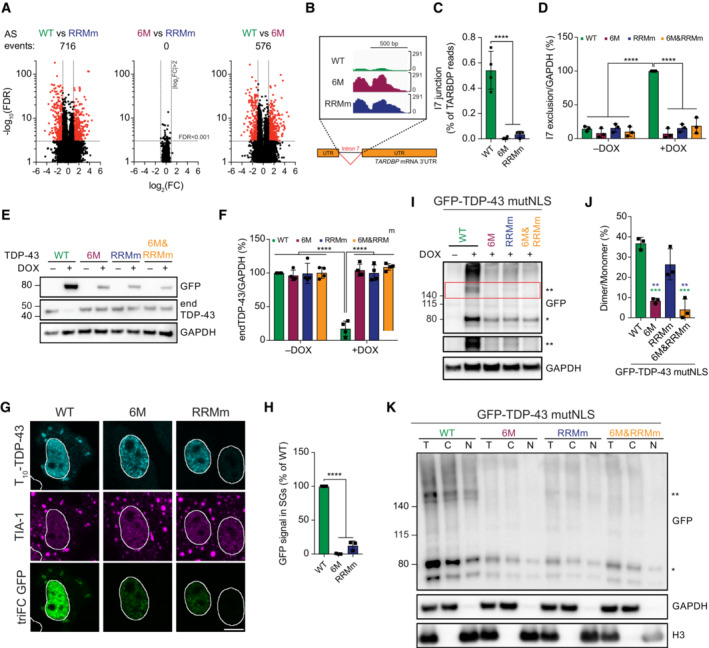
Volcano plots showing alternative splicing (AS) events upon expression of GFP‐TDP‐43 variants for 48 h.
RNA sequencing (RNA‐seq) coverage across the intron 7 of the TARDBP gene, showing a strong decrease in the WT, but not the mutant, GFP‐TDP‐43‐expressing cells.
Quantification of RNA‐seq reads spanning the intron 7 junction. One‐way ANOVA with Tukey's multiple comparisons post hoc test.
Endogenous TDP‐43 (endTDP‐43) intron 7 exclusion levels after expression of the GFP‐TDP‐43 variants for 48 h in the isogenic cell lines measured by qPCR with primers specifically targeted to the transcripts excluding this region. N = 3 independent experiments. Two‐way ANOVA with Tukey's multiple comparisons post hoc test.
Western blot analysis of the isogenic HEK293 after GFP‐TDP‐43 expression for 48 h showing that only the WT variant regulates endTDP‐43 levels.
Quantification of the endTDP‐43 signal from (E). N = 4 independent experiments. Two‐way ANOVA with Tukey's multiple comparisons post hoc test.
Tripartite GFP complementation assay involving the co‐transfection of a pair of N‐terminally T10‐ and T11‐tagged TDP‐43 constructs in HeLa cells subjected to arsenite stress for 30 min and incubated with recombinant GFP1–9 after fixation to label T10‐ and T11‐TDP‐43 dimers. TriFC: trimolecular fluorescence complementation. Scale bar: 10 μm.
Quantification of the trimolecular fluorescence complementation (triFC) signal of GFP in the TIA‐1‐marked SGs from the images shown in (G). N = 3 independent experiments. Repeated measures one‐way ANOVA with Greenhouse–Geisser correction and Tukey's multiple comparisons post hoc test.
Expression of GFP‐TDP‐43 mutNLS variants was induced with doxycycline (DOX) for 4 h before crosslinking protein–protein interactions with DSG and subsequent analysis by western blot. * and ** indicate GFP‐TDP‐43 monomers and dimers, respectively.
Quantification of the GFP signal from (I). N = 3 independent experiments. Repeated measures one‐way ANOVA with Greenhouse–Geisser correction and Tukey's multiple comparisons post hoc test.
After expression of GFP‐TDP‐43 mutNLS variants for 48 h, the isogenic lines were treated with DSG to cross‐link protein–protein interactions before performing nucleocytoplasmic fractionation and western blot analysis. * and ** indicate GFP‐TDP‐43 monomers and dimers, respectively. **P < 0.01, ***P < 0.001, ****P < 0.001. Graph bars represent mean ± SD.
- A
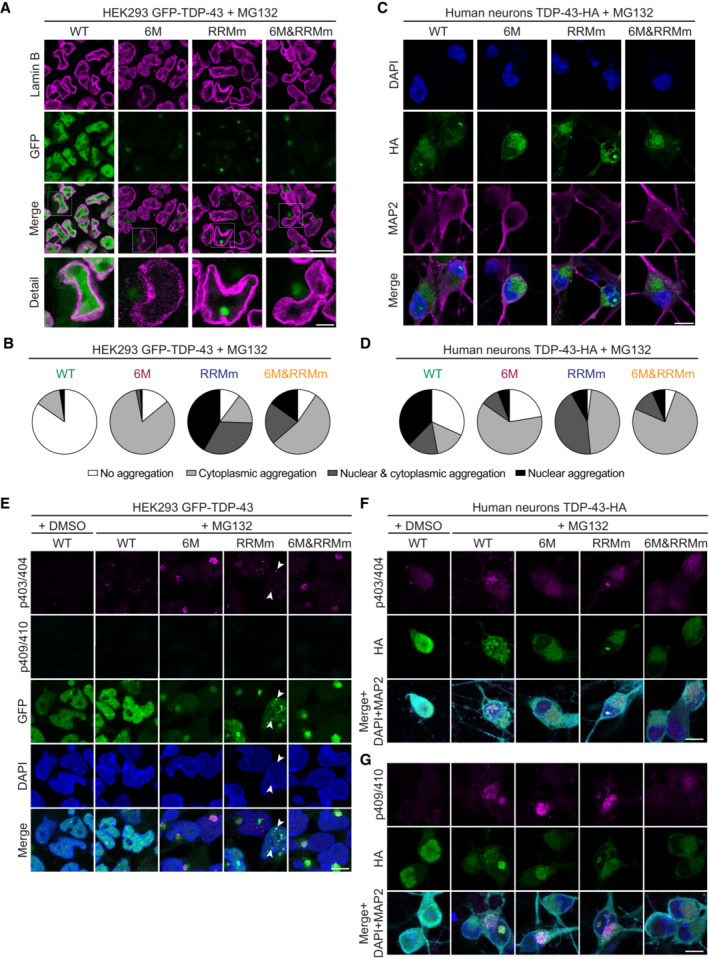
Representative confocal microscopy images of the isogenic GFP‐TDP‐43 lines after 48 h of expression, treated with the proteasome inhibitor MG132 for the last 24 h and stained for lamin B to mark the nuclear envelope. Note the different localization of TDP‐43 inclusions in the oligomerization‐ (6M and 6M&RRMm) versus RNA binding‐deficient (RRMm) variants. Scale bar: 20 μm (5 μm for inset).
- B
Quantification of the localization of GFP‐TDP‐43 inclusions after MG132 treatment for the different variants in the isogenic HEK293 lines as shown in (A). Represented values are averages from N = 3 independent experiments, with N = 189–497 cells quantified per condition and replicate.
- C
Representative maximum intensity Z‐projections from confocal fluorescence imaging (thickness of 4 μm, in steps of 1 μm) of human neurons transduced with TDP‐43‐HA variants and treated overnight with the proteasome inhibitor MG132. Scale bar: 10 μm.
- D
Quantification of the differentially localized TDP‐43‐HA inclusions in human neurons as described in (C). Represented values correspond to the quantification of N = 85–97 neurons from two independent experiments.
- E
Representative maximum intensity Z‐projections from confocal fluorescence imaging (thickness of 4 μm, in steps of 1 μm) of the same experimental conditions as shown in (A), with the addition of a DMSO control for MG132 treatment. GFP‐TDP‐43‐expressing cells were double immunolabeled for TDP‐43 phosphorylated at the S403/404 and S409/410 epitope. Note the absence of phospho‐S409/410 immunopositivity in all conditions and positivity for phospho‐S403/404 in cytoplasmic inclusions and a subset of nuclear GFP‐TDP‐43 RRMm inclusions (appointed by arrowheads). Scale bar: 10 μm.
- F, G
Representative maximum intensity Z‐projections from confocal fluorescence imaging (thickness of 4 μm, in steps of 1 μm) of the same experimental conditions as shown in (C), with the addition of a DMSO control. TDP‐43‐HA expressing human neurons were stained for either phospho‐S403/404 (F) or phospho‐S409/410 (G). Scale bar: 10 μm. Note the re‐localization of the phospho‐S403/404 signal from neuronal nuclei to inclusions (F) and the presence of phospho‐S409/410 signal in only a subset of aggregate‐bearing neurons (G). Nuclei are stained with DAPI in (C, E–G). The neuron‐specific marker MAP2 is shown in magenta or cyan in (C, F, G).
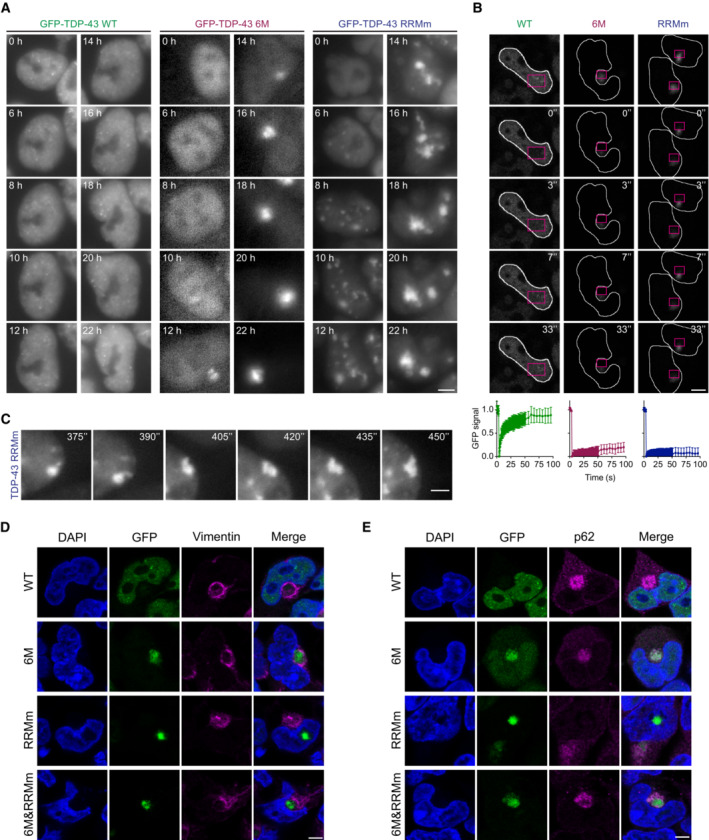
Representative images of live widefield fluorescence microscopy over the course of the MG132 treatment of the isogenic GFP‐TDP‐43 lines in the conditions described in Fig 7A (24 h of MG132 treatment). Numbers in images indicate the experimental time point in hours (h) of MG132 treatment. Scale bar: 5 μm.
Representative fluorescent confocal microscopy images of FRAP experiments of the GFP‐TDP‐43 aggregates formed upon MG132 treatment as described in Fig 7A. FRAP was performed in the areas highlighted in magenta. Numbers in images indicate the experimental time point in seconds (") of MG132 treatment. Scale bar: 5 μm. Bottom panel: Measured GFP intensity values are expressed as a fraction of the average pre‐bleach fluorescence levels.
Live widefield fluorescence microscopy depicting a fusion event and aberrant phase transition of RRMm GFP‐TDP‐43 condensates upon MG132 treatment in the conditions described in Fig 7A. Numbers in images indicate the experimental time point in seconds (") of MG132 treatment. Scale bar: 3 μm.
Representative confocal microscopy images of the isogenic GFP‐TDP‐43 lines at the endpoint (24 h) of MG132 treatment of the experimental conditions described in Fig 7A and stained for vimentin. Scale bar: 5 μm.
Representative confocal microscopy images of the isogenic GFP‐TDP‐43 lines at the endpoint (24 h) of MG132 treatment of the experimental conditions described in Fig 7A and stained for p62. Cell nuclei are visualized with DAPI in (D and E). Scale bar: 5 μm.
References
-
- Afroz T, Pérez‐Berlanga M, Polymenidou M (2019) Structural transition, function and dysfunction of TDP‐43 in neurodegenerative diseases. Chimia (Aarau) 73: 380–390 - PubMed
-
- Arai T, Hasegawa M, Akiyama H, Ikeda K, Nonaka T, Mori H, Mann D, Tsuchiya K, Yoshida M, Hashizume Y et al (2006) TDP‐43 is a component of ubiquitin‐positive tau‐negative inclusions in frontotemporal lobar degeneration and amyotrophic lateral sclerosis. Biochem Biophys Res Commun 351: 602–611 - PubMed
-
- Arganda‐Carreras I, Kaynig V, Rueden C, Eliceiri KW, Schindelin J, Cardona A, Sebastian Seung H (2017) Trainable Weka segmentation: a machine learning tool for microscopy pixel classification. Bioinformatics 33: 2424–2426 - PubMed
Publication types
MeSH terms
Substances
LinkOut - more resources
Full Text Sources
Medical
Research Materials
Miscellaneous
