. 2023 Oct 2;220(10):e20221920.
doi: 10.1084/jem.20221920. Epub 2023 Jul 11.

Single-cell profiling reveals unique features of diabetogenic T cells in anti-PD-1-induced type 1 diabetes mice

Affiliations

Single-cell profiling reveals unique features of diabetogenic T cells in anti-PD-1-induced type 1 diabetes mice

Jenna L Collier et al. J Exp Med. .

Abstract

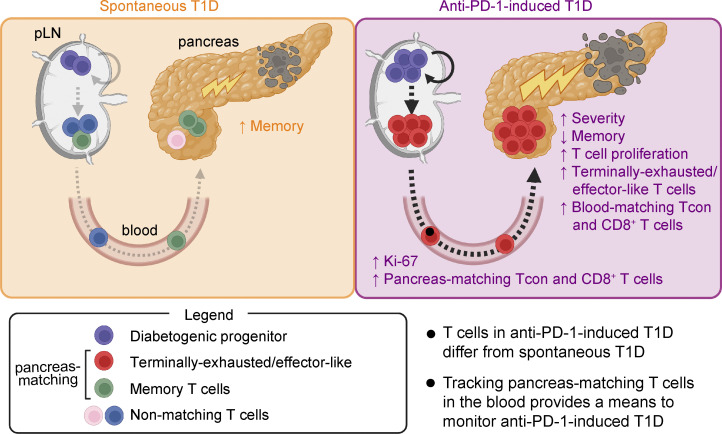
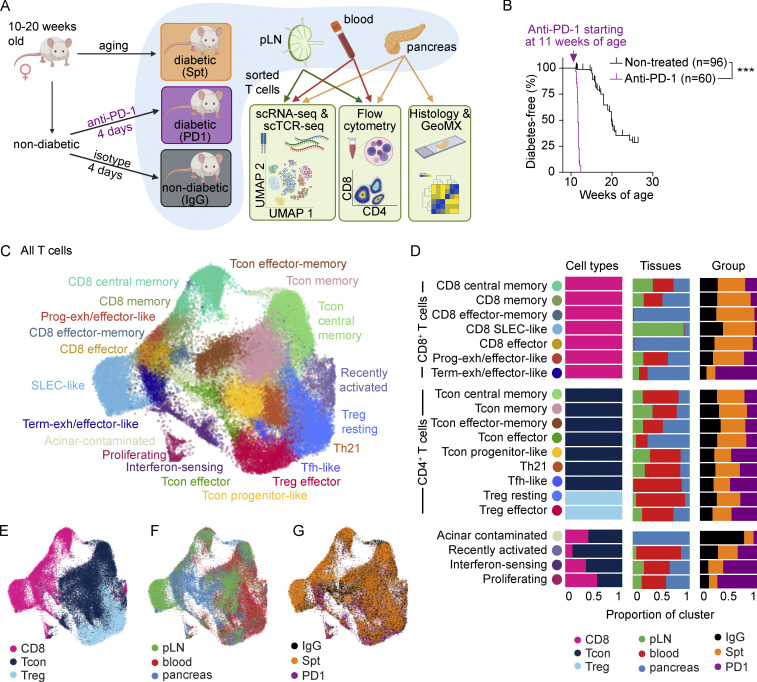
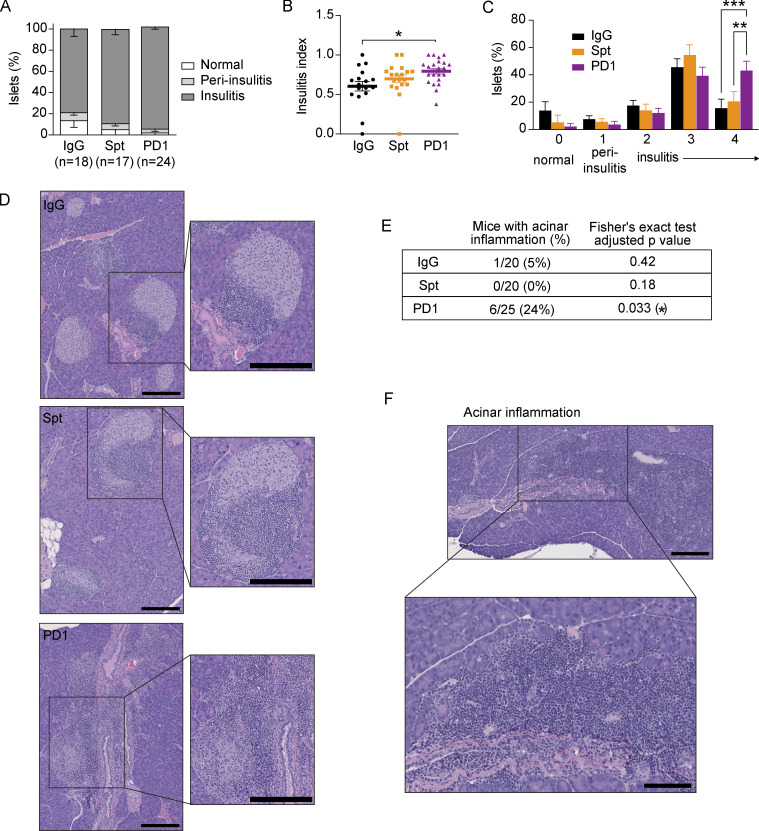
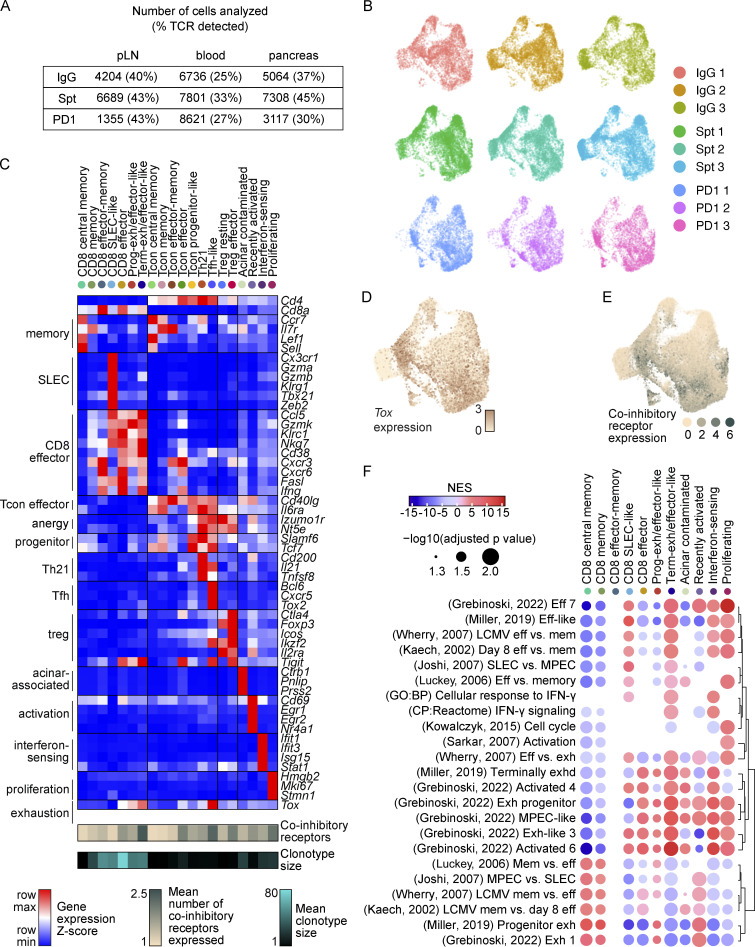
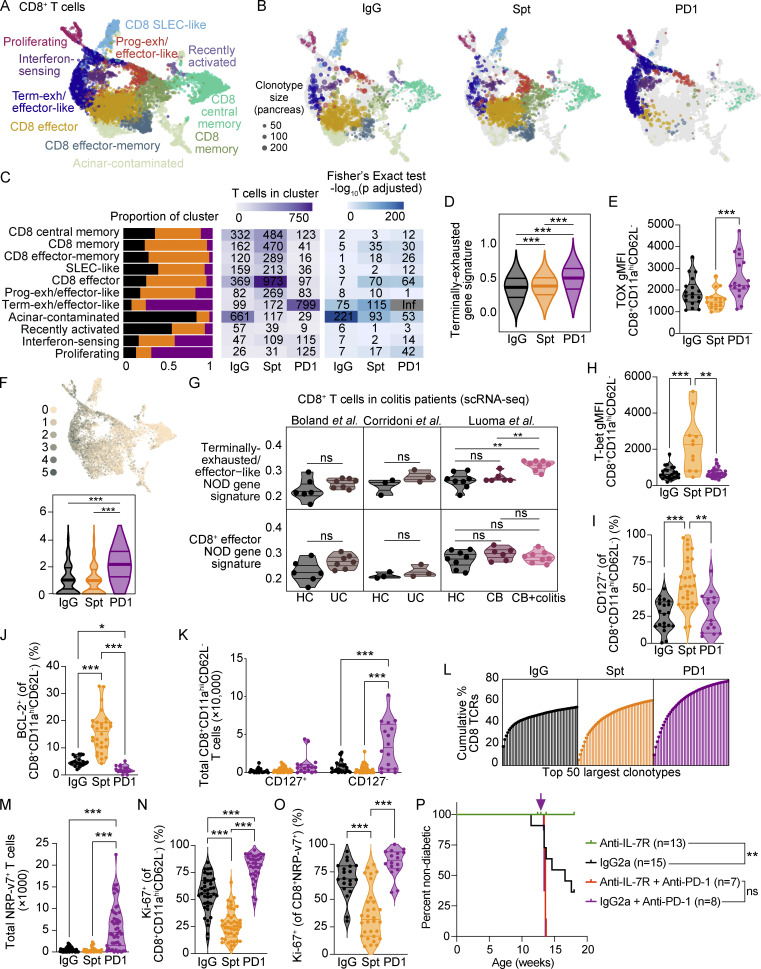
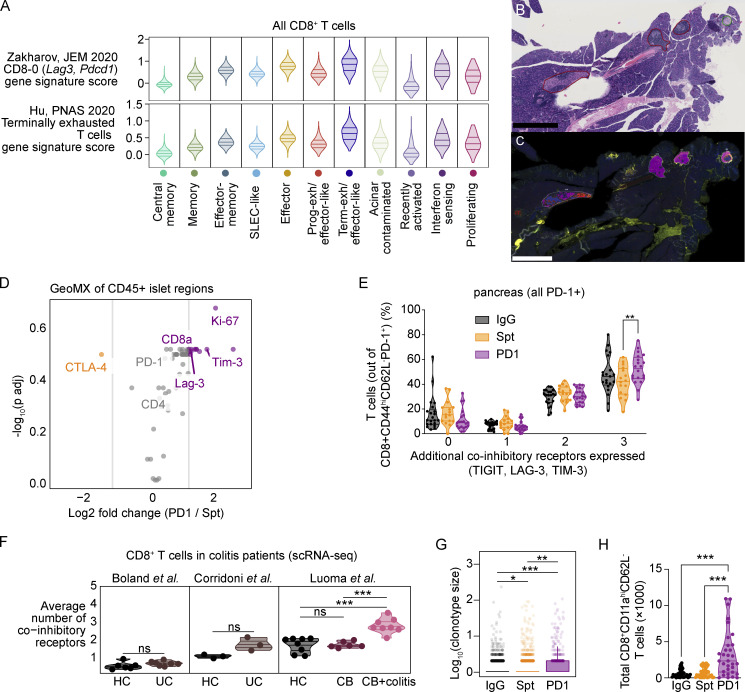
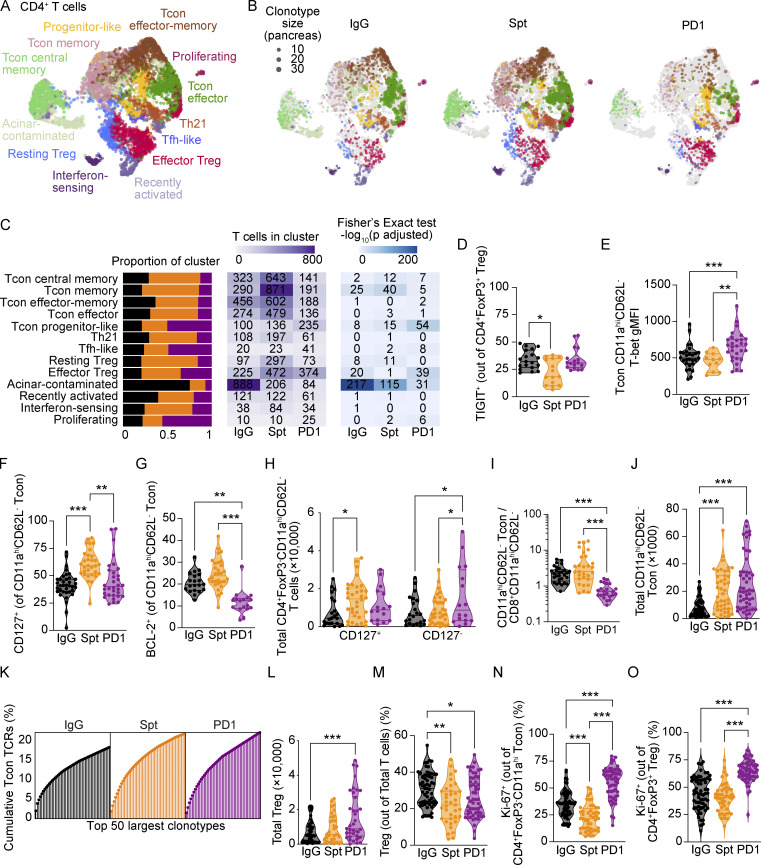
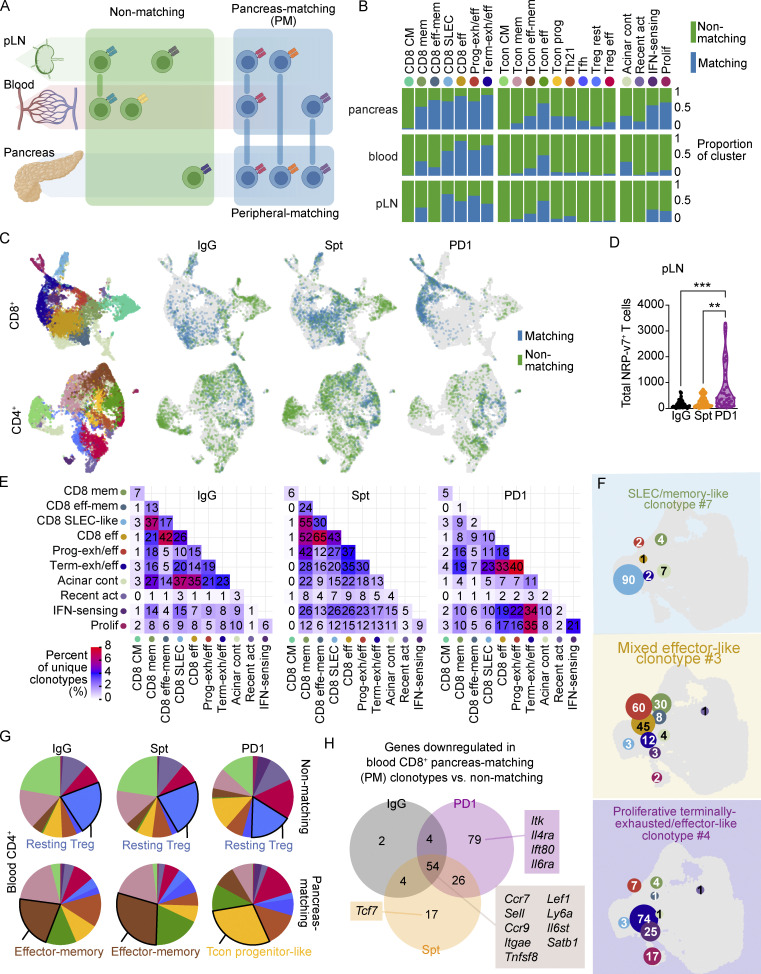
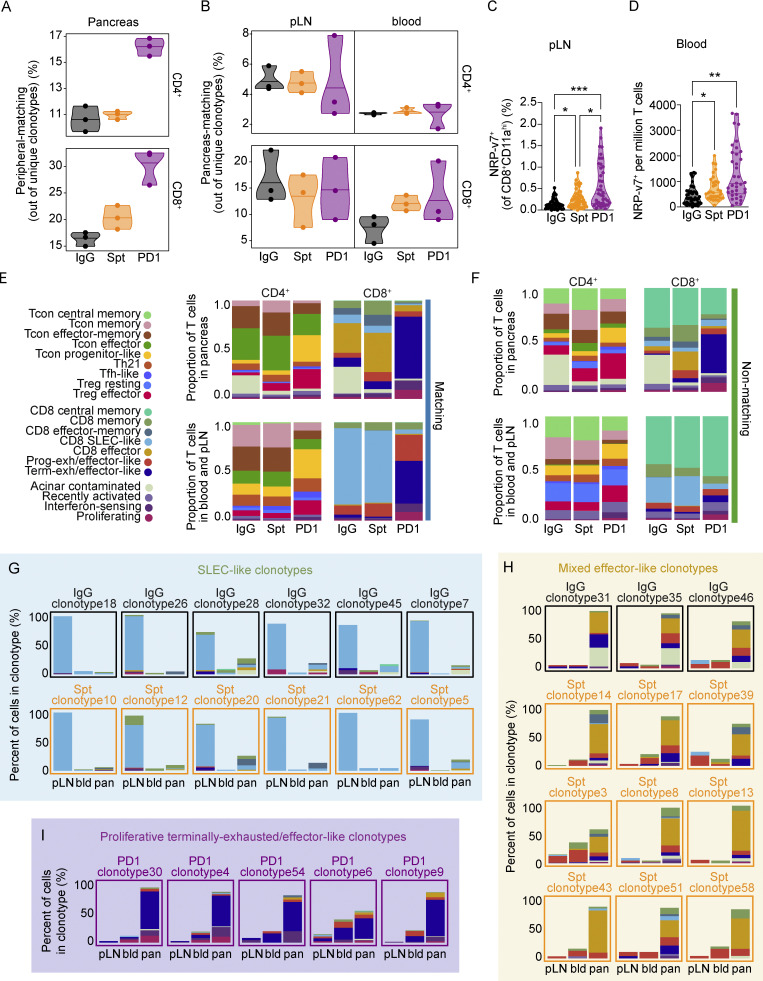
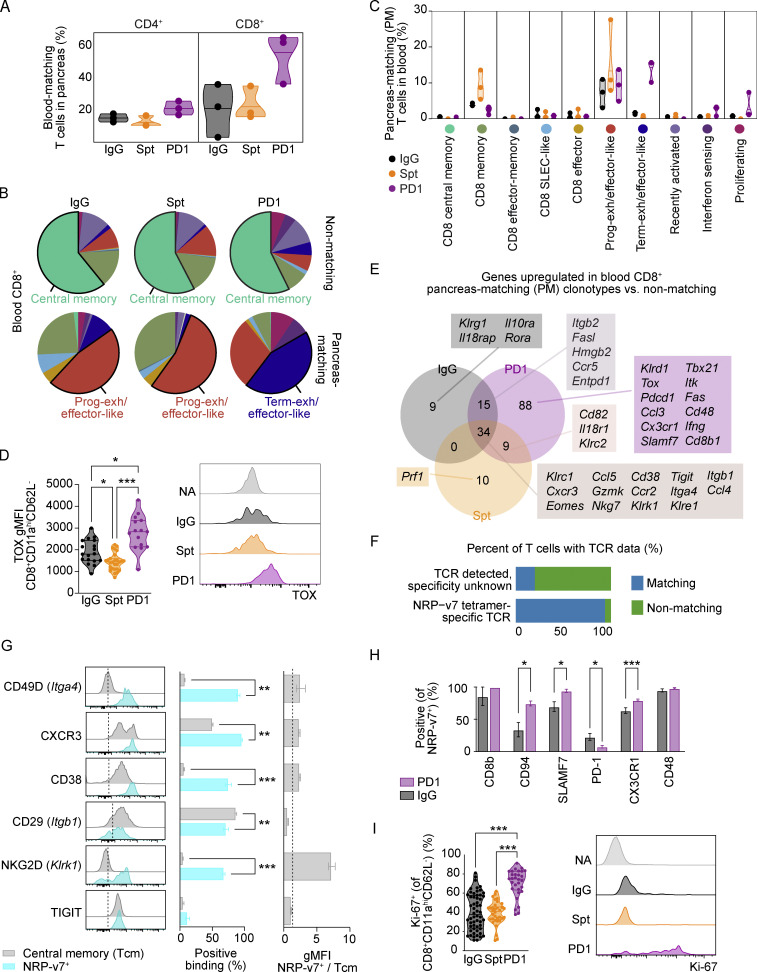
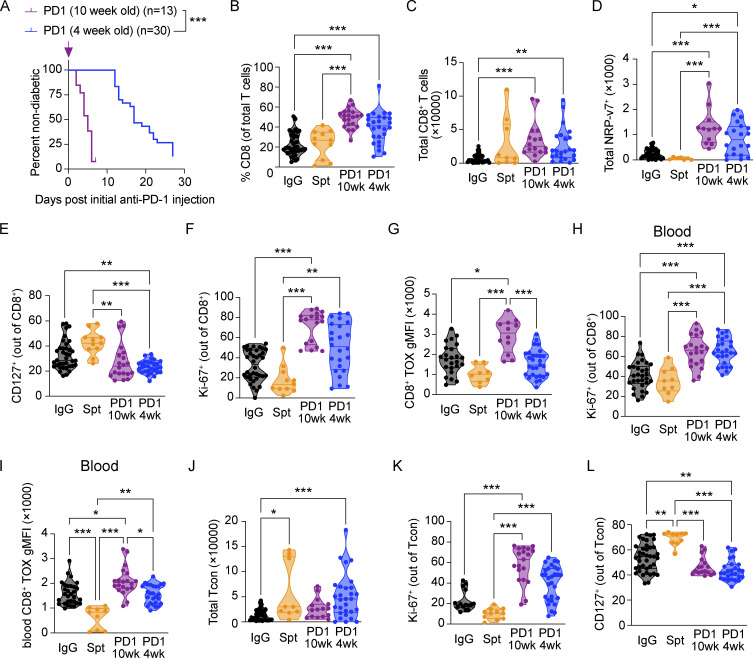
Immune-related adverse events (irAEs) are a notable complication of PD-1 cancer immunotherapy. A better understanding of how these iatrogenic diseases compare with naturally arising autoimmune diseases is needed for treatment and monitoring of irAEs. We identified differences in anti-PD-1-induced type 1 diabetes (T1D) and spontaneous T1D in non-obese diabetic (NOD) mice by performing single-cell RNA-seq and TCR-seq on T cells from the pancreas, pancreas-draining lymph node (pLN), and blood of mice with PD-1-induced T1D or spontaneous T1D. In the pancreas, anti-PD-1 resulted in expansion of terminally exhausted/effector-like CD8+ T cells, an increase in T-bethi CD4+FoxP3- T cells, and a decrease in memory CD4+FoxP3- and CD8+ T cells in contrast to spontaneous T1D. Notably, anti-PD-1 caused increased TCR sharing between the pancreas and the periphery. Moreover, T cells in the blood of anti-PD-1-treated mice expressed markers that differed from spontaneous T1D, suggesting that the blood may provide a window to monitor irAEs rather than relying exclusively on the autoimmune target organ.


Conflict of interest statement

Disclosures: A.H. Sharpe reported grants from National Institutes of Health P01 AI56299, P01 AI39671, and P01 108545, and grants from Vertex during the conduct of the study. A.H. Sharpe reported personal fees from Surface Oncology, Sqz Biotech, Selecta, Elpiscience, Bicara, Fibrogen, Alixia, GlaxoSmith Kline, Janssen, and Amgen; “other” from Monopteros, IOME, and Corner Therapeutics; and grants from Merck, Roche, Ipsen, Novartis, Quark Ventures, AbbVie, Moderna, and Erasca outside the submitted work; in addition, A.H. Sharpe had a patent number 7,432,059 with royalties paid Roche, Merck, Bristol-Myers-Squibb, EMD-Serono, Boehringer-Ingelheim, AstraZeneca, Leica, Mayo Clinic, Dako, and Novartis; a patent number 7,722,868 with royalties paid Roche, Merck, Bristol-Myers-Squibb, EMD-Serono, Boehringer-Ingelheim, AstraZeneca, Leica, Mayo Clinic, Dako, and Novartis; a patent number 8,652,465 licensed “Roche”; a patent number 9,457,080 licensed “Roche”; a patent number 9,683,048 licensed “Novartis”; a patent number 9,815,898 licensed “Novartis”; a patent number 9,845,356 licensed “Novartis”; a patent number 10,202,454 licensed “Novartis”; a patent number 10,457,733 licensed “Novartis”; a patent number 9,580,684 issued “none”; a patent number 9,988,452 issued “none”; a patent number 10,370,446 issued “none”; a patent to 10,457,733 issued; a patent number 10,752,687 issued; a patent number 10,851,165 issued; and a patent number 10,934,353 issued. A.H. Sharpe is on the scientific advisory boards for the Massachusetts General Cancer Center, Program in Cellular and Molecular Medicine at Boston Children’s Hospital, the Human Oncology and Pathogenesis Program at Memorial Sloan Kettering Cancer Center, the Bloomberg-Kimmel Institute for Cancer Immunotherapy, the Gladstone Institute, and Bioentre. She is an academic editor for the Journal of Experimental Medicine. No other disclosures were reported.

Figures

None
Graphical abstract
Figure 1.
Figure 1.
Comparison of single-cell transcriptional landscape of CD4+ and CD8+ T cells during spontaneous and anti-PD-1-induced T1D in NOD mice. (A) Study design for multisite analysis of IgG, Spt, or PD1 mice. (B) Percent diabetes-free NOD mice following administration of two doses of anti-PD-1 antibody (purple) or isotype control antibody (black) every other day beginning at 11 wk of age. Kaplan–Meier survival curves and results from a Mantel-Cox log-rank test (P < 1 × 10⁻¹⁵) are shown. (C) Clustering and UMAP visualization of integrated CD4+ and CD8+ T cell data from paired blood, pLN, and pancreas from three mice per treatment group (IgG, PD1, and Spt). Colors denote transcriptional clusters, labeled with functional annotations. See Materials and methods for more details on functional annotations, and Table S1 for full list of upregulated genes per cluster. (D) Stacked bar plots showing the proportion of cell types (Tcon, Treg, and CD8+ T cells), tissues, and treatment groups within each cluster. Definitions used to classify cells as CD8+, Tcon, or Treg are indicated in the Materials and methods. The term “Tcon” specifically refers to CD4+ Foxp3 T cells. Most clusters were exclusively one cell type (e.g., CD8+ T cells, Tcons, or Tregs). However, some clusters (e.g., bottom four rows) contained a mix of CD8+ T cells and Tcons. (E–G) UMAP visualization of the distribution of all T cells based on (E) cell type classification, (F) tissues, and (G) treatment groups. Asterisks indicating significance: ***, P < 0.001.
Figure S1.
Figure S1.
Histological differences in the pancreas of spontaneous and anti-PD-1-induced T1D in NOD mice. (A) The percentage of β-islets that were classified as normal (score 0) or exhibited either peri-insulitis (score 1) or insulitis (score 2–4). (B) The insulitis index for individual mice calculated according to the equation described in the Materials and methods. Bars show the mean and error bars represent ± SEM. Significance determined using a non-parametric Kruskall–Wallis test with Dunn’s posthoc test for multiple comparisons, P = 0.0103. (C) Percentage of islets within individual mice from A with peri-insulitis or insulitis or that appear normal. Significance determined using a two-way ANOVA with Holm-Sidak’s test for multiple comparisons, Insulitis score 4, IgG-PD1: P = 0.0008; Spt-PD1: 0.0057. Data are shown as means ± SEM. (D) Example H&E images with insets of β-islets with insulitis from the pancreata of IgG, Spt, or PD1 mice. The length of black bars in the lower right of images represents 200 µm. (E) Table showing the number of mice with acinar inflammation out of the total number of samples examined, with percentage in brackets. Statistical significance was determined using a Fisher’s exact test and P values adjusted using the Benjamini and Hochberg method are shown. (F) Example H&E image with inset showing acinar inflammation in pancreas of a mouse with anti-PD-1-induced T1D (PD1). The length of black bars in the lower right of the images represents 100 and 200 µm in the inset. Asterisks indicating significance: *, P < 0.05; **, P < 0.01; ***, P < 0.001.
Figure S2.
Figure S2.
Classification of CD4+ and CD8+ T cells based on transcriptional and TCR features. (A) Table indicating the number of T cells recovered in each tissue and treatment group with percentage of cells in which the TCR was detected in parentheses. (B) UMAP visualization of all T cells from individual mice. (C) Heatmap showing gene expression of selected markers used for cluster annotation. Included are the mean clonotype size for each cluster and the mean number of co-inhibitory receptors co-expressed by cells in each cluster (Tigit, Ctla4, Cd160, Cd244a, Pdcd1, and Havcr2). (D) UMAP visualization of expression of Tox transcript expression across all T cells. (E) UMAP visualization of the distribution of expression of multiple co-inhibitory receptors (Tigit, Ctla4, Cd160, Cd244a, Pdcd1, Havcr2). (F) Dot plot visualization of the Normalized Enrichment Score (NES) calculated by gene set enrichment analysis using pre-ranked genes from CD8+ T cell clusters for selected gene signatures from Joshi et al. (2007); Miller et al. (2019); Grebinoski et al. (2022); Kaech et al. (2002); Luckey et al. (2006); Wherry et al. (2007); Sarkar et al. (2008); Kowalczyk et al. (2015). The size of the dot corresponds to the log10 transformed value of the adjusted P value and the color corresponds to the NES. Dots are only shown for P values <0.05.
Figure 2.
Figure 2.
CD8+ T cells in the pancreas show a gain in proliferation, gain in exhaustion-like features, and decrease in memory-like features in anti-PD-1-induced T1D compared with spontaneous T1D. (A) UMAP visualization of integrated CD8+ T cells detected in the pancreas. Points represent individual cells and colors denote cluster classification as labeled. (B) UMAP visualization of integrated CD8+ T cells detected in the pancreas of each treatment group. Dots represent individual cells with the color representing the cluster classification and size corresponding to the size of the clonotype. Functional annotations for each cluster shared with labels in A. (C) Stacked bar plots denoting the percentage of cells from each treatment group within individual clusters (left panel). Heatmap showing the number of cells detected in each cluster and treatment group (middle panel) and −log10 adjusted P values from a Fisher’s exact test (right panel). (D) Violin plots quantifying the expression of a gene signature score of terminally exhausted T cells (Miller et al., 2019) in all CD8+ T cells in the pancreas. IgG-Spt, P = 1.21 × 10⁻⁴; IgG-PD1, P = 4.74 × 10−77; Spt; PD1, P = 1.74 × 10−71. (E) Violin plots showing gMFI of TOX in CD8+CD11ahiCD62L T cells in the pancreas by flow cytometry analysis. Spt-PD1, P = 0.0008. (F) UMAP visualization of expression of multiple co-inhibitory receptor transcripts (Tigit, Ctla4, Cd160, Cd244a, Pdcd1, and Havcr2; top) and violin plots of the number of co-inhibitory receptors expressed by individual cells in each treatment group (bottom). IgG-PD1, P = 6.46 × 10−158; Spt-PD1, P = 2.12 × 10−203. (G) Violin plots showing the mean gene signature scores from NOD in CD8+ T cells from the colons of HC, UC (Boland et al., 2020; Corridoni et al., 2020), CB, and CB+colitis patients (Luoma et al., 2020). HC-CB+colitis, P = 0.002; CB-CB+colitis, P = 0.002. Gene signatures derived from terminally exhausted/effector-like T cells (top) or effector CD8+ T cells from NOD pancreas (bottom). Each dot shows the average gene signature score of the cells in an individual person. Gene signature from terminally exhausted/effector-like T cells from NOD can be found in Table S3, and effector CD8+ T cells from NOD can be found in Table S4. (H)Violin plots showing gMFI of T-bet in CD8+CD11ahiCD62L T cells in the pancreas by flow cytometry analysis. IgG-Spt, P = 0.0008; Spt-PD1, P = 0.0020. (I) Violin plots quantifying percent CD127+ staining within CD8+CD11ahiCD62L T cells in the pancreas measured by flow cytometry. IgG-Spt, P <0.0001; Spt-PD1, P = 0.0012. (J) Violin plots showing percent BCL-2+ in CD8+CD11ahiCD62L T cells in the pancreas by flow cytometry analysis. IgG-Spt, P < 0.0001; IgG-PD1, P = 0.0298; Spt-PD1, P < 0.0001. (K) Violin plots quantifying the total number of CD127+ and CD127 CD8+CD11ahi CD62L T cells detected in the pancreas measured by flow cytometry. For CD127 T cells: IgG-PD1 P < 0.001; Spt-PD1 P < 0.0001. (L) Plot of the top 50 most expanded clonotypes, each represented as a vertical line and terminal point, within each treatment group shown as the cumulative total percentage of TCRs detected in CD8+ T cells within that treatment group. (M) Violin plots quantifying the total number of NRP-v7+ T cells detected in the pancreas measured by flow cytometry. IgG-PD1, P < 0.0001; Spt-PD1, P < 0.0001. (N) Violin plot quantifying the percent Ki-67+ staining within CD8+CD11ahiCD62L T cells in the pancreas measured by flow cytometry. IgG-Spt, P < 0.0001; IgG-PD1, P = 0.0002; Spt-PD1, P < 0.0001. (O) Violin plots quantifying percent Ki-67+ staining within CD8+ NRP-v7+ T cells detected in the pancreas by flow cytometry. IgG-Spt, P = 0.0008; Spt-PD1, P < 0.0001. (P) Percent diabetes-free NOD mice administered isotype control antibody (black) or anti-IL-7Rα antibody (green) twice a week beginning at 10 wk of age. Following 3 wk of treatment with isotype control antibody (purple) or anti-IL-7Rα antibody (red), mice were injected with anti-PD-1 antibody. Kaplan–Meier survival curves are shown. IgG2a vs. anti-IL-7R, P = 0.007. Flow cytometry results are pooled from 3 to 25 independent experiments and significance determined using a non-parametric Kruskall–Wallis test with Dunn’s posthoc test for multiple comparisons. Bars in violin plots represent the first quartile, median, and third quartile. Significant comparisons are indicated with asterisks: *, P < 0.05; **, P < 0.01; ***, P < 0.001; ns, not significant.
Figure S3.
Figure S3.
Co-inhibitory receptor expression on CD8+ T cells in colitis patients and NOD mice. (A) Violin plots of published gene signature module scores of CD8+ T cells from all tissues by cluster. Top: Zakharov et al., 2020; bottom: Hu et al., 2020. Horizontal lines represent the first quartile, median, and third quartile. (B) Scanned H&E showing representative annotation of pancreatic β-islets scored by a board-certified pathologist (encircled green = peri-insulitis, red = insulitis). The length of black bars in the lower left of the images represents 500 µm. (C) GeoMx DSP scan of mouse pancreas sample labeled with INS (red), CD45 (yellow), Pan-CK (green), and DNA (blue). Segmentation into INS+ (blue) and CD45+ (magenta) areas shown in encircled regions. The length of black bars in the lower left of the images represents 500 µm. (D) GeoMX DSP analysis showing fold-change of normalized protein staining values for indicated markers. Statistical significance was determined using a mixed linear model with Benjamini-Hochberg correction. (E) Violin plots showing the percentage of CD8+CD11ahiCD62LPD-1+ T cells that express additional co-inhibitory receptors (TIGIT, LAG-3, and/or TIM-3) in the pancreas measured by flow cytometry. Statistical significance determined using a two-way ANOVA with Holm-Sidak’s test for multiple comparisons. For co-expression of three IRs in addition to PD-1, Spt-PD1 P = 0.0046. (F) Violin plots showing the mean expression of multiple co-inhibitory receptor transcripts (Tigit, Ctla4, Cd160, Pdcd1, and Havcr2) expressed by CD8+ T cells from the colons of HC, UC (Boland et al., 2020; Corridoni et al., 2020), CB, and CB+C (Luoma et al., 2020). Each dot shows the average number of co-inhibitory receptors expressed by the cells in an individual patient. HC-CB+colitis, P = 0.0003; CB-CB+colitis, P = 0.000233. (G) Box plot quantifying clonal expansion of CD8+ T cells in the pancreas detected by scTCR-seq. Boxes show the first quartile, median, and third quartile, while the whiskers cover 1.5× the interquartile range. Significance determined using a Wilcoxon rank sum test and P values adjusted using the Benjamini and Hochberg method are shown. IgG-Spt, P = 1.00 × 10⁻²; IgG-PD1, P = 7.26 × 10⁻⁷; Spt-PD1, P = 3.00 × 10⁻³. (H) Violin plots quantifying the total number of CD8+CD11ahiCD62L T cells detected in the pancreas measured by flow cytometry. IgG-PD1, P < 0.0001; Spt-PD1, P = 0.0003. Significant comparisons are indicated with asterisks: *, P < 0.05; **, P < 0.01; ***, P < 0.001; ns, not significant.
Figure 3.
Figure 3.
CD4+ T cells in the pancreas show increased proliferation in anti-PD-1-induced T1D. (A) UMAP visualization of integrated CD4+ T cells detected in the pancreas. Points represent individual cells and colors denote cluster classification as labeled. (B) UMAP visualization of integrated CD4+ T cells detected in the pancreas of each treatment group. Dots represent individual cells with the color representing the cluster classification and size corresponding to the size of the clonotype. Colors denote functional annotations that correspond to the same labels shown in A. (C) Stacked bar plots denoting the percentage of cells from each treatment group within individual clusters (left panel). Heatmap showing the number of cells detected in each cluster and treatment group (middle panel) and −log10 adjusted P values from a Fisher’s exact test (right panel). (D) Violin plots quantifying percent TIGIT+ staining within CD4+FoxP3+ Treg in the pancreas measured by flow cytometry. IgG-Spt, P = 0.0235. (E) Violin plots showing gMFI of T-bet in CD4+FoxP3CD11ahiCD62L Tcon in the pancreas by flow cytometry analysis. IgG-PD1, P = 0.0008; Spt-PD1, P = 0.0020. (F) Violin plots quantifying percent CD127+ staining within CD4+FoxP3CD11ahiCD62L Tcon in the pancreas measured by flow cytometry. IgG-Spt, P < 0.0001; Spt-PD1, P = 0.0012. (G) Violin plots showing percent BCL-2+ in CD4+FoxP3CD11ahiCD62L Tcon in the pancreas by flow cytometry analysis. IgG-PD1, P = 0.0010; Spt-PD1, P < 0.0001. (H) Violin plots quantifying the total number of CD4+FoxP3CD11ahiCD127+ and CD4+FoxP3CD11ahiCD127 Tcon detected in the pancreas measured by flow cytometry. For CD127+ Tcon: IgG-Spt P = 0.04. For CD127 Tcon: IgG-PD1 P = 0.04; Spt-PD1, P = 0.04. (I) Ratio of CD4+FoxP3CD11ahiCD62L Tcon to CD8+CD11ahiCD62L T cells in the pancreas measured by flow cytometry. IgG-PD1, P < 0.0001; Spt-PD1, P < 0.0001. (J) Violin plots quantifying the total number of CD4+FoxP3CD11ahi Tcon detected in the pancreas measured by flow cytometry. IgG-Spt, P = 0.0001; IgG-PD1, P < 0.0001. (K) Plot of the top 50 largest clonotypes, each represented as a line and terminal point, within each treatment group shown as a cumulative total percentage of TCRs detected in Tcon within that treatment group. (L) Violin plots quantifying the total number of CD4+FoxP3+ Treg detected in the pancreas measured by flow cytometry. IgG-PD1, P < 0.0001. (M) Violin plots quantifying the number of CD4+FoxP3+ Treg as a percentage of total TCR-β+ T cells detected in the pancreas. IgG-Spt, P = 0.0012; IgG-PD1, P = 0.0443. (N) Violin plots quantifying percent Ki-67+ staining within CD4+FoxP3CD11ahiCD62L Tcon in the pancreas measured by flow cytometry. IgG-Spt, P = 0.0004; IgG-PD1, P < 0.0001; Spt-PD1, P < 0.0001. (O) Violin plots quantifying percent Ki-67+ staining within CD4+FoxP3+ Treg in the pancreas measured by flow cytometry. IgG-PD1, P < 0.0001; Spt-PD1, P < 0.0001. Flow cytometry results are pooled from 3 to 25 independent experiments and significance determined using a non-parametric Kruskall–Wallis test with Dunn’s posthoc test for multiple comparisons. Bars in violin plots represent the first quartile, median, and third quartile. Significant comparisons are indicated with asterisks: *, P < 0.05; **, P < 0.01; ***, P < 0.001.
Figure S4.
Figure S4.
Clonotype matching across tissues and clusters differs in anti-PD-1-induced T1D compared to spontaneous T1D. (A) Diagram depicting the distribution of PM, peripheral-matching, and non-matching across the pLN, blood, and pancreas based on clonotype. (B) Stacked bar plots showing the proportion of matching and non-matching T cells within individual clusters across the pLN, blood, and pancreas. (C) UMAP visualization of CD8+ (top) and CD4+ (bottom) peripheral-matching (blue) and non-matching (green) T cells in the pancreas of each treatment group. Legend for the leftmost UMAP is shared with B. (D) Violin plots quantifying the total number of NRP-v7+ CD8+ T cells in the pLN measured by flow cytometry. IgG-PD1, P < 0.0001; Spt-PD1, P = 0.0071. (E) Heatmaps showing the number of unique clonotypes shared across clusters in the different treatment groups. The color of tiles corresponds to the percentage of unique clonotypes shared across two clusters. (F) UMAP visualization of the number of cells in each cluster within selected individual clonotypes. The color of the circle represents the cluster (legend shared with B), the size of the circle represents the relative number of cells in that cluster, and the number represents the actual number of cells in that cluster. Circles are located at the mean centroid of the UMAP coordinates of the total cells within each cluster. (G) Pie charts displaying the cluster proportions of non-matching (top) and PM (bottom) CD4+ T cells in the blood. The cluster that constitutes the largest proportion is annotated with text. (H) Venn diagram showing the number of down-regulated genes in blood PM vs. non-matching CD8+ T cells between the three treatment groups. Selected genes within each group are listed. Full list can be found in Table S5. Significant comparisons are indicated with asterisks: **, P < 0.01; ***, P < 0.001.
Figure 4.
Figure 4.
pLN and blood CD4+ and CD8+ T cells having shared clonality with cells in the pancreas can be identified using the TCR as a barcode. (A) Violin plots showing the percentage of peripheral-matching CD4+ (top) and CD8+ (bottom) clonotypes out of the total unique clonotypes detected in the pancreas. Each dot represents the cells from one individual mouse (n = 3 mice per group). (B) Violin plots showing the percentage of PM CD4+ (top) and CD8+ (bottom) clonotypes out of total unique clonotypes detected in the pLN (left) and blood (right). Each dot represents the cells from one individual mouse (n = 3 mice per group). (C) Violin plots quantifying the percentage of NRP-v7+ CD8+ T cells out of CD8+CD11ahi T cells detected in the pLN measured by flow cytometry. IgG-PD1, P < 0.0001; Spt-PD1, P = 0.0347; IgG-Spt, P = 0.0354. (D) Violin plots quantifying the total number of NRP-v7+ CD8+ T cells per million T cells in the blood measured by flow cytometry. IgG-Spt, P = 0.0287; IgG-PD1, P < 0.0001. (E) Stacked bar plots showing the cluster composition of matching CD4+ and CD8+ T cells across the indicated treatment groups in the pancreas (top) and combined blood and pLN (bottom). (F) Stacked bar plots showing the cluster composition of non-matching CD4+ and CD8+ T cells across the indicated treatment groups in the pancreas (top) and combined blood and pLN (bottom). Legend is shared with E. (G) Stacked bar plots of the percentage of cells detected in clusters within individual SLEC-like clonotypes across pLN, blood (bld), and pancreas (pan). The color of text and border surrounding the stacked bar plot corresponds to the treatment group of the clonotype. (H) Stacked bar plots of the percentage of cells detected in clusters within individual mixed effector-like clonotypes across pLN, blood (bld), and pancreas (pan). The color of the text and border surrounding the stacked bar plot corresponds to the treatment group of the clonotype. (I) Stacked bar plots of the percentage of cells detected in clusters within individual proliferative terminally exhausted/effector-like clonotypes across pLN, blood (bld), and pancreas (pan). (G–I) Legend shared with E. Flow cytometry results are pooled from 3 to 25 independent experiments and significance determined using a non-parametric Kruskall–Wallis test with Dunn’s posthoc test for multiple comparisons. Bars in violin plots represent the first quartile, median, and third quartile. Significant comparisons are indicated with asterisks: *, P < 0.05, **, P < 0.01; ***, P < 0.001.
Figure 5.
Figure 5.
Circulating blood CD4+ and CD8+ T cells with matching TCRs to pancreatic CD4+ and CD8+ T cells show unique transcriptional features in anti-PD-1-induced T1D compared to spontaneous T1D. (A) Violin plots quantifying the percentage of blood-matching T cells in the pancreas out of all CD4+ (left) or CD8+ (right) T cells. Each dot represents the cells from one individual mouse (n = 3 mice per group). (B) Pie charts displaying the cluster proportions of non-matching (top) and PM (bottom) CD8+ T cells in the blood. The cluster that constitutes the largest proportion is annotated with text. The colors for the pie slices correspond with the clusters identified in Fig. 2 A, and the corresponding names and colors for each cluster are shared with C. (C) Violin plots showing the frequency of PM CD8+ T cells in the blood on a cluster-by-cluster basis, separated by treatment group. The clusters are those that were identified in Fig. 2 A. (D) Violin plots showing gMFI of TOX in CD8+CD11ahiCD62L T cells in the pancreas by flow cytometry analysis (left). IgG-Spt, P = 0.0393; IgG-PD1, P = 0.0408; Spt-PD1, P < 0.0001. Representative flow cytometry TOX staining on naive (NA; CD8+CD11aCD62L+) and effector CD8+CD11ahiCD62L T cells (right) from indicated treatment groups. (E) Venn diagram showing the number of upregulated genes in PM vs. non-PM CD8+ T cells between the three treatment groups. A subset of selected genes within each group is listed. Full list available in Table S5. (F) Bar plot showing the percentage of T cells with known TCR data but with unknown specificity, or TCRs that matched to NRP-v7+ sorted TCR sequences from Gearty et al. (2022). (G) Flow cytometry results of the indicated markers on NRP-v7+ CD8+ T cells and central memory (CD8+CD11ahiCD62L+) T cells in the blood of NOD mice with anti-PD-1-induced T1D. From left to right: Representative flow cytometry histograms; percent positive central memory T cells and NRP-v7+ T cells; and the ratio gMFI of NRP-v7+ over central memory T cells (CD8+CD11ahiCD62L+). Statistical significance determined using a nonparametric Mann–Whitney test with Holm-Sidak’s correction for multiple comparisons. For P values between central memory T cells and NRP-v7+ (middle panel), CD49D P = 0.0023; CXCR3 P = 0.0023; CD38 P < 0.0001; CD29 P = 0.0023, NKG2D P < 0.0001. (H) Bar plots illustrating the positive staining of indicated markers on NRP-v7+ T cells in the blood of anti-PD-1-induced T1D and non-diabetic mice. Significance between PD1 and IgG for the following markers: CD94 P = 0.0277; SLAMF7 P = 0.0202; PD-1 P = 0.0294; CX3CR1 P = 0.0001. (I) Violin plots quantifying percent Ki-67+ staining within CD8+CD11ahiCD62L T cells in the blood measured by flow cytometry. IgG-PD1, P < 0.0001; Spt-PD1, P < 0.0001. Representative flow cytometry Ki-67 staining on naive (NA; CD8+CD11aCD62L+) and effector CD8+CD11ahiCD62L T cells (right). Flow cytometry results are pooled from 3 to 25 independent experiments and significance determined using a non-parametric Kruskall–Wallis test with Dunn’s posthoc test for multiple comparisons. Bars in violin plots represent the first quartile, median, and third quartile. Significant comparisons are indicated with asterisks: *, P < 0.05; **, P < 0.01; ***, P < 0.001.
Figure S5.
Figure S5.
Anti-PD-1-induced T1D in young NOD recapitulates features of anti-PD-1-induced T1D in older NOD mice. (A) Percent diabetes-free NOD mice administered anti-PD-1 antibody starting at 4 wk of age (blue) or 10 wk of age (purple). Kaplan–Meier survival curves and results from a Mantel–Cox log-rank test (P < 0.001) are shown. (B) Violin plots quantifying the percentage of CD8+CD11ahiCD62L T cells in the pancreas out of total T cells measured by flow cytometry. IgG-PD1 (10 wk), P < 0.001; PD1 (10 wk)-Spt, P < 0.001; IgG-PD1 (4 wk), P < 0.001. (C) Violin plots quantifying the total number of CD8+CD11ahiCD62L T cells in the pancreas measured by flow cytometry. IgG-PD1 (10 wk), P < 0.001; IgG-PD1 (4 wk), P = 0.004. (D) Violin plots quantifying the total number of NRP-v7+ CD8+CD11ahiCD62L T cells in the pancreas measured by flow cytometry. IgG-PD1 (10 wk), P < 0.001; IgG-PD1 (4 wk), P = 0.01; PD1 (10 wk)-Spt, P < 0.001; PD1 (4 wk)-Spt, P < 0.001. (E) Violin plots quantifying the percentage of CD127+ CD8+CD11ahiCD62L T cells in the pancreas measured by flow cytometry. IgG-PD1 (4 wk), P = 0.007; PD1 (10 wk)-Spt, P = 0.002; PD1 (4 wk)-Spt, P < 0.001. (F) Violin plots quantifying the percentage of Ki-67+ CD8+CD11ahiCD62L T cells in the pancreas measured by flow cytometry. IgG-PD1 (10 wk), P < 0.001; PD1 (10 wk)-Spt, P < 0.001; PD1 (4 wk)-Spt, P = 0.001. (G) Violin plots showinggMFI) of TOX in CD8+CD11ahiCD62L T cells in the pancreas by flow cytometry analysis. IgG-PD1, P = 0.01; PD1 (10 wk)-PD1 (4 wk), P < 0.001; PD1 (10 wk)-Spt, P < 0.001. (H) Violin plots quantifying the percentage of Ki-67+ CD8+CD11ahiCD62L T cells in the blood measured by flow cytometry. IgG-PD1 (10 wk), P < 0.001; PD1 (10 wk)-Spt, P < 0.001; PD1 (4 wk)-Spt, P = 0.001; IgG-PD1 (4 wk) P < 0.001. (I) Violin plots showing gMFI of TOX in CD8+CD11ahiCD62L T cells in the blood by flow cytometry analysis. IgG-PD1 (10 wk), P = 0.02; IgG-Spt, P < 0.001; PD1 (10 wk)-PD1 (4 wk), P = 0.02; PD1 (10 wk)-Spt, P < 0.001; PD1 (4 wk)-Spt, P = 0.001. (J) Violin plots quantifying the total number of CD4+CD11ahiCD62LFoxP3 Tcon in the pancreas measured by flow cytometry. IgG-PD1 (4 wk), P < 0.001; IgG-Spt, P = 0.04. (K) Violin plots quantifying the percentage of Ki-67+ CD4+CD11ahiCD62LFoxP3 Tcon in the pancreas measured by flow cytometry. IgG-PD1 (10 wk), P < 0.001; PD1 (10 wk)-Spt, P < 0.001; PD1 (4 wk)-Spt, P < 0.001. (L) Violin plots quantifying the percentage of CD127+ CD4+CD11ahiCD62LFoxP3 Tcon in the pancreas measured by flow cytometry. IgG-PD1 (4 wk), P = 0.003; IgG-Spt, P = 0.008; PD1 (10 wk)-Spt, P < 0.001; PD1 (4 wk)-Spt, P < 0.001. Significant comparisons are indicated with asterisks: *, P < 0.05; **, P < 0.01; ***, P < 0.001.

References

    1. Abdelsamed, H.A., Zebley C.C., Nguyen H., Rutishauser R.L., Fan Y., Ghoneim H.E., Crawford J.C., Alfei F., Alli S., Ribeiro S.P., et al. . 2020. Beta cell-specific CD8+ T cells maintain stem cell memory-associated epigenetic programs during type 1 diabetes. Nat. Immunol. 21:578–587. 10.1038/s41590-020-0633-5 - DOI - PMC - PubMed
    1. Akturk, H.K., Kahramangil D., Sarwal A., Hoffecker L., Murad M.H., and Michels A.W.. 2019. Immune checkpoint inhibitor-induced Type 1 diabetes: A systematic review and meta-analysis. Diabet. Med. 36:1075–1081. 10.1111/dme.14050 - DOI - PMC - PubMed
    1. Alfei, F., Kanev K., Hofmann M., Wu M., Ghoneim H.E., Roelli P., Utzschneider D.T., von Hoesslin M., Cullen J.G., Fan Y., et al. . 2019. TOX reinforces the phenotype and longevity of exhausted T cells in chronic viral infection. Nature. 571:265–269. 10.1038/s41586-019-1326-9 - DOI - PubMed
    1. Almutairi, A.R., McBride A., Slack M., Erstad B.L., and Abraham I.. 2020. Potential immune-related adverse events associated with monotherapy and combination therapy of Ipilimumab, Nivolumab, and Pembrolizumab for advanced melanoma: A systematic review and meta-analysis. Front. Oncol. 10:91. 10.3389/fonc.2020.00091 - DOI - PMC - PubMed
    1. Anderson, M.S., and Bluestone J.A.. 2005. The NOD mouse: A model of immune dysregulation. Annu. Rev. Immunol. 23:447–485. 10.1146/annurev.immunol.23.021704.115643 - DOI - PubMed

Publication types

Substances