. 2023 Oct;72(10):3229-3242.
doi: 10.1007/s00262-023-03488-2. Epub 2023 Jul 11.

SIGLEC10+ macrophages drive gastric cancer progression by suppressing CD8+ T cell function

Affiliations

SIGLEC10+ macrophages drive gastric cancer progression by suppressing CD8+ T cell function

Yixian Guo et al. Cancer Immunol Immunother. 2023 Oct.

Abstract

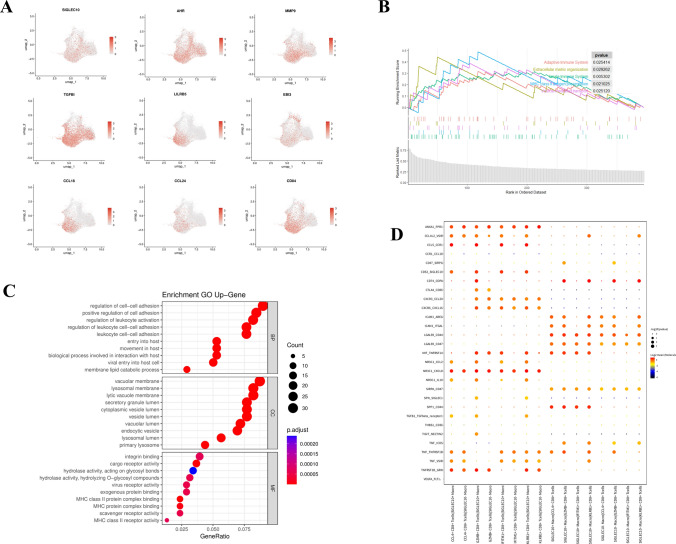
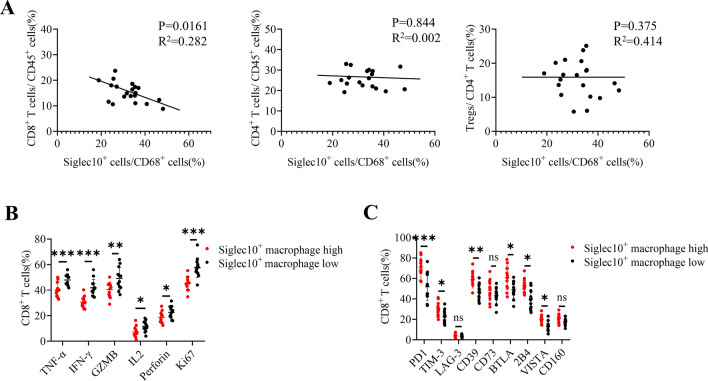
Existing immune checkpoint inhibitors focus on activating T cells and show limited effectiveness in gastric cancer (GC). SIGLEC10 is identified as a novel tumor-associated macrophage-related immune checkpoint in other cancer types. However, its immunosuppressive role and clinical significance in GC remain unclear. In this study, we find a dominant expression of SIGLEC10 on CD68+ macrophages in GC. SIGLEC10 can suppress the proliferation and function of tumor-infiltrating CD8+ T cells in vitro via the Akt/P38/Erk signaling pathway. Furthermore, in ex vivo and in vivo models, SIGLEC10 blockade promotes CD8+ T cell effector function. Finally, SIGLEC10+ macrophages are positively correlated with the adverse prognosis of GC. Our study highlights that SIGLEC10 directly suppresses T cell function and serves as a promising target for immunotherapy and suggests SIGLEC10+ macrophages as a novel potential predictor of the clinical prognosis of GC.

Keywords: CD68; CD8+ T cell; Gastric cancer; Macrophage; SIGLEC10.


Conflict of interest statement

The authors declare no potential conflicts of interest.

Figures

Fig. 1
Fig. 1
SIGLEC10+ macrophages are highly infiltrative in GC. A UMAP plot and clustering analysis of combined single-cell sequencing data from human gastric cancer. B SIGLEC10 expression in various cell types from GC single-cell sequencing data. C Tumor tissue samples werecollected from GC patients (n = 20) undergoing surgery in Renji Hospital. Representative flow cytometry showing subpopulations gated SIGLEC10+ CD45+ leucocytes from fresh human GC samples. D Normal tissue and tumor tissue samples were collected from GC patients (n = 30) undergoing surgery in Renji Hospital. The percentage of SIGLEC10+ CD68+ cells in normal tissues and tumor tissues was measured by FACS. E Immunofluorescence staining of SIGLEC10+ CD68+ cells Tregs in GC tumor tissues or normal tissue. Data are representative of three independent experiments. All data are represented as mean ± sd. ***, p < 0.001. UMAP, Uniform Manifold approximation and projection. GC, gastric cancer
Fig. 2
Fig. 2
Characterization of SIGLEC10+ macrophages by scRNA-seq in GC. A UMAP plot showing expression levels of differentiated genes on SIGLEC10+ macrophages. B GSEA (Gene Set Enrichment Analysis) of differentiated genes between SIGLEC10+ macrophages and SIGLEC10 macrophages. C GO pathway analysis of differentiated genes between SIGLEC10+ macrophages and SIGLEC10 macrophage. D Bubble heatmap showing the interaction strength for selected ligand–receptor pairs on SIGLEC10+ macrophages and CD8+ T cell subtypes with CellPhoneDB analysis. Dot size indicates p value, colored by interaction strength levels. UMAP, Uniform manifold approximation and projection
Fig. 3
Fig. 3
SIGLEC10+ macrophages impair GC infiltrating CD8+ T cell function. A Tumor tissue samples were collected from GC patients (n = 20) undergoing surgery in Renji Hospital. The percentage of SIGLEC10+ CD68+ cells, CD8+ T cells, CD4+ T cells, and FOXP3+ Tregs in tumor tissues were measured by FACS. The correlation between SIGLEC10+ macrophages and different T cells was assayed. B Subjects were divided into two groups. The median cutoff for SIGLEC10+ macrophages was 40 percent in GC. If the proportion of SIGLEC10+ macrophages in the subject was higher than 40%, the subject was considered as a high infiltration group. If it is lower than 40%, it is considered as a low infiltration group. Expression of CD8+ T functional markers (TNF-α, TNF-γ, GZMB, IL2, Perforin, Ki67) between the high SIGLEC10+ macrophages group and low SIGLEC10+ macrophages group was measured by FACS. C The expression of CD8+ T exhausted marker (PD-1, TIM-3, LAG-3, CD73, BTLA, 2B4, VISTA, CD160) between high SIGLEC10+ macrophages group and low SIGLEC10+ macrophages group was measured by FACS. Data are representative of three independent experiments. All data are represented as mean ± sd. *, p < 0.05, **p < 0.01; ***, p < 0.001, ns, not significant
Fig. 4
Fig. 4
SIGLEC10+ macrophages inhibit GC-infiltrating CD8+ T cell function in vitro. A CD8+ T cells were isolated from fresh tumor tissues and PBMCs. The CD8+ T cells were labeled with CellTrace Violet (CTV) following the protocol from the CTV Proliferation Kit. CTV-labeled CD8+ T cells were after stimulation with 0.1 μg/ml of anti-CD3 in the presence of human SIGLEC10 fusion protein (hS10-hIg, 5 μg/ml or 15 μg/ml) or control (hIg, 5 μg/ml) for 3 days. B TNFα/IFN-γ expression of CD8+ T cells was measured by flow cytometry. Data are representative of three independent experiments. All data are represented as mean ± sd. ***, p < 0.001, ns, not significant
Fig. 5
Fig. 5
SIGLEC10 inhibits activation of CD8+ T cells through the Akt/Erk/p38 signaling pathway. CD8+ T cells were isolated from fresh tumor tissues and after stimulation with 0.1 μg/ml of anti-CD3 in the presence of 5 μg/ml human SIGLEC10 fusion protein (hS10-hIg, 5 μg/ml or 15 μg/ml) or control (hIg, 5 μg/ml) for 6 h. Representative western blotting result for relative total AKT, ERK, P38, and phosphorylation (phos) of AKT, ERK, P38 in T cells. Quantitative analysis of the band intensities for phosphorylation levels normalized by total protein levels. Data are representative of three independent experiments. All data are represented as mean ± sd. ***, p < 0.001
Fig. 6
Fig. 6
SIGLEC10 blockade reactivates CD8+ T cell function. GC tissues were digested, incubated with 50 μg/ml SIGLEC10-neutralizing antibody or isotype control mAb (Control). B and C, and subjected to flow cytometry analysis to determine the different molecules (TNF-α, IFN-γ, GZMB, IL2, PRF-1, Ki67, PD-1, TIM-3, CD39, BTLA4, 2B4, and VISTA) expression in CD8+ T cells. Data are representative of three independent experiments. All data are represented as mean ± sd. *, p < 0.05, **p < 0.01; ***, p < 0.001, ns, not significant
Fig. 7
Fig. 7
The number of tumor-infiltrating SIGLEC10+ macrophages correlates with multiple clinical parameters of GC patients. A and B The number of tumor-infiltrating SIGLEC10+ macrophages was analyzed for putative correlations with multiple clinical parameters, such as tumor stage and patient overall survival time. For the cumulative survival curves, patients were separated into two groups by the median value (46/mm2) of tumor-infiltrating SIGLEC10+ macrophage numbers, and Kaplan–Meier plots were used to show cumulative survival differences. Each dot represents one patient. C Kaplan–Meier plots of TCGA database for GC patients. Diff, differentiated; Undiff, undifferentiated; ns, not significant. *P < 0.05; ***P < 0.001, ns, not significant. GC, gastric cancer

References

    1. Robert C, Robert C. A decade of immune-checkpoint inhibitors in cancer therapy. Nat Commun. 2020;11(1):3801. doi: 10.1038/s41467-020-17670-y. - DOI - PMC - PubMed
    1. Robert C, Thomas L, Bondarenko I, et al. Ipilimumab plus dacarbazine for previously untreated metastatic melanoma. N Engl J Med. 2011;364(26):2517–2526. doi: 10.1056/NEJMoa1104621. - DOI - PubMed
    1. Ansell SM, Lesokhin AM, Borrello I, et al. PD-1 blockade with nivolumab in relapsed or refractory Hodgkin’s lymphoma. N Engl J Med. 2015;372(4):311–319. doi: 10.1056/NEJMoa1411087. - DOI - PMC - PubMed
    1. Brahmer J, Reckamp KL, Baas P, et al. Nivolumab versus docetaxel in advanced squamous-cell non-small-cell lung cancer. N Engl J Med. 2015;373(2):123–135. doi: 10.1056/NEJMoa1504627. - DOI - PMC - PubMed
    1. Kim ST, Cristescu R, Bass AJ, et al. Comprehensive molecular characterization of clinical responses to PD-1 inhibition in metastatic gastric cancer. Nat Med. 2018;24(9):1449–1458. doi: 10.1038/s41591-018-0101-z. - DOI - PubMed