

Trends in ICU mortality and underlying risk over three decades among mechanically ventilated patients. A group level analysis of cohorts from infection prevention studies
- PMID: 37432605
- PMCID: PMC10335996
- DOI: 10.1186/s13613-023-01159-0
Trends in ICU mortality and underlying risk over three decades among mechanically ventilated patients. A group level analysis of cohorts from infection prevention studies
Abstract
Background: Has either the underlying risk or the mortality incidence among ICU patients receiving mechanical ventilation (MV) in the literature changed in recent decades? Interpreting ICU mortality trends requires an adjusted analysis accounting for changes in underlying patient risk.
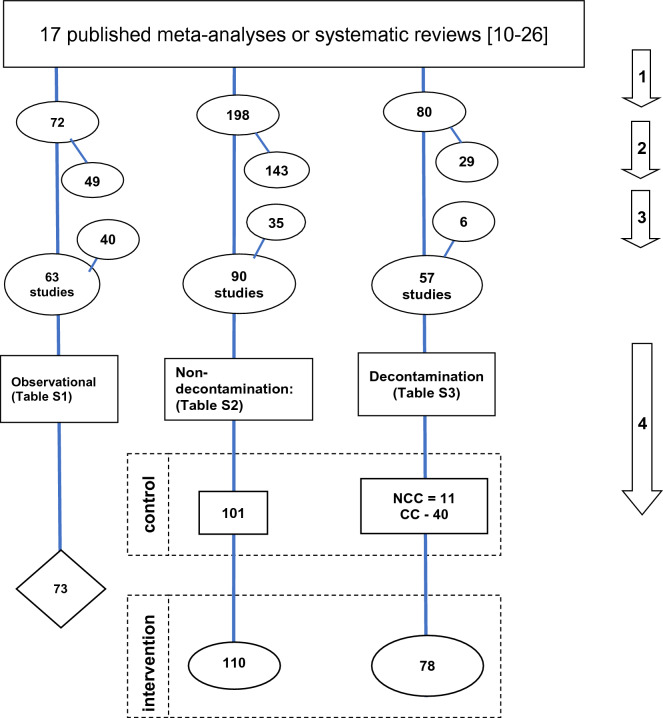
Methods: Control and intervention groups from 147 randomized concurrent control trials (RCCT) of various VAP prevention interventions, as listed primarily within 13 Cochrane reviews and 63 observational studies listed primarily within four systematic reviews. Eligible studies were those including ICU patients with > 50% of patients receiving > 24 h of MV with mortality data available. ICU mortality (censored day 21 or before) or late (after day 21) mortality together with group-mean age, and group-mean APACHE II scores were extracted from all groups. These incidences were summarized in five meta-regression models versus publication year being variously adjusted for age, APACHE II scores, type of study intervention and other group level parameters.
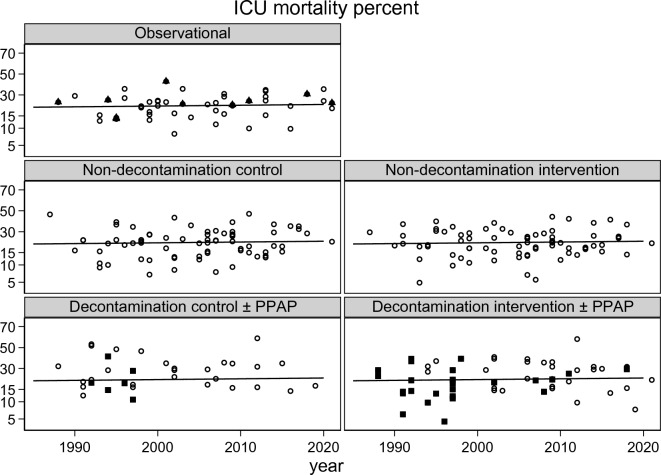
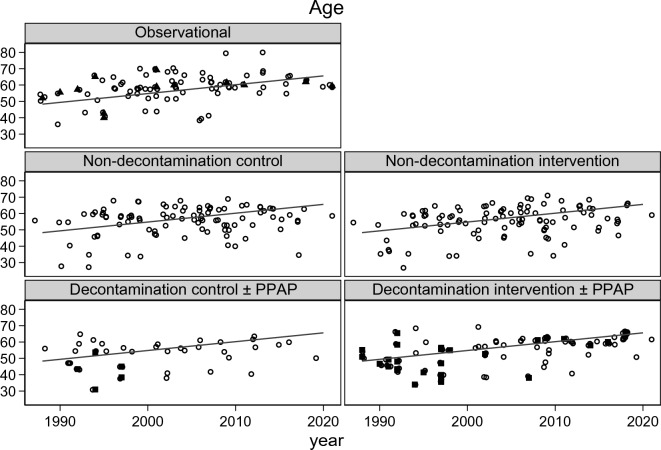
Results: Among 210 studies published between 1985 and 2021, 169 being found in systematic reviews, the increase per decade in mean mortality incidence, group-mean APACHE II scores, and group-mean age, were < 1 percentage point (p = 0.43), 1.83 (95% CI; 0.51-3.15) points, and 3.9 (95% CI; 1.1-6.7) years, respectively. Only in the model with risk adjustment for both group-mean age and group-mean APACHE II score was a significant decline in mortality apparent. In all models, the mortality incidence among concurrent control groups of decontamination studies was paradoxically five percentage points higher than benchmark and showed greater dispersion.
Conclusion: Mortality incidence has changed little over 35 years among ICU infection prevention studies whilst the patient age and underlying disease severity, measured as APACHE II, have both increased. The paradoxically high mortality among concurrent control groups within studies of decontamination methods of infection prevention remains unaccounted for.
Keywords: APACHE II; Decontamination; Infection prevention; Mortality.
© 2023. The Author(s).
Conflict of interest statement
The author declares that he has no competing interests.
Figures


Similar articles
-
[Correlation factor analysis on constipation in long-term ventilated patients in intensive care unit: a prospective observational cohort study].Zhonghua Wei Zhong Bing Ji Jiu Yi Xue. 2017 Jan;29(1):75-80. doi: 10.3760/cma.j.issn.2095-4352.2017.01.016. Zhonghua Wei Zhong Bing Ji Jiu Yi Xue. 2017. PMID: 28459409 Chinese.
-
Prognostic factors associated with mortality in mechanically ventilated patients in the intensive care unit: A single-center, retrospective cohort study of 905 patients.Medicine (Baltimore). 2019 Oct;98(42):e17592. doi: 10.1097/MD.0000000000017592. Medicine (Baltimore). 2019. PMID: 31626132 Free PMC article.
-
Discrepancies in Control Group Mortality Rates Within Studies Assessing Topical Antibiotic Strategies to Prevent Ventilator-Associated Pneumonia: An Umbrella Review.Crit Care Explor. 2020 Jan 29;2(1):e0076. doi: 10.1097/CCE.0000000000000076. eCollection 2020 Jan. Crit Care Explor. 2020. PMID: 32166296 Free PMC article. Review.
-
Paradoxical ventilator associated pneumonia incidences among selective digestive decontamination studies versus other studies of mechanically ventilated patients: benchmarking the evidence base.Crit Care. 2011;15(1):R7. doi: 10.1186/cc9406. Epub 2011 Jan 7. Crit Care. 2011. PMID: 21214897 Free PMC article. Review.
-
Incidence of coagulase-negative staphylococcal bacteremia among ICU patients: decontamination studies as a natural experiment.Eur J Clin Microbiol Infect Dis. 2020 Apr;39(4):657-664. doi: 10.1007/s10096-019-03763-0. Epub 2019 Dec 4. Eur J Clin Microbiol Infect Dis. 2020. PMID: 31802335 Free PMC article.
Cited by
-
Intensive Care Unit Nurses' Experiences in Caring for End-of-Life Patients in Saudi Arabia: A Qualitative Study.Int J Environ Res Public Health. 2024 Jul 17;21(7):931. doi: 10.3390/ijerph21070931. Int J Environ Res Public Health. 2024. PMID: 39063507 Free PMC article.
-
The hidden dangers in routine medical complaints: uncovering patient harm.BMC Health Serv Res. 2025 Jul 18;25(1):957. doi: 10.1186/s12913-025-13105-w. BMC Health Serv Res. 2025. PMID: 40682066 Free PMC article.
-
Indirect (herd) effects of topical antibiotic prophylaxis and oral care versus non-antimicrobial methods increase mortality among ICU patients: realigning Cochrane review data to emulate a three-tier cluster randomised trial.BMJ Open. 2023 Nov 30;13(11):e064256. doi: 10.1136/bmjopen-2022-064256. BMJ Open. 2023. PMID: 38035749 Free PMC article. Review.
-
Visualizing and diagnosing spillover within randomized concurrent controlled trials through the application of diagnostic test assessment methods.BMC Med Res Methodol. 2024 Aug 16;24(1):182. doi: 10.1186/s12874-024-02296-1. BMC Med Res Methodol. 2024. PMID: 39152400 Free PMC article.
References
Publication types
LinkOut - more resources
Full Text Sources
