. 2023 Jul 11:12:e83538.
doi: 10.7554/eLife.83538.

A novel single alpha-helix DNA-binding domain in CAF-1 promotes gene silencing and DNA damage survival through tetrasome-length DNA selectivity and spacer function

Affiliations

A novel single alpha-helix DNA-binding domain in CAF-1 promotes gene silencing and DNA damage survival through tetrasome-length DNA selectivity and spacer function

Ruben Rosas et al. Elife. .

Abstract

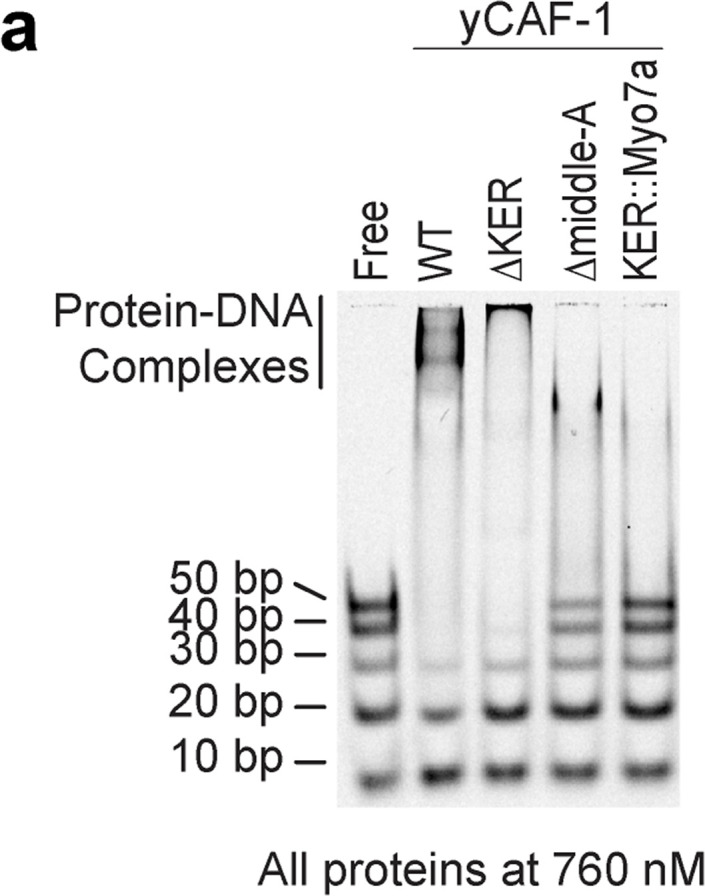
The histone chaperone chromatin assembly factor 1 (CAF-1) deposits two nascent histone H3/H4 dimers onto newly replicated DNA forming the central core of the nucleosome known as the tetrasome. How CAF-1 ensures there is sufficient space for the assembly of tetrasomes remains unknown. Structural and biophysical characterization of the lysine/glutamic acid/arginine-rich (KER) region of CAF-1 revealed a 128-Å single alpha-helix (SAH) motif with unprecedented DNA-binding properties. Distinct KER sequence features and length of the SAH drive the selectivity of CAF-1 for tetrasome-length DNA and facilitate function in budding yeast. In vivo, the KER cooperates with the DNA-binding winged helix domain in CAF-1 to overcome DNA damage sensitivity and maintain silencing of gene expression. We propose that the KER SAH links functional domains within CAF-1 with structural precision, acting as a DNA-binding spacer element during chromatin assembly.

Keywords: DNA binding; S. cerevisiae; chromosomes; gene expression; histone chaperone; molecular biophysics; nucleosome assembly; structural biology.


Conflict of interest statement

RR, NA, AS, DS, JT JKT, eLife Senior Editor, RA, MC No competing interests declared

Figures

Figure 1.
Figure 1.. The yKER region favors binding to tetrasome-length DNA and facilitates the function of yCAF-1 in vivo.
(a) Cartoon representing the molecular architecture of the yCAF-1 complex highlighting the protein subunits and functional domains. Domains include the K/E/R-rich (DNA-binding domain), PCNA interacting peptides (PIP boxes), Cac3-binding site (small), E/D-rich regions (histone binding), Cac2-binding site (middle), and a DNA-binding winged helix domain (WHD). (b–i) Representative images of electrophoretic mobility shift assay (EMSA) experiments for yCAF-1 or yKER, with 2 or 3 nM of Cy5-DNA; the range of protein concentrations are: 5–250 and 9–84 nM, respectively. (j, k) Quantitative analyses of all EMSAs of yCAF-1 or yKER with Cy5-labeled DNA. Data from at least three independent experiments were plotted as the mean and standard deviation (error bars). The binding curves were fitted using Equation 1. (l) Table summarizing the dissociation constant (KD) and Hill coefficient (h) values obtained from EMSAs of the indicated proteins and DNA. Values were obtained from fitting plots using Equation 1. (m) Representative image of an EMSA experiment for yCAF-1 ∆KER with 3 nM of Cy5-80 bp DNA; the range of protein concentrations is 49–440 nM. (n) Yeast spot assay with fivefold serial dilutions of cultures of the indicated strains; grown in the presence of Camptothecin (CPT) at the specified concentrations. (o) Bar graph indicating the percentage of cells exhibiting elevated Green Fluorescent Protein (GFP) levels from yeast cultures of the indicated strains sorted by flow cytometry. Error bars indicate the standard deviation of the calculated values from three measurements. Statistical significance was calculated by Student’s t-test where ***p < 0.001 relative to Cac1 Wild-type (WT) cells. See also Figure 1—source data 1 and Figure 1—source data 2.
Figure 1—figure supplement 1.
Figure 1—figure supplement 1.. Proteins and mutants used in this study.
Figure 1—figure supplement 2.
Figure 1—figure supplement 2.. Quality of proteins used in this study.
4–20% gradient sodium dodecyl sulfate–polyacrylamide gel electrophoresis (SDS–PAGE) stained with Coomassie Blue of the indicated protein domains purified from bacteria (b, c) or yCAF-1 complexes purified from insect cells (a). (d) Western blot of yeast cell lysates harboring the indicated Cac1 mutations along with a FLAG tag motif incorporated at the C-terminus of Cac1. An anti-FLAG antibody was used to detect expression of the FLAG-tagged Cac1 proteins from cell lysates. An anti-GAPDH antibody was used to determine the levels of GAPDH protein from the cell lysates as a loading control. See also Figure 1—figure supplement 1.
Figure 1—figure supplement 3.
Figure 1—figure supplement 3.. Chromatin assembly factor 1 (CAF-1) DNA-binding analysis and in vivo assays.
(a, b) Representative images of electrophoretic mobility shift assays (EMSAs) with 2 nM of the indicated Cy5-labeled DNA and yWHD over a range of protein concentrations of 12–760 nM. (c) Quantitative analyses of EMSAs of yWHD with Cy5-labeled DNA. Data from at least three independent experiments were plotted as the mean and standard deviation (error bars). The binding curves were fitted using Equation 1. (d, e) Yeast spot assay with fivefold serial dilutions of cultures of the indicated strains; grown under in the presence of Camptothecin (CPT), or Zeocin at the specified concentrations. (f) Representative flow cytometry histograms of cultures of the indicated yeast strains sorted with the Alexa Fluor 488-4 channel that detects Green Fluorescent Protein (GFP) signal. (g) Representative alkaline agarose gels showing end-labeled Okazaki fragments purified from cells of the indicated genotype after repression of DNA ligase 1 for 2.5 hr. See also Figure 1—figure supplement 3—source data 1.
Figure 2.
Figure 2.. The yKER is a single alpha-helix (SAH) domain that forms a stable complex with DNA.
(a) Ribbon representation of the X-ray crystal structure of yCAF-1 KER region. Cac1 residues 136–222 are shown with side chains of residues Lys, Arg, and His colored in blue and Glu in red. (b) Schematic diagram of the indicated SAH sequences with positively charged residues Arg, Lys, and His, colored in blue; and negatively charged residue Glu and Asp colored in red. The brackets along the sequence represent predicted interhelical i, i+4 or i, i+3 ion pairs. (c) Overlap of circular dichroism spectra of yKER alone and in the presence of 40 bp DNA. DNA signal was subtracted from the yKER + 40 bp DNA sample to observe only changes in the protein component. (d) Thermal denaturation monitored by circular dichroism at 222 nm (m°222) of yKER alone and in the presence of 40 bp DNA. See also Figure 2—source data 1.
Figure 2—figure supplement 1.
Figure 2—figure supplement 1.. Analysis of the maltose-binding protein (MBP)-yKER crystal structure.
(a) Diagram showing electron density for a region of the yKER. The 2Fo-Fc composite omit map was contoured at 1 sigma. (b) Crystal packing diagram showing the arrangement of the four molecules in the asymmetric unit. (c) Diagram showing the superposition of the yKER domains from molecules A to D, colored green, cyan, magenta, and yellow, respectively. (d) Sodium dodecyl sulfate–polyacrylamide gel electrophoresis (SDS–PAGE) stained with Coomassie Blue showing chemical crosslinking of the yKER domain. The indicated lanes include the untreated yKER, yKER incubated with the vehicle (DMSO), and yKER crosslinked with disuccinimidyl suberate (DSS). The diffuse band indicates intra-polypeptide crosslinking. (e) Representative image of a heterogenous subunit electrophoretic mobility shift assay (EMSA) experiment with 40 bp DNA, the yKER and MBP-yKER. The proteins and DNA were mixed at a concentration of 900 nM in all reactions. The observed signal corresponds to Cy5-40 bp DNA that was spiked in all reactions to facilitate visualization. The interpreted composition of the protein–DNA complexes observed is indicated. See also Figure 2—figure supplement 1—source data 1.
Figure 2—figure supplement 2.
Figure 2—figure supplement 2.. DNA-binding properties of the yKER.
(a) Graph of circular dichroism spectra of 40 bp DNA alone and in the presence of yKER. The yKER spectrum was subtracted from the 40 bp + yKER sample to observe only changes in the DNA component. (b) Representative image of a SYBR green-stained electrophoretic mobility shift assay (EMSA) experiment for Myosin 7a single alpha-helix (SAH) with a 10-bp DNA ladder. 500 nM of total DNA ladder was incubated with a range of 64 nM to 1 µM concentrations of protein. (c) Helical net diagram of yKER. In this representation, the SAH structure has been split along a helical track and unwound so it can be displayed in 2D. Amino acids colored in red are negatively charged, blue are positively charged, green is glutamine, and white are other polar or hydrophobic. Lines connecting colored residues represent predicted ion pair interactions based on strength: solid lines, strong; black dashed lines, medium; yellow dashed lines, weak. (d) Crystal structure of the Myosin 7a SAH along with its helical net representation as in (c). (e) Yeast spot assay with fivefold serial dilutions of cultures of the indicated strains; grown in the presence of Zeocin at the specified concentrations. See also Figure 2—figure supplement 2—source data 1.
Figure 3.
Figure 3.. The yKER middle region is required for DNA binding and yCAF-1 function in vivo.
(a) Surface representation of two views of the yCAF-1 KER structure with basic residues colored in blue, acidic in red, and polar or hydrophobic in gray. The dashed lines at the top illustrate the yKER truncations under investigation. The bar graph represents the net charge calculated for a sliding window of seven amino acids along the yKER sequence. The resulting net charge was assigned to the fourth residue in the window. (b) Overlay of circular dichroism spectra of the yKER constructs indicated in (a). (c–g) Representative images of electrophoretic mobility shift assay (EMSA) experiments and binding curves for the yKER constructs indicated in (a) Cy5-40 bp DNA (either 2 or 2.5 nM) binding was observed over a range of protein concentrations of 9–84 nM for the yKER, 12–760 nM for the middle-A, 0.37–1 µM for N-half, C-half, and middle-B. KD and h values were calculated from binding curves fitted with Equation 1 and were plotted as the mean of at least three independent experiments. (h) Representative image of an EMSA showing the binding of a fixed concentration (250 nM) of yCAF-1, yCAF-1 ∆KER, yCAF-1 ∆middle-A, and yCAF-1 KER::Myo7aSAH proteins binding to a set of different length of Cy5-labeled DNA fragments at 1 nM each. (i) Yeast spot assay with fivefold serial dilutions of cultures of the indicated strains; grown in the presence of Camptothecin (CPT) at the specified concentrations. (j) Bar graph indicating the percentage of cells exhibiting elevated Green Fluorescent Protein (GFP) levels from yeast cultures of the indicated strains sorted by flow cytometry. Error bars indicate the standard deviation of the calculated values from three measurements. Statistical significance was calculated by Student’s t-test where **p < 0.01 and ***p < 0.001 are relative to Cac1 WT cells. See also Figure 3—source data 1.
Figure 3—figure supplement 1.
Figure 3—figure supplement 1.. The yKER middle region is required for DNA binding.
Representative image of an electrophoretic mobility shift assay (EMSA) showing the binding of a fixed concentration (760 nM) of yCAF-1, yCAF-1 ∆KER, yCAF-1 ∆middle-A, and yCAF-1 KER::Myo7aSAH proteins binding to a set of different length of Cy5-labeled DNA fragments at 1 nM each. See also Figure 3—source data 1.
Figure 4.
Figure 4.. The yKER confers DNA-length selectivity to yCAF-1.
(a–e) Representative images of electrophoretic mobility shift assays (EMSAs) showing DNA binding of yCAF-1, yKER, yWHD, yCAF-1 ∆WHD, or yCAF-1 ED::GSL where each Cy5-labeled DNA fragment is at 1 nM concentration and the range of protein concentration was 37–760 nM for all constructs. Below each gel image, the graph shows the quantitation of free (unbound) DNA signal for each Cy5-labeled DNA as a function of protein concentration. The data are plotted as the mean and standard deviation from at least three measurements. (f) Plots representing the apparent KD (KDapp) of the individual DNA fragments from the Cy5-DNA ladder for the indicated yCAF-1 constructs. (g) Plot of the rate (slope) of change of the apparent dissociation constant from 40 to 50 bp. One-way ANOVA analyses show significant differences for the ED:GSL and KER:hKER mutants (**p < 0.01 and ***p < 0.001). (h) Plot representing the protein concentration required to achieve 50% depletion of the individual DNA fragments from the Cy5-DNA ladder for the indicated chromatin assembly factor 1 (CAF-1) domains. See also Figure 4—source data 1.
Figure 5.
Figure 5.. The length and the phase of the yKER single alpha-helix (SAH) modulate yCAF-1 functions in vivo.
(a) Cartoon representing the yCAF-1 2xKER construct along with a representative image of an electrophoretic mobility shift assay (EMSA) showing binding to a set of Cy5-labeled DNA fragments (1 nM each) with a range of protein concentrations from 37 to 630 nM. Below the EMSA image, the free (unbound) DNA signal for each Cy5-labeled DNA is plotted as a function of the protein concentration. The error bars are the standard deviation from at least three measurements. (b) Yeast spot assays with fivefold serial dilutions of cultures of the indicated strains; grown in the presence of Camptothecin (CPT) at the specified concentrations. (c) Bar graph indicating the percentage of cells exhibiting elevated Green Fluorescent Protein (GFP) levels from yeast cultures of the indicated strains sorted by flow cytometry. Error bars indicate the standard deviation of the calculated values from three measurements. Statistical significance was calculated by Student’s t-test where *p < 0.05, **p < 0.01, and ***p < 0.001 relative to Cac1 WT cells. (d, e) Yeast spot assays as in (b) where cartoons on the left represent the shift of alpha helical turns for the indicated KER deletions in yCAF-1. See also Figure 5—source data 1.
Figure 5—figure supplement 1.
Figure 5—figure supplement 1.. Analysis of the yKER length.
(a) Representative image of and electrophoretic mobility shift assay (EMSA) experiment of yCAF-1 +N-half, where each Cy5-labeled DNA fragment was at 1 nM concentration and the range of protein concentration was 37–760 nM. The graph shows the quantitation of free (unbound) DNA signal for each Cy5-labeled DNA as a function of protein concentration. (b, c) Yeast spot assay with fivefold serial dilutions of cultures of the indicated strains; grown in the presence of Zeocin or Camptothecin (CPT) at the specified concentrations. See also Figure 5—figure supplement 1—source data 1.
Figure 6.
Figure 6.. Chromatin assembly factor 1 (CAF-1) DNA-length selectivity by the KER is species specific and its function is not conserved in vivo.
(a) Sequence of the KER region from human (CHAF1A, top) and yeast (Cac1, bottom) homologs with positively charged residues Arg and Lys colored in blue, and negatively charged residue Glu and Asp colored in red. (b, c) Images of representative electrophoretic mobility shift assays (EMSAs) of human KER (hKER) and yCAF-1 KER::hKER were each Cy5-labeled DNA fragment is at 1 nM concentration and the range of protein concentration was 37–760 nM for both constructs. The graphs below show the quantitation of free (unbound) DNA signal for each Cy5-labeled DNA as a function of protein concentration. The data are plotted as the mean and standard deviation (error bars) from at least three measurements. (d) Yeast spot assay with fivefold serial dilutions of cultures of the indicated strains; grown in the presence of Camptothecin (CPT) at the specified concentrations. (e) Bar graph indicating the percentage of cells exhibiting elevated Green Fluorescent Protein (GFP) levels from yeast cultures of the indicated strains sorted by flow cytometry. Error bars indicate the standard deviation of the calculated values from three measurements. Statistical significance was calculated by Student’s t-test where **p < 0.01 and ***p < 0.001 relative to Cac1 WT cells. See also Figure 6—source data 1.
Figure 6—figure supplement 1.
Figure 6—figure supplement 1.. Analysis of the substitution of the yKER with the hKER.
(a) Helical net diagram of the predicted single alpha-helix (SAH) of the hKER (CHAF1A residues 331–441). In this representation, the SAH structure has been split along a helical track and unwound so it can be displayed in 2D, with coloration as in Figure 2—figure supplement 2c. Lines connecting colored residues represent predicted ion pair interactions based on strength: solid lines, strong; black dashed lines, medium; yellow dashed lines, weak. (b) Circular dichroism spectra of the hKER. (c) Thermal denaturation monitored by circular dichroism at 222 nm (m°222) of the hKER. (d) Yeast spot assay with fivefold serial dilutions of cultures of the indicated strains; grown in the presence of Zeocin at the specified concentrations. See also Figure 6—figure supplement 1—source data 1.
Figure 7.
Figure 7.. Proposed molecular mechanism model of KER-mediated nascent tetrasome assembly by CAF-1.
(a) The KER safeguards DNA for tetrasome assembly. Because the KER has strong binding affinity toward DNA and is readily competent for binding, recruitment of CAF-1 to DNA through the KER can be an initial transient state prior to assembly of tetrasomes during DNA replication (left panel). Furthermore, the DNA-length selectivity function of the KER equips CAF-1 to bind to free DNA regions that are tetrasome-length (≥40 bp). While CAF-1 is bound to DNA through the KER, CAF-1 can receive newly synthesized H3/H4 dimers from the histone chaperone Anti-silencing Function 1 (Asf1) which in turn facilitates DNA binding of the winged helix domain (WHD; middle panel). The KER and WHD bind cooperatively to DNA which facilitate the recruitment of two copies of the CAF-1–H3/H4 complex to the same DNA vicinity (middle panel). A transient DNA–(CAF-1–H3/H4)2 complex provides the conditions to favor the formation of the H3/H4 tetramer (middle panel, green arrows) following its the deposition on DNA and presumably ejecting CAF-1 from the DNA (right panel). (b) Deletion of the KER from yCAF-1 (yCAF-1 ∆KER) impairs binding to DNA in vitro, presumably because the WHD binds more weakly to DNA and is in an autoinhibited state. But in vivo yCAF-1 ∆KER is still competent for tetrasome assembly with minimal sensitivity to DNA damage and defects on heterochromatin formation. (c) In contrast, deletion of the KER (∆KER) in combination with inhibition of the DNA-binding function of the WHD (mWHD) dramatically impairs DNA repair and heterochromatin formation functions of yCAF-1 in vivo. Because in ∆KER+mWHD cells yCAF-1 has no detectable functional DNA-binding domain, tetrasome formation cannot occur efficiently. (d) The length of the KER domain in CAF-1 varies across species and it can alter the DNA length recognized by CAF-1 in vitro, which could alter tetrasome assembly during DNA replication.
Figure 7—figure supplement 1.
Figure 7—figure supplement 1.. Cartoon models of KER–DNA association.
(a) The KER is aligned along the length of the DNA. (b) The KER binds in the major groove of DNA in the ‘middle-A’ region similar to basic-leucine zipper proteins. The KER is shown in green and the DNA in gray.

Update of

  • doi: 10.1101/2022.10.11.511754

References

    1. Afonine PV, Grosse-Kunstleve RW, Echols N, Headd JJ, Moriarty NW, Mustyakimov M, Terwilliger TC, Urzhumtsev A, Zwart PH, Adams PD. Towards automated crystallographic structure refinement with phenix.refine. Acta Crystallographica. Section D, Biological Crystallography. 2012;68:352–367. doi: 10.1107/S0907444912001308. - DOI - PMC - PubMed
    1. Bähler J, Wu JQ, Longtine MS, Shah NG, McKenzie A, Steever AB, Wach A, Philippsen P, Pringle JR. Heterologous modules for efficient and versatile PCR-based gene targeting in Schizosaccharomyces pombe. Yeast. 1998;14:943–951. doi: 10.1002/(SICI)1097-0061(199807)14:10<943::AID-YEA292>3.0.CO;2-Y. - DOI - PubMed
    1. Baker RW, Reimer JM, Carman PJ, Turegun B, Arakawa T, Dominguez R, Leschziner AE. Structural insights into assembly and function of the RSC chromatin remodeling complex. Nature Structural & Molecular Biology. 2021;28:71–80. doi: 10.1038/s41594-020-00528-8. - DOI - PMC - PubMed
    1. Bandera AM, Bartho J, Lammens K, Drexler DJ, Kleinschwärzer J, Hopfner KP, Witte G. BusR senses bipartite DNA binding motifs by a unique molecular ruler architecture. Nucleic Acids Research. 2021;49:10166–10177. doi: 10.1093/nar/gkab736. - DOI - PMC - PubMed
    1. Barnes CA, Shen Y, Ying J, Takagi Y, Torchia DA, Sellers JR, Bax A. Remarkable Rigidity of the Single α-Helical Domain of Myosin-VI As Revealed by NMR Spectroscopy. Journal of the American Chemical Society. 2019;141:9004–9017. doi: 10.1021/jacs.9b03116. - DOI - PMC - PubMed

Publication types