. 2023 Jul 11;18(7):e0288005.
doi: 10.1371/journal.pone.0288005. eCollection 2023.

Combinatorial targeting of a specific EMT/MET network by macroH2A variants safeguards mesenchymal identity

Affiliations

Combinatorial targeting of a specific EMT/MET network by macroH2A variants safeguards mesenchymal identity

Dimitrios Valakos et al. PLoS One. .

Abstract

Generation of induced pluripotent stem cells from specialized cell types provides an excellent model to study how cells maintain their stability, and how they can change identity, especially in the context of disease. Previous studies have shown that chromatin safeguards cell identity by acting as a barrier to reprogramming. We investigated mechanisms by which the histone macroH2A variants inhibit reprogramming and discovered that they work as gate keepers of the mesenchymal cell state by blocking epithelial transition, a step required for reprogramming of mouse fibroblasts. More specifically, we found that individual macroH2A variants regulate the expression of defined sets of genes, whose overall function is to stabilize the mesenchymal gene expression program, thus resisting reprogramming. We identified a novel gene network (MSCN, mesenchymal network) composed of 63 macroH2A-regulated genes related to extracellular matrix, cell membrane, signaling and the transcriptional regulators Id2 and Snai2, all of which function as guardians of the mesenchymal phenotype. ChIP-seq and KD experiments revealed a macroH2A variant-specific combinatorial targeting of the genes reconstructing the MSCN, thus generating robustness in gene expression programs to resist cellular reprogramming.


Conflict of interest statement

The authors have declared that no competing interests exist.

Figures
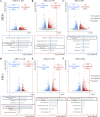
Fig 1
Fig 1. Effects of individual mH2A-variants KD in MEFs and ESCs. A.
Volcano plot depicting the number of differentially expressed genes (DEGs) in mH2A1.1 KD MEFs, as compared to scramble cells. The Bar graph shown at the bottom of the plot indicates the Pathway Enrichment Analysis (Molecular Signature Database) for the indicated group of the up- or down-regulated genes. Cut-offs for Volcano plot: p-adjusted<0.05 and Log2FC > 0.58 or <-0.58. Cut-off for Pathway analysis: p-adjusted<0.05. B. Same as in (A), but for mH2A1.2 KD in MEFs. C. Same as in (A), but for mH2A2 KD in MEFs. D. Same as in (A), but for mH2A1.1 KD in ESCs. E. Same as in (A), but for mH2A1.2 KD in ESCs. F. Same as in (A), but for mH2A2 KD in ESCs.
Fig 2
Fig 2. Identification of 73 mH2AMET/EMT genes.
A. Diagrammatic representation of the rational followed for the identification of the 73 mH2AMET/EMT genes. B. Venn Diagram depicting the number and the identity of the commonly and differentially affected expression of the mH2AMET/EMT genes following individual mH2A KDs in MEFs (left panel) and ESCs (right panel). Each Venn diagram was constructed using the differentially expressed genes (DEGs) defined with p-adjusted<0.05 and log2FC>0.58, or log2FC<-0.58. C. Heatmap depicting the expression levels (z-score) of the 73 mH2AMET/EMT genes in MEFs and ESCs (n = 2). D. Reconstruction of a mH2A-regulated gene network safeguarding the mesenchymal cell identity. The mH2A-regulated gene network in MEFs (MSCN) was reconstructed from 63 out of the 73 mH2AMET/EMT genes. The nodes were placed and grouped according to their known predominant subcellular localization (GO cellular component data) and molecular function (as annotated on the figure). Each connection (line) represents putative interactions and/or links between the indicated nodes. The expression trajectory of individual genes (nodes) during cellular reprogramming is depicted as a line within each node (Day 0, Day 3, Day 6, Day 9 and ESCs), according to our previous data [8] and publicly available data [32]. The border color of each node depicts the role assigned to this gene product in MET or EMT (orange: genes related exclusively, or mostly to EMT/mesenchymal phenotype, green: genes related exclusively, or mostly to MET/epithelial phenotype and grey: genes related to both EMT/mesenchymal and MET/epithelial phenotypes.
Fig 3
Fig 3. Diagrammatic representation of mH2A individual variants binding at the MSCN genes and the effect of the mH2A individual variants KD on the expression status of the network’s nodes.
Top Panel: The mH2A-regulated MSCN network in MEFs. The node border color depicts the role of the corresponding gene regarding MET or EMT. The 1.1 or 1.2 or 2-related beads placed on the top of the nodes denote the direct mH2A1.1, mH2A1.2 or mH2A2 binding, respectively, as deciphered from our ChIP-seq binding profiles in MEFs. mH2A1.1-nucleosome binding appears in yellow color beads on the left side of the nodes, mH2A1.2-nucleosome binding is shown in green on the middle and mH2A2-nucleosome binding is depicted in orange on the right side of the nodes. Targets were defined using broad peaks as derived from SICER2 peak-calling analysis and the peaks were annotated to genes using GREAT tool. Left Panel: Shown is a schematic representation of the mH2A1.1 KD effects on the expression on each of the mH2AMET/EMT genes as determined by RNA-seq analyses in MEFs. Blue-shade color denotes down-regulation (log2FC<-0.58), red-shade color denotes up-regulation (log2FC>0.58), whereas white color indicates no statistically significant changes in gene expression (p-adjusted<0.05). The mH2A1.1-nucleosome binding appears in dark grey to represent the reduced binding due to the histone KD. Right Panel: Same as in left panel, except that it represents the effect of mH2A1.2 KD. The mH2A1.2-nucleosome binding appears in dark grey to represent the reduced binding due to the histone KD. Bottom Panel: Same as in left panel, except that it represents the effect of mH2A2 KD. The mH2A2-nucleosome binding appears in dark grey to represent the reduced binding due to the histone KD.
Fig 4
Fig 4. mH2A nucleosomes function as epigenetic barriers safeguarding cell identity. A.
Graphic representation of a model depicting the role of mH2A nucleosomes in defining thresholds of cellular reprogramming. Left Panel: OSKM expression in MEFs induces MET via stochastic mechanisms followed by deterministic processes leading to pluripotency. In wild type MEFs (left panel), OSKM activity perturbs the steady state of the MSCN, inducing down-regulation of mesenchymal genes and up-regulation of the epithelial ones. mH2A KD induces down-regulation of the MSCN’s mesenchymal genes and up-regulation of the epithelial ones before the OSKM overexpression, lowering the barriers required for cell fate switch (Right panel). As a result, mH2A-KD MEFs can be reprogrammed more efficiently, since the cells are poised towards the epithelial state before the initiation of the process. MET during reprogramming is more efficient and, therefore, reprogramming efficiency is increased. B. Model describing the genomic function of mH2A-containing nucleosomes in safeguarding mesenchymal identity by stabilizing cell type-specific gene expression programs (blue cells safeguarded by mH2A nucleosomes). The presence of mH2A nucleosomes on various key mesenchyme genes acts as a barrier (depicted as a “wall”) to cellular reprogramming (left panel of Fig 4B). mH2A variants KD leads to a reduction of the number of mH2A nucleosomes throughout chromatin landscape and as a result the MEF transcription program is no longer strictly and/or robustly controlled (“wall” breaks in the figure right panel) allowing the escape to alternative cell fates.

References

    1. Takahashi K, Yamanaka S. Induction of Pluripotent Stem Cells from Mouse Embryonic and Adult Fibroblast Cultures by Defined Factors. Cell. 2006;126: 663–676. doi: 10.1016/j.cell.2006.07.024 - DOI - PubMed
    1. Samavarchi-Tehrani P, Golipour A, David L, Sung H, Beyer TA, Datti A, et al.. Functional Genomics Reveals a BMP-Driven Mesenchymal-to-Epithelial Transition in the Initiation of Somatic Cell Reprogramming. Cell Stem Cell. 2010;7: 64–77. doi: 10.1016/j.stem.2010.04.015 - DOI - PubMed
    1. Li R, Liang J, Ni S, Zhou T, Qing X, Li H, et al.. A mesenchymal-to-Epithelial transition initiates and is required for the nuclear reprogramming of mouse fibroblasts. Cell Stem Cell. 2010;7: 51–63. doi: 10.1016/j.stem.2010.04.014 - DOI - PubMed
    1. Chronis C, Fiziev P, Papp B, Butz S, Bonora G, Sabri S, et al.. Cooperative Binding of Transcription Factors Orchestrates Reprogramming. Cell. 2017;168: 442–459.e20. doi: 10.1016/j.cell.2016.12.016 - DOI - PMC - PubMed
    1. Hu X, Zhang L, Mao S-Q, Li Z, Chen J, Zhang R-R, et al.. Tet and TDG Mediate DNA Demethylation Essential for Mesenchymal-to-Epithelial Transition in Somatic Cell Reprogramming. Cell Stem Cell. 2014;14: 512–522. doi: 10.1016/j.stem.2014.01.001 - DOI - PubMed

Publication types