. 2023 Jul 5;40(7):msad157.
doi: 10.1093/molbev/msad157.

Uncovering Footprints of Natural Selection Through Spectral Analysis of Genomic Summary Statistics

Affiliations

Uncovering Footprints of Natural Selection Through Spectral Analysis of Genomic Summary Statistics

Sandipan Paul Arnab et al. Mol Biol Evol. .

Abstract

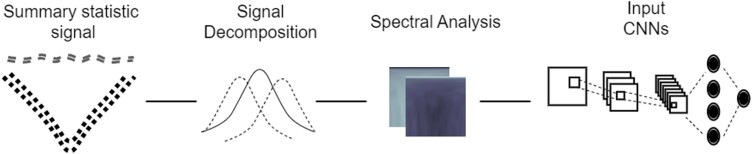
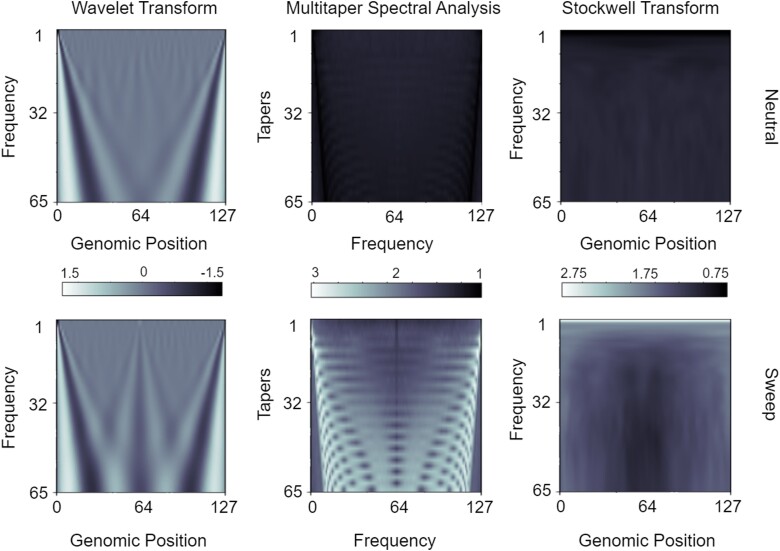
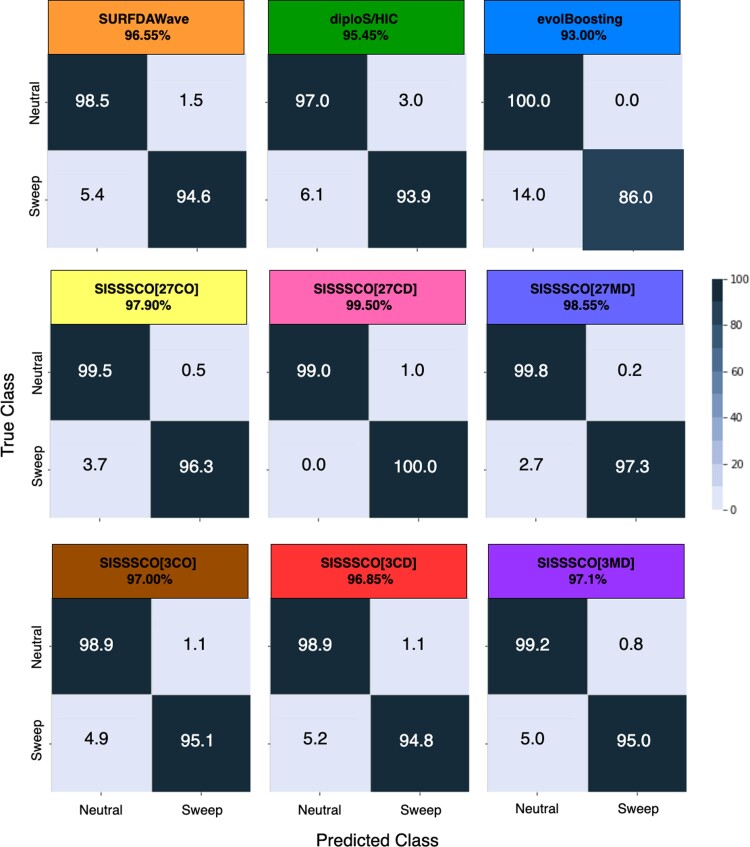
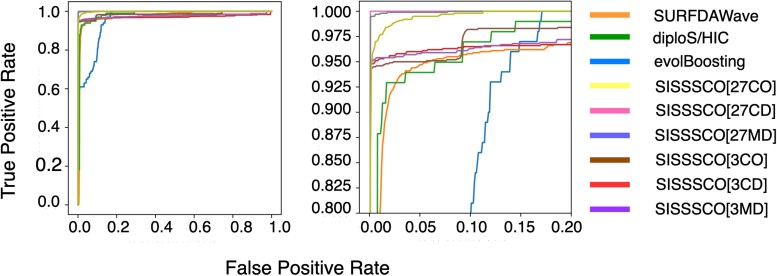
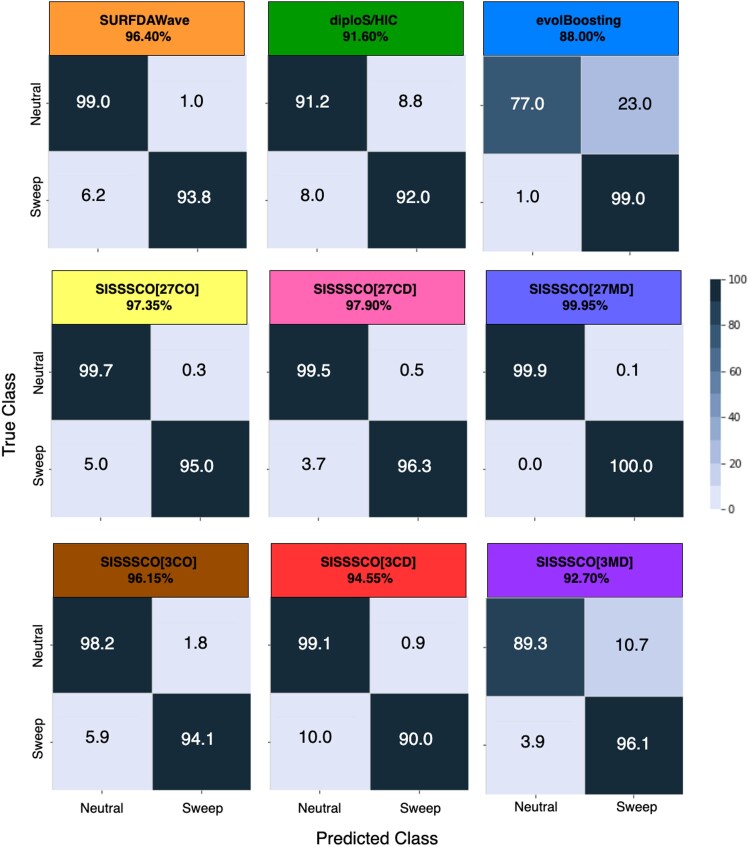
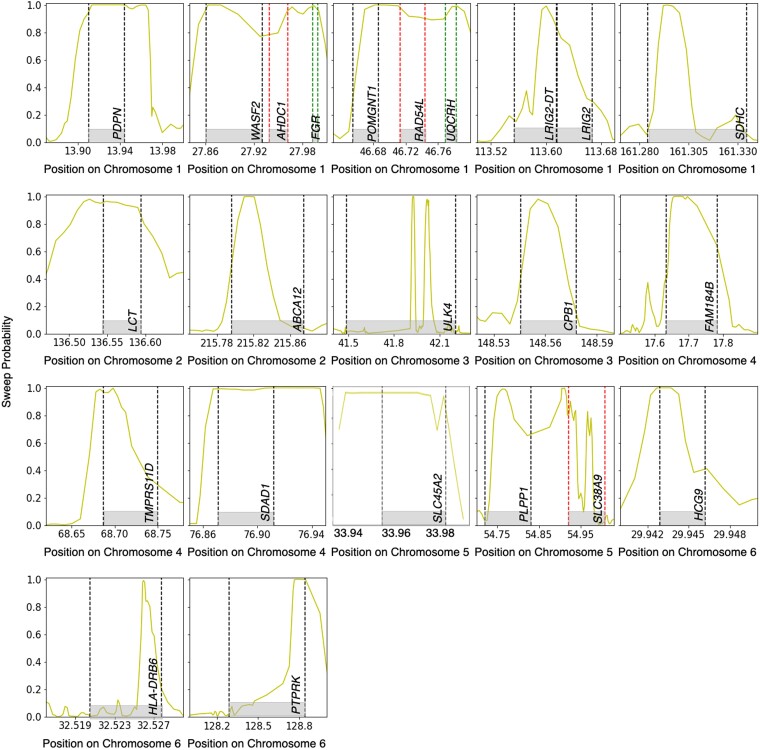
Natural selection leaves a spatial pattern along the genome, with a haplotype distribution distortion near the selected locus that fades with distance. Evaluating the spatial signal of a population-genetic summary statistic across the genome allows for patterns of natural selection to be distinguished from neutrality. Considering the genomic spatial distribution of multiple summary statistics is expected to aid in uncovering subtle signatures of selection. In recent years, numerous methods have been devised that consider genomic spatial distributions across summary statistics, utilizing both classical machine learning and deep learning architectures. However, better predictions may be attainable by improving the way in which features are extracted from these summary statistics. We apply wavelet transform, multitaper spectral analysis, and S-transform to summary statistic arrays to achieve this goal. Each analysis method converts one-dimensional summary statistic arrays to two-dimensional images of spectral analysis, allowing simultaneous temporal and spectral assessment. We feed these images into convolutional neural networks and consider combining models using ensemble stacking. Our modeling framework achieves high accuracy and power across a diverse set of evolutionary settings, including population size changes and test sets of varying sweep strength, softness, and timing. A scan of central European whole-genome sequences recapitulated well-established sweep candidates and predicted novel cancer-associated genes as sweeps with high support. Given that this modeling framework is also robust to missing genomic segments, we believe that it will represent a welcome addition to the population-genomic toolkit for learning about adaptive processes from genomic data.

Keywords: artificial intelligence; natural selection; signal decomposition.


Figures

<sc>Fig</sc>. 1.
Fig. 1.
Depiction of a c=1 channel convolutional neural network (CNN) architecture. A summary statistic signal of length n=128 is used as input to a spectral analysis method (either wavelet decomposition, multitaper analysis, or S-transform) to decompose the signal into a matrix of dimensions m×n, with m=65, which is then standardized at each element based on the mean and standard deviation across all N=18,000 training observations, and is then used as input to a CNN. The CNN has two convolution layers (three layers for the S-transform), followed by a dense layer with n nodes containing both elastic-net and dropout regularization. The output layer of the CNN is a softmax that computes the probability of a sweep.
<sc>Fig</sc>. 2.
Fig. 2.
Mean spectral analysis input matrices for n=128 windows of the mean pairwise sequence differences π^ across the N/2=9,000 neutral and N/2=9,000 sweep replicates under the Equilibrium_fixed dataset containing an equilibrium constant-size demographic history and a sweep that completed t=0 generations before sampling. Top row are neutral simulations and bottom row are sweep simulations. Spectral methods are depicted from left to right columns for the wavelet decomposition, multitaper analysis, and the S-transform, respectively. Elements of each matrix have been scaled to have a standard deviation of one across all N simulated replicates for a given spectral analysis method.
<sc>Fig</sc>. 3.
Fig. 3.
Depiction of the SISSSCO[27CD] model. Each summary statistic signal (π^, H1, H12, H2/H1 and frequencies of the first five most common haplotypes respectively denoted by P1 to P5) of length n=128 is used as input to each of the three spectral analysis method (wavelet decomposition, multitaper analysis, and S-transform) to decompose the signal into three matrices of dimension m×n, with m=65, which are then each standardized at each element based on the mean and standard deviation across all N=18,000 training observations. These 27 images (9 statistics across 3 spectral analysis methods) each used as input to train 27 independent convolutional neural networks (CNNs). The CNNs have two convolution layers (three layers for the S-transform), followed by a dense layer with n nodes containing both elastic-net and dropout regularization. The output layer of the CNN is a softmax that computes the probability of a sweep. After training, the model parameters are fixed, and the dense layers of the 27 CNNs are concatenated and these 27n=3,456 nodes are used as input to a new output layer, which computes the probability of a sweep as a softmax.
<sc>Fig</sc>. 4.
Fig. 4.
Classification rates and accuracies as depicted by confusion matrices to differentiate sweeps from neutrality on the Nonequilibrium_variable dataset for the six SISSSCO architectures compared to SURFDAWave, diploS/HIC, and evolBoosting. The Nonequilibrium_variable dataset is based on the nonequilibrium recent strong bottleneck demographic history of central European humans (CEU population in the 1000 Genomes Project) and a sweep that completed t[0, 1,200] generations before sampling.
<sc>Fig</sc>. 5.
Fig. 5.
Power to detect sweeps as depicted by ROC curves on the Nonequilibrium_variable dataset for the six SISSSCO architectures compared to SURFDAWave, diploS/HIC, and evolBoosting. The Nonequilibrium_variable dataset is based on the nonequilibrium recent strong bottleneck demographic history of central European humans (CEU population in the 1000 Genomes Project) and a sweep that completed t[0, 1,200] generations before sampling. The right panel is a zoom in on the upper left-hand corners of the left panel.
<sc>Fig</sc>. 6.
Fig. 6.
Classification rates and accuracies as depicted by confusion matrices to differentiate sweeps from neutrality on the Nonequilibrium_variable dataset when test data contain missing genomic segments for the six SISSSCO architectures compared to SURFDAWave, diploS/HIC, and evolBoosting. The Nonequilibrium_variable dataset is based on the nonequilibrium recent strong bottleneck demographic history of central European humans (CEU population in the 1000 Genomes Project) and a sweep that completed t[0, 1,200] generations before sampling. Trained models are identical to those in figure 4 and fitted to training observations without missing data, but the test observations derive from sequences containing approximately 30% missing SNPs distributed evenly across 10 nonoverlapping segments.
<sc>Fig</sc>. 7.
Fig. 7.
Saliency maps of the pretrained component CNNs of SISSSCO[27CD] aggregated on the basis of dense layer node weights post concatenation across 9,000 training observations per class. The top left, top right, and bottom images are aggregated using saliency maps generated by nine component single-channel CNNs trained using spectral images generated by wavelet decomposition, S-transform, and multitaper analysis, respectively.
<sc>Fig</sc>. 8.
Fig. 8.
The genome-wide sweep scan results generated by the trained SISSSCO[27CD] model on the central European humans (CEU population in the 1000 Genomes Project). Ten consecutive windows of sweep probability higher than 0.9 was chosen as the qualifying criteria to be classified as a region to be under positive natural selection. In total, 23 genes in 17 regions in the genome show qualifying signs of sweep.

Similar articles

Cited by

References

    1. The 1000 Genomes Project Consortium . 2015. A global reference for human genetic variation. Nature 526:68–74. - PMC - PubMed
    1. Abadi M, Agarwal A, Barham P, Brevdo E, Chen Z, Citro C, Corrado GS, Davis A, Dean J, Devin M, et al. 2015. TensorFlow: large-scale machine learning on heterogeneous systems. Available from:https://www.tensorflow.org/
    1. Abu-Mostafa YS, Atiya AF. 1996. Introduction to financial forecasting. Appl Intel. 6:205–213.
    1. Agrawal A, Mittal N. 2020. Using CNN for facial expression recognition: a study of the effects of kernel size and number of filters on accuracy. Vis Comput. 36:405–412.
    1. Akiyama M. 2014. The roles of ABCA12 in epidermal lipid barrier formation and keratinocyte differentiation. Biochim Biophys Acta. 1841:435–440. - PubMed

Publication types