Observational Study
. 2023 Dec 1;146(12):4935-4948.
doi: 10.1093/brain/awad232.

A data-driven study of Alzheimer's disease related amyloid and tau pathology progression

Affiliations
Observational Study

A data-driven study of Alzheimer's disease related amyloid and tau pathology progression

Leon M Aksman et al. Brain. .

Abstract

Amyloid-β is thought to facilitate the spread of tau throughout the neocortex in Alzheimer's disease, though how this occurs is not well understood. This is because of the spatial discordance between amyloid-β, which accumulates in the neocortex, and tau, which accumulates in the medial temporal lobe during ageing. There is evidence that in some cases amyloid-β-independent tau spreads beyond the medial temporal lobe where it may interact with neocortical amyloid-β. This suggests that there may be multiple distinct spatiotemporal subtypes of Alzheimer's-related protein aggregation, with potentially different demographic and genetic risk profiles. We investigated this hypothesis, applying data-driven disease progression subtyping models to post-mortem neuropathology and in vivo PET-based measures from two large observational studies: the Alzheimer's Disease Neuroimaging Initiative (ADNI) and the Religious Orders Study and Rush Memory and Aging Project (ROSMAP). We consistently identified 'amyloid-first' and 'tau-first' subtypes using cross-sectional information from both studies. In the amyloid-first subtype, extensive neocortical amyloid-β precedes the spread of tau beyond the medial temporal lobe, while in the tau-first subtype, mild tau accumulates in medial temporal and neocortical areas prior to interacting with amyloid-β. As expected, we found a higher prevalence of the amyloid-first subtype among apolipoprotein E (APOE) ε4 allele carriers while the tau-first subtype was more common among APOE ε4 non-carriers. Within tau-first APOE ε4 carriers, we found an increased rate of amyloid-β accumulation (via longitudinal amyloid PET), suggesting that this rare group may belong within the Alzheimer's disease continuum. We also found that tau-first APOE ε4 carriers had several fewer years of education than other groups, suggesting a role for modifiable risk factors in facilitating amyloid-β-independent tau. Tau-first APOE ε4 non-carriers, in contrast, recapitulated many of the features of primary age-related tauopathy. The rate of longitudinal amyloid-β and tau accumulation (both measured via PET) within this group did not differ from normal ageing, supporting the distinction of primary age-related tauopathy from Alzheimer's disease. We also found reduced longitudinal subtype consistency within tau-first APOE ε4 non-carriers, suggesting additional heterogeneity within this group. Our findings support the idea that amyloid-β and tau may begin as independent processes in spatially disconnected regions, with widespread neocortical tau resulting from the local interaction of amyloid-β and tau. The site of this interaction may be subtype-dependent: medial temporal lobe in amyloid-first, neocortex in tau-first. These insights into the dynamics of amyloid-β and tau may inform research and clinical trials that target these pathologies.

Keywords: Alzheimer's disease; PART; PET imaging; data-driven subtyping; neuropathology.


Conflict of interest statement

The authors report no competing interests.

Figures
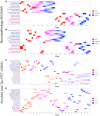
Figure 1
Figure 1
Positional variance diagrams (PVDs) for two-subtype SuStaIn models. Each panel represents a subtype, i.e. a unique pattern of disease progression from early to late stage disease. (A and B) PVDs for two-subtype model trained on trained on ROSMAP's neuropathology data. A is the ‘amyloid-first’ subtype, B is the ‘tau-first’ subtype. (C and D) PVDs for two-subtype model trained on ADNI's amyloid and tau PET SUVR data. C is the ‘amyloid-first’ subtype, D is the ‘tau-first’ subtype. Each coloured box represents the degree of certainty that a given regional marker (y-axis) has reached a given severity stage at a given SuStaIn stage (x-axis).
Figure 2
Figure 2
Differences in Aβ and tau measures across early-stage groups. Top: Pathology measures across early-stage groups in the neuropathology analysis. (A and B) Raw Aβ plaque measures (percentage of region) in the angular gyrus and midfrontal regions, showing the expected increase in Aβ plaques in the two early amyloid-first groups (APOE ε4−, ε4+) with reference lines based on average values of those diagnosed as possible, probable and definite Alzheimer’s disease based on CERAD scoring of neuritic plaques. (C and D) Raw tangle density measures (per mm2) in the entorhinal and hippocampal regions, showing the expected increase in the two early tau-first groups with reference lines based on average values of those assigned Braak I–VI stages. Bottom: Biomarker measures across early-stage groups in the PET-based analysis. (E) Amyloid PET global SUVR, showing expected increase in both early amyloid-first groups and a small increase in early tau-first group (ε4−). Reference line: amyloid PET positivity threshold of 1.11 or greater. (F) CSF Aβ42/Aβ40 ratio, showing decreased ratio (increased Aβ deposition) in early amyloid-first (ε4+) group relative to both early amyloid-first (ε4−) and stage zero groups. Reference line: CSF Aβ42/Aβ40 ratio positivity threshold of 0.06 or less. (G) Tau PET entorhinal region SUVR, showing expected increase in tau pathology in both early tau-first groups. Reference line: regional positivity threshold of 1.2 or greater. (H) CSF pTau, showing small increase in early amyloid-first (ε4+). Reference line: positivity threshold of 21 or greater. SUVR = standardized update value ratio.
Figure 3
Figure 3
Demographic measures across early stage groups along with a comparison of proportion of each group within APOE ε4+ and ε4− participants. Top: ROSMAP neuropathology analysis, showing (A) no differences in age between groups; (B) early amyloid-first (ε4+) group has a higher proportion of females than the stage zero group; (C) small increase in years of education in early amyloid-first (ε4+) versus early amyloid-first (ε4−) group; and (D) higher prevalence of early amyloid-first group within ε4+ participants. Bottom: ADNI PET-based analysis, showing (E) small increase in age in early tau-first (ε4+) group relative to stage zero group; (F) higher proportion of females in early tau-first groups relative to stage zero group; (G) fewer years of education in the early tau-first (ε4+) group versus both early tau-first (ε4−) and stage zero groups; and (H) as in neuropathology analysis, a higher prevalence of early amyloid-first group within ε4+ participants.
Figure 4
Figure 4
Longitudinal consistency of PET-based model. On the left are spaghetti plots of participants with either amyloid-first (A; n = 78) or tau-first (C; n = 47) as their estimated baseline subtype, stratified by APOE ε4 status within each figure. Each participant's longitudinal stage progression is depicted as a connected line, with opposite colours and ‘x’ markers used for points where the follow-up subtype is not consistent with the baseline subtype. The dashed lines represent the early-stage cut-off for each subtype (amyloid-first: stage 9, tau-first: stage 10). On the right are confusion matrices built by comparing each participant's estimated baseline subtype to their estimated 2-year follow-up subtype, stratified by APOE ε4 status (B: n = 58 ε4−, D: n = 45 ε4+).
Figure 5
Figure 5
Longitudinal amyloid and tau PET SUVR trajectories for early-stage groups in PET-based model based on linear mixed effects models. (A) Amyloid PET-based global standardized update value ratio (SUVR) trajectories using composite reference region that is recommended for longitudinal analysis, with an abnormality cut-off of 0.78 as reference line. (BD) Tau PET-based Braak composite SUVR trajectories with empirically chosen abnormality cut-offs based on distributions presented in Supplementary Table 8 (1.3 for Braak I in B, 1.25 for Braak III/IV in C, 1.2 for Braak V/VI in D).
Figure 6
Figure 6
Proposed model of Aβ and tau spread based on our findings. We consistently identified amyloid-first and tau-first subtypes based on PET and neuropathology measures. The amyloid-first subtype represents the typical course of AD progression in which amyloid-β (Aβ) initially spreads throughout the cortex, represented by the lightest orange circle in the figure. Moderate-to-severe Aβ, represented by the darker orange circles, eventually interacts with age-related tau within the MTL, setting off the spread of tau throughout the neocortex. Mild, moderate and severe tau are represented by the purple circles. In APOE ε4 carriers this process may happen at an earlier age due to earlier Aβ accumulation. The tau-first subtype is marked by the initial accumulation of mild tau in the MTL and/or neocortex. Tau-first APOE ε4 non-carriers recapitulate the features of PART and are either partially or completely protected from Aβ accumulation. Tau-first APOE ε4 carriers, which are rare, may belong within the AD continuum based on their increased rate of Aβ accumulation. Within this group the site of interaction between moderate-to-severe Aβ and mild tau may take place in either the neocortex or MTL, which then accelerates the spread of neocortical tau.

References

    1. Bloom GS. Amyloid-β and tau: The trigger and bullet in Alzheimer disease pathogenesis. JAMA Neurol. 2014;71:505–508. - PubMed
    1. Hardy JA, Higgins GA. Alzheimer’s disease: The amyloid cascade hypothesis. Science. 1992;256:184–185. - PubMed
    1. Selkoe DJ. The molecular pathology of Alzheimer’s disease. Neuron. 1991;6:487–498. - PubMed
    1. Braak H, Braak E. Frequency of stages of Alzheimer-related lesions in different age categories. Neurobiol Aging. 1997;18:351–357. - PubMed
    1. Braak H, Thal DR, Ghebremedhin E, Del Tredici K. Stages of the pathologic process in Alzheimer disease: Age categories from 1 to 100 years. J Neuropathol Exp Neurol. 2011;70:960–969. - PubMed

Publication types