

Counts, incidence rates, and trends of pediatric cancer in the United States, 2003-2019
- PMID: 37433078
- PMCID: PMC11018256
- DOI: 10.1093/jnci/djad115
Counts, incidence rates, and trends of pediatric cancer in the United States, 2003-2019
Abstract
Background: Cancer is a leading cause of death by disease among children and adolescents in the United States. This study updates cancer incidence rates and trends using the most recent and comprehensive US cancer registry data available.
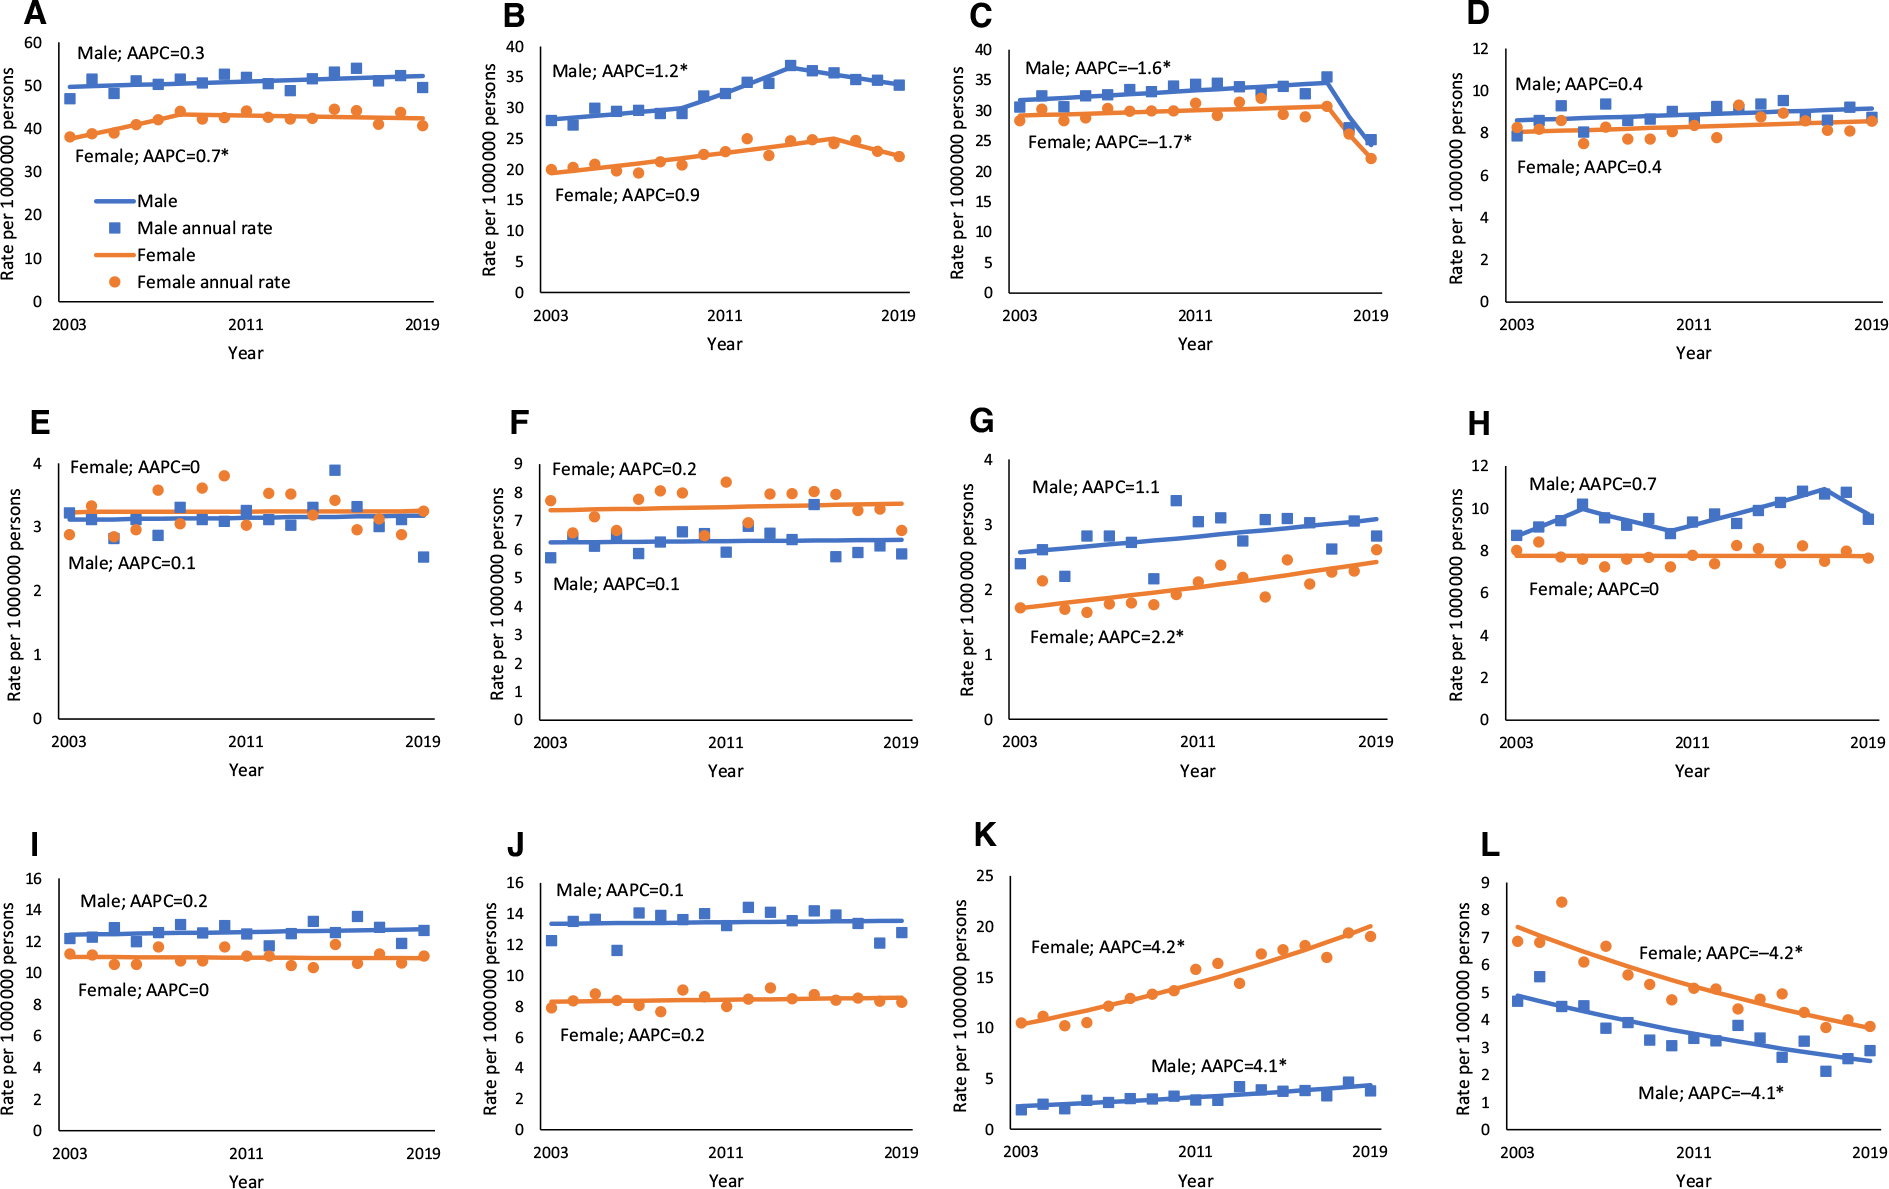
Methods: We used data from US Cancer Statistics to evaluate counts, age-adjusted incidence rates, and trends among children and adolescents younger than 20 years of age diagnosed with malignant tumors between 2003 and 2019. We calculated the average annual percent change (APC) and APC using joinpoint regression. Rates and trends were stratified by demographic and geographic characteristics and by cancer type.
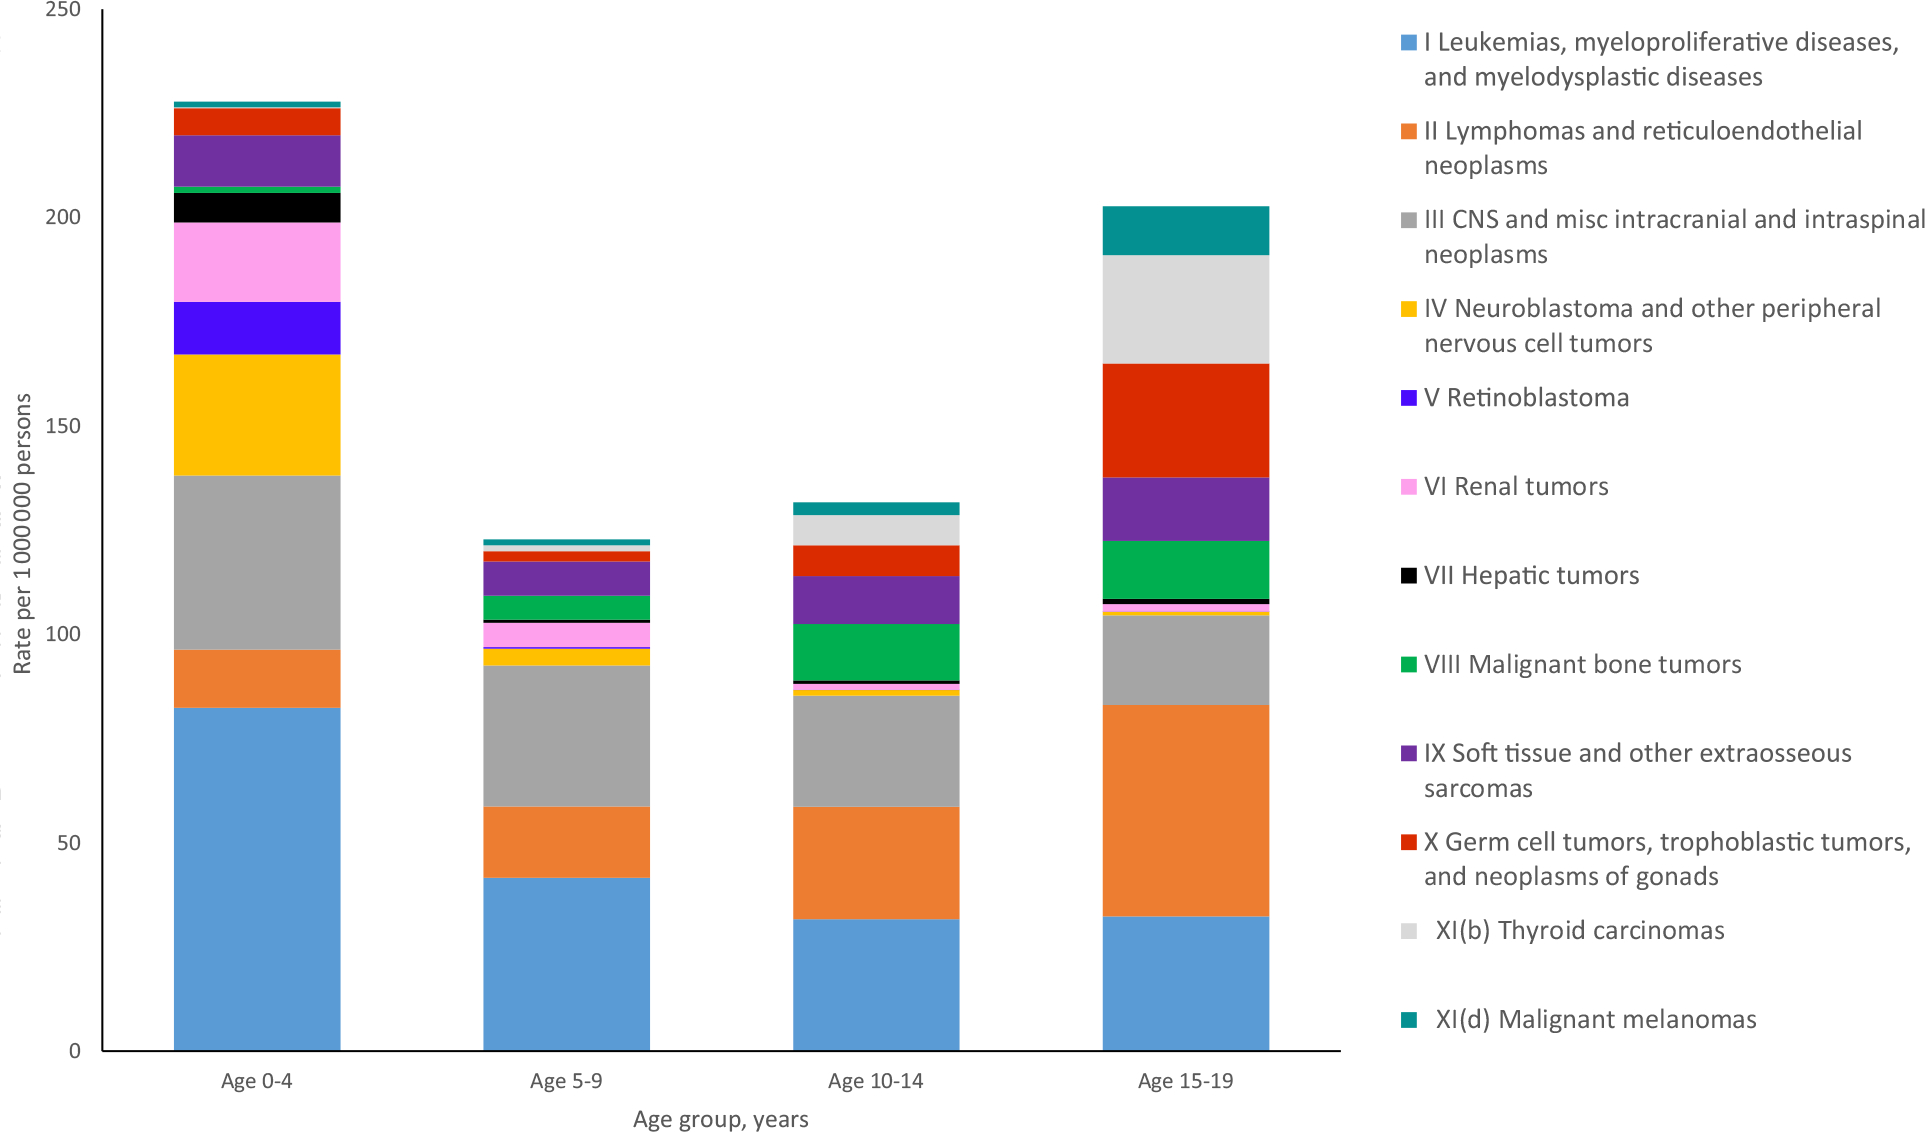
Results: With 248 749 cases reported between 2003 and 2019, the overall cancer incidence rate was 178.3 per 1 million; incidence rates were highest for leukemia (46.6), central nervous system neoplasms (30.8), and lymphoma (27.3). Rates were highest for males, children 0 to 4 years of age, Non-Hispanic White children and adolescents, those in the Northeast census region, the top 25% of counties by economic status, and metropolitan counties with a population of 1 million people or more. Although the overall incidence rate of pediatric cancer increased 0.5% per year on average between 2003 and 2019, the rate increased between 2003 and 2016 (APC = 1.1%), and then decreased between 2016 and 2019 (APC = -2.1%). Between 2003 and 2019, rates of leukemia, lymphoma, hepatic tumors, bone tumors, and thyroid carcinomas increased, while melanoma rates decreased. Rates of central nervous system neoplasms increased until 2017, and then decreased. Rates of other cancer types remained stable.
Conclusions: Incidence of pediatric cancer increased overall, although increases were limited to certain cancer types. These findings may guide future public health and research priorities.
Published by Oxford University Press 2023.
Conflict of interest statement
Conflicts of interest
Philip Lupo is a JNCI associate editor but was not involved in the editorial review of this manuscript. The authors have no other disclosures or conflicts to state.
Figures


References
-
- U.S. Cancer Statistics Working Group. U.S. Cancer Statistics Data Visualizations Tool, based on 2021 submission data (1999–2019). Centers for Disease Control and Prevention. 2022. https://www.cdc.gov/cancer/dataviz. Accessed January 3, 2023.
-
- Ward E, DeSantis C, Robbins A, Kohler B, Jemal A. Childhood and adolescent cancer statistics, 2014. CA Cancer J Clin. 2014;64(2):83–103. - PubMed
-
- Howlader N, Noone AM, Krapcho M, et al., eds. SEER Cancer Statistics Review, 1975–2018. 2021. https://seer.cancer.gov/csr/1975_2018/. Accessed January 3, 2023.
MeSH terms
Grants and funding
LinkOut - more resources
Full Text Sources
Medical
