Quantitative Attribution of the Protective Effects of Aminosterols against Protein Aggregates to Their Chemical Structures and Ability to Modulate Biological Membranes
- PMID: 37433124
- PMCID: PMC10388293
- DOI: 10.1021/acs.jmedchem.3c00182
Quantitative Attribution of the Protective Effects of Aminosterols against Protein Aggregates to Their Chemical Structures and Ability to Modulate Biological Membranes
Abstract
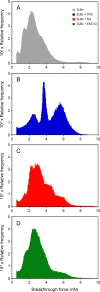
Natural aminosterols are promising drug candidates against neurodegenerative diseases, like Alzheimer and Parkinson, and one relevant protective mechanism occurs via their binding to biological membranes and displacement or binding inhibition of amyloidogenic proteins and their cytotoxic oligomers. We compared three chemically different aminosterols, finding that they exhibited different (i) binding affinities, (ii) charge neutralizations, (iii) mechanical reinforcements, and (iv) key lipid redistributions within membranes of reconstituted liposomes. They also had different potencies (EC50) in protecting cultured cell membranes against amyloid-β oligomers. A global fitting analysis led to an analytical equation describing quantitatively the protective effects of aminosterols as a function of their concentration and relevant membrane effects. The analysis correlates aminosterol-mediated protection with well-defined chemical moieties, including the polyamine group inducing a partial membrane-neutralizing effect (79 ± 7%) and the cholestane-like tail causing lipid redistribution and bilayer mechanical resistance (21 ± 7%), linking quantitatively their chemistry to their protective effects on biological membranes.
Conflict of interest statement
The authors declare the following competing interest(s): M.Z. and D.B. are inventors in patents for the use of the three AMs in the treatment of Alzheimer’s and Parkinson’s diseases and are cofounders and stockholders in Enterin, Inc. M.V. is a founder of Wren Therapeutics Ltd., which is independently pursuing inhibitors of protein aggregation. The remaining authors declare no competing interests. The views expressed herein are those of the authors and do not reflect the position of the United States Military Academy, the Department of the Army, or the Department of Defense.
Figures


Similar articles
-
Misfolding of amyloidogenic proteins and their interactions with membranes.Biomolecules. 2013 Dec 27;4(1):20-55. doi: 10.3390/biom4010020. Biomolecules. 2013. PMID: 24970204 Free PMC article. Review.
-
Quantitative Measurement of the Affinity of Toxic and Nontoxic Misfolded Protein Oligomers for Lipid Bilayers and of its Modulation by Lipid Composition and Trodusquemine.ACS Chem Neurosci. 2021 Sep 1;12(17):3189-3202. doi: 10.1021/acschemneuro.1c00327. Epub 2021 Aug 12. ACS Chem Neurosci. 2021. PMID: 34382791 Free PMC article.
-
Toxic oligomers of the amyloidogenic HypF-N protein form pores in mitochondrial membranes.Sci Rep. 2020 Oct 20;10(1):17733. doi: 10.1038/s41598-020-74841-z. Sci Rep. 2020. PMID: 33082392 Free PMC article.
-
Alzheimer Aβ peptide interactions with lipid membranes: fibrils, oligomers and polymorphic amyloid channels.Prion. 2012 Sep-Oct;6(4):339-45. doi: 10.4161/pri.21022. Epub 2012 Aug 9. Prion. 2012. PMID: 22874669 Free PMC article.
-
The two-fold aspect of the interplay of amyloidogenic proteins with lipid membranes.Chem Phys Lipids. 2009 Mar;158(1):1-9. doi: 10.1016/j.chemphyslip.2008.11.003. Epub 2008 Nov 14. Chem Phys Lipids. 2009. PMID: 19056366 Review.
Cited by
-
Protective effect of trehalose sugar on amyloid-membrane interactions using BLM electrophysiology.Biophys J. 2024 Jun 18;123(12):1690-1704. doi: 10.1016/j.bpj.2024.05.012. Epub 2024 May 15. Biophys J. 2024. PMID: 38751113 Free PMC article.
-
An aminosterol breaks the autocatalytic cycle of Aβ42 aggregation and protects cell membranes from its soluble aggregates.Proc Natl Acad Sci U S A. 2025 Jul 15;122(28):e2417944122. doi: 10.1073/pnas.2417944122. Epub 2025 Jul 7. Proc Natl Acad Sci U S A. 2025. PMID: 40623182 Free PMC article.
-
Leveraging Machine Learning-Guided Molecular Simulations Coupled with Experimental Data to Decipher Membrane Binding Mechanisms of Aminosterols.J Chem Theory Comput. 2024 Jul 9;20(18):8279-89. doi: 10.1021/acs.jctc.4c00127. Online ahead of print. J Chem Theory Comput. 2024. PMID: 38979909 Free PMC article.
-
Squalamine reverses age-associated changes of firing patterns of myenteric sensory neurons and vagal fibres.Commun Biol. 2024 Jan 10;7(1):80. doi: 10.1038/s42003-023-05623-2. Commun Biol. 2024. PMID: 38200107 Free PMC article.
-
Anti-aging properties of the aminosterols of the dogfish shark.NPJ Aging. 2024 Dec 19;10(1):62. doi: 10.1038/s41514-024-00188-8. NPJ Aging. 2024. PMID: 39702521 Free PMC article. Review.
References
-
- Perni M.; Galvagnion C.; Maltsev A.; Meisl G.; Müller M. B.; Challa P. K.; Kirkegaard J. B.; Flagmeier P.; Cohen S. I.; Cascella R.; Chen S. W.; Limbocker R.; Sormanni P.; Heller G. T.; Aprile F. A.; Cremades N.; Cecchi C.; Chiti F.; Nollen E. A.; Knowles T. P.; Vendruscolo M.; Bax A.; Zasloff M.; Dobson C. M. A Natural Product Inhibits the Initiation of α-Synuclein Aggregation and Suppresses its Toxicity. Proc. Natl. Acad. Sci. U. S. A. 2017, 114, E1009–E1017. - PMC - PubMed
-
- Perni M.; Flagmeier P.; Limbocker R.; Cascella R.; Aprile F. A.; Galvagnion C.; Heller G. T.; Meisl G.; Chen S. W.; Kumita J. R.; Challa P. K.; Kirkegaard J. B.; Cohen S. I. A.; Mannini B.; Barbut D.; Nollen E. A. A.; Cecchi C.; Cremades N.; Knowles T. P. J.; Chiti F.; Zasloff M.; Vendruscolo M.; Dobson C. M. Multistep Inhibition of α-Synuclein Aggregation and Toxicity in Vitro and in Vivo by Trodusquemine. ACS Chem. Biol. 2018, 13, 2308–2319. 10.1021/acschembio.8b00466. - DOI - PubMed
Publication types
MeSH terms
Substances
LinkOut - more resources
Full Text Sources
Medical

